
Abstract
Purpose
To investigate the value of susceptibility weighted imaging (SWI) for assessing the hyperacute outcome of ablation of uterine fibroids immediately after magnetic resonance-guided focused ultrasound (MRgFUS) treatment.
Methods
This retrospective imaging study included patients who underwent SWI and contrast-enhanced (CE) MR within 15 min of MRgFUS ablation for uterine fibroids. Two readers independently assessed the SWI features of ablative lesions and their association with the non-perfused volume (NPV) ratio. The intraclass correlation coefficient (ICC) and diagnostic value of SWI findings were calculated.
Results
A total of 27 uterine fibroids from 21 participants (mean age 40.1 ± 7.2 years) were analyzed. 51.9% (14/27) leiomyomas had NPV ratio ≥90%. In post-ablation SWI images, the interobserver ICC for the relative signal intensity and hypointense peripheral rim were 0.613 and 0.843, respectively (both p < .001). There was a significant difference in the prevalence of hypointense peripheral rim in leiomyomas with NPV ratio ≥90% and < 90% (p < .01), while the prevalence of relative signal intensity showed no significant difference (p > .05). When using the complete hypointense peripheral rim as a diagnostic criterion to identify NPV ratio ≥ 90%, readers 1 and 2 showed diagnostic sensitivity, specificity, and accuracy of 85.7%, 76.9%, 81.5%, and 78.6%, 76.9%, 77.8%, respectively.
Conclusion
Identifying a complete hypointense peripheral rim on SWI may be a potential imaging marker for assessing the hyperacute outcome of uterine fibroids ablation by MRgFUS, specifically in determining whether the NPV ratio is ≥90%.
Introduction
Magnetic resonance-guided focused ultrasound (MRgFUS), also known as magnetic resonance-guided high-intensity focused ultrasound (MRgHIFU), is becoming increasingly popular as an effective and noninvasive treatment for uterine fibroids [Citation1–3]. Clinical success rates are affected by an important predictor known as the nonperfused volume (NPV) ratio [Citation4,Citation5]. Currently, T1-weighted MR after the administration of gadolinium-based contrast agents is considered the gold standard for evaluating NPV after MRgFUS ablation [Citation5–7]. However, contrast-enhanced (CE) imaging is limited for intraoperative guidance of MRgFUS due to some safety concerns associated with gadolinium-based contrast agents [Citation2,Citation8,Citation9]. As a result, there is a need for a new imaging tool that does not require such agents but can still offer valuable information on ablation.
Histological analysis has shown hemorrhage in the focused ultrasound thermal ablation region, typically surrounding coagulative necrosis [Citation10–12]. According to the literature, susceptibility weighted imaging (SWI) is highly sensitive to blood products, making it the ideal sequence for detecting microbleeds [Citation13,Citation14]. Some studies have demonstrated SWI's ability to reveal hemorrhages in uterine leiomyomas or endometriomas [Citation15,Citation16], but no study has assessed the outcome of ablation. A study conducted by Yamahana et al. demonstrated that SWI can aid in assessing embolic effects on leiomyomas during the acute phase after uterine artery embolization (UAE) [Citation17]. However, their study only utilized SWI 1 week after UAE and not during treatment. Therefore, it was necessary to perform an intraoperative study to confirm the applicability of SWI for the immediate assessment of hyperacute outcomes of MRgFUS ablation. From September 2021 to December 2022, we performed SWI within 15 min of MRgFUS ablation of the uterine fibroids. We aimed to investigate the value of SWI in assessing ablative necrotic lesions immediately after MRgFUS ablation.
Materials and methods
Patients
This retrospective study was conducted in accordance with the Declaration of Helsinki and approved by the ethics committee of our hospital. All patients provided written informed consent prior to treatment. This single-institution retrospective study analyzed patients who underwent MRgFUS treatment for uterine fibroids between September 2021 and December 2022. The inclusion criteria were as follows: (1) women aged 18–55 years; (2) patients with symptomatic uterine fibroids confirmed by clinical testing and MRI; (3) maximum diameter of lesion was ≥2.5 cm; (4) patients who underwent MRgFUS treatment; and (5) patients who underwent SWI and CE T1-weighted imaging immediately after treatment. Patients who met any of the following criteria were excluded from the study: (1) suspected uterine fibroids of red degeneration or leiomyosarcoma; (2) prior UAE or ablation treatment; (3) discontinuation of treatment; (4) missing SWI and/or contrast-enhanced MR examination data; and (5) poor image quality on SWI and/or CE T1-weighted imaging, resulting in an inability to observe and measure.
MRgFUS treatment
MRgFUS ablation was performed by two experienced radiologists using a focused ultrasound system (ExAblate2100, InSightec, Haifa, Israel) guided by a 3-T MR system (Discovery 750 W; GE Healthcare, Connecticut, USA) equipped with a phased-array T/R body coil for pelvic scanning. The patients were placed in a prone position on the treatment table, suitable for both MRI and focused ultrasound surgery. Initially, the physician planned the treatment region, after which the computer divided the region into separate sonication locations. The physician proceeded to target the leiomyoma lesion using sonication, one spot at a time, under the supervision and guidance of the MR. The treatment was deemed complete after completing all the designated sonication spots.
MR imaging
The MR system and body coil for MRgFUS were also used to conduct MR on a treatment table. An axial SWI scan was performed within 15 min of MRgFUS ablation, followed by CE MR. Intravenous administration of 0.1 mmol/kg of Gadoteric Acid Meglumine (Hengrui Pharmaceutical, Lianyungang, China) was followed by tri-planar FSPGR T1-weighted scanning. shows the scanning parameters for SWI and axial-plane CE MR.
Table 1. Magnetic resonance imaging parameters.
Image analysis
A non-enhanced zone on CE T1-weighted imaging was defined as an ablated necrotic lesion created by MRgFUS treatment [Citation6,Citation7]. One reader, with >20 years’ experience in pelvic MR, reviewed the post-ablation CE T1-weighted imaging, identifying and numbering the leiomyomas with maximum diameter ≥2.5 cm. Axial CE T1-weighted images and corresponding SWI images of each leiomyoma were chosen for analysis. The NPV ratio was defined as the ratio of the ablated necrotic volume to the total tumor volume for each leiomyoma. NPV and volume of leiomyoma were determined using the ‘post-treatment’ protocol on the MRgFUS workstation. The non-enhanced region on all slices of the leiomyoma was demarcated using CE-MR images, and the workstation automatically calculated the corresponding volume. The NPV ratio was classified into two categories: complete or almost complete ablation (≥90%) and partial ablation (<90%).
Two experienced radiologists with >20 years of experience in pelvic MR analyzed the axial CE T1-weighted imaging and SWI images of each leiomyoma using the picture archiving and communication system (YLZ Information Technology, Xiamen, China) while being blinded to the patient’s information. Prior to interpretation, they discussed the SWI features to be analyzed and arrived at the following consensus:
SWI feature 1: Relative signal intensity. Relative signal intensity refers to the signal intensity of the ablated necrotic lesion relative to the surrounding residual myoma on the SWI images. As the two readers did not classify the signal intensity of ablated necrotic lesions as higher than the surrounding residual myoma, the relative signal intensity was classified into lower () and similar () categories.
SWI feature 2: hypointense peripheral rim. The hypointense peripheral rim is a line-like hypointense area observed on the surface of the ablated necrotic lesion on SWI images. It was classified into three categories: complete (involved ≥ 90% of the circumference of the ablated zone, ), partial (involved 50%–90% of the circumference of the ablated zone, ), and absent (involved less than 50% of the circumference of the ablated zone, ).
Figure 1. The lower relative signal intensity of leiomyomas on SWI after MRgFUS treatment. The left, Middle, and right figures show the CE, SWI imaging, and SWI sketch of the same leiomyoma. (Left) The axial CE imaging shows the ablated necrotic lesion is observed as non-enhancing hypointense zones (star), and surrounding residual leiomyoma appeared as enhancing hyperintense zones (arrow). (Middle) the corresponding axial SWI shows the signal intensity of the ablated necrotic lesion (star) is lower than the surrounding residual leiomyoma (arrow). (Right) the sketch map illustrates the extent of the ablated lesion (black area) and residual leiomyoma (white area).
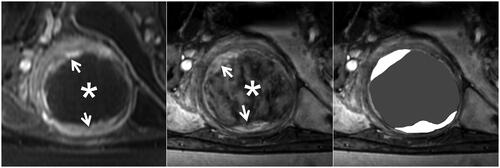
Figure 2. The similar relative signal intensity of leiomyomas on SWI after MRgFUS treatment. The left, Middle, and right figures show the CE, SWI imaging, and SWI sketch of the same leiomyoma. (Left) The axial CE imaging shows that the ablated necrotic lesion is observed as non-enhancing hypointense zones (star), and surrounding residual leiomyoma appeared to be an enhancing hyperintense zone (arrow). (Middle) The corresponding axial SWI shows that the ablated necrotic lesion (star) signal intensity is similar to residual leiomyoma (arrow). (Right) The sketch map illustrates the extent of the ablated lesion (black area) and residual leiomyoma (white area).
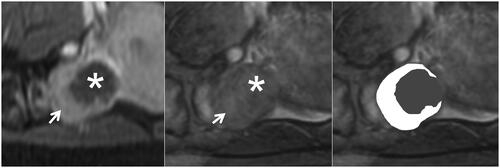
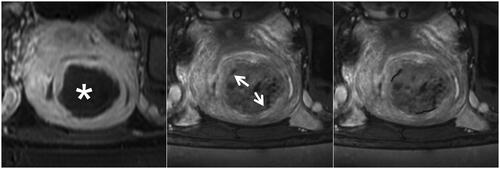
Figure 3. The complete hypointense peripheral rim on SWI. The left, Middle, and right figures are the CE, SWI imaging, and SWI sketch of the same leiomyoma. (Left) The axial CE imaging shows the range of ablated necrotic lesions, which appear as a non-enhancing hypointense zone (star). (Middle) The corresponding axial SWI shows a complete hypointense peripheral rim (arrow). (Right) The sketch map illustrates the range of the hypointense peripheral rim (black line); it involves ≥90% of the circumference of the ablated zone.
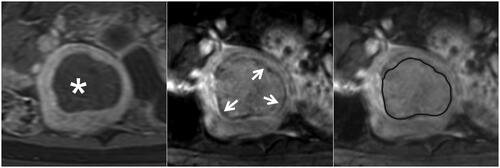
Figure 4. The partial hypointense peripheral rim on SWI. The left, Middle, and right figures are the CE, SWI imaging, and SWI sketch of the same leiomyoma. (Left) The axial CE imaging shows the range of ablated necrotic lesions, which appear as a non-enhancing hypointense zone (star). (Middle) the corresponding axial SWI shows a partial hypointense peripheral rim (arrow). (Right) The sketch map illustrates the range of the hypointense peripheral rim (black line); it involves 50%–90% of the circumference of the ablated zone.
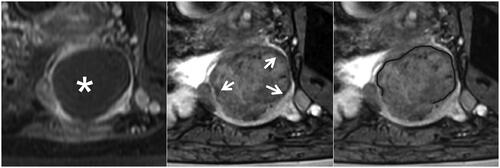
Figure 5. The partial hypointense peripheral rim on SWI. The left, middle, and right figures are the CE, SWI imaging, and SWI sketch of the same leiomyoma. (Left) The axial CE imaging shows the range of ablated necrotic lesions, which appear as a non-enhancing hypointense zone (star). (Middle) the corresponding axial SWI shows an absent hypointense peripheral rim (arrow). (Right) the sketch map illustrates the range of the hypointense peripheral rim (black line); it is non-continuous and involves less than 50% of the circumference of the ablated zone.
Statistical analysis
Continuous variables were presented as mean ± standard deviation, while categorical variables were expressed as numbers and percentages. The intraclass correlation coefficient (ICC) was used to analyze the inter-observer consistency of the SWI features. Consistency was categorized as poor (<0.50), moderate (0.51–0.75), good (0.76–0.90), or excellent (0.91–1.00). To compare the SWI features of lesions with different NPV ratios, we used the chi-squared test (Pearson’s chi-squared test or Fisher’s exact test). The sensitivity, specificity, accuracy, positive predictive value, negative predictive value, positive likelihood ratio, and negative likelihood ratio were calculated to diagnose SWI features with an NPV ratio ≥90%. Statistical analysis was conducted using SPSS (version 22; IBM Corporation, Armonk, USA), with a P value of <.05 considered statistically significant throughout.
Results
Patients and uterine fibroids
Of the 22 patients who underwent SWI, one (4.5%) was excluded because of significant artifacts in the SWI image that hindered proper viewing. A total of 21 female patients were analyzed, with a mean age of 40.1 ± 7.2 years, ranging from 27–51 years. Two patients had three fibroids, two had two fibroids, and 17 had a single fibroid, leading to a total of 27 uterine fibroid lesions enrolled in the final analysis. Of these 27 fibroids, 51.9% (14 of 27) had an NPV ratio ≥ 90%, while 48.1% (13 of 27) had an NPV ratio <90%, as demonstrated by CE MR imaging.
MR findings of ablated necrotic lesions
After MRgFUS treatment, ablated lesions of uterine leiomyomas were observed as non-enhancing hypointense zones on CE MR, while the surrounding residual leiomyomas appeared as enhancing hyperintense zones (). The clear contrast between the two zones makes them easy to distinguish. Compared with CE MR, the SWI manifestations of ablated necrotic lesions were more diverse ( and ), as depicted in . The ICC for assessing the relative signal intensity of the ablated necrotic lesions was 0.613 (95% CI: 0.310–0.803, p = .001). We observed that 63.0% (17/27) and 59.3% (16/27) of the necrotic lesions exhibited lower signal intensities than the surrounding residual leiomyomas, which was the most common type of intensity (). The ICC of the two readers in identifying the hypointense peripheral rim was 0.843 (95% CI: 0.684–0.925, p < .001). The observations of the two readers indicated that 55.6% (15/27) and 51.9% (14/27) of the lesions displayed a complete peripheral hypointense rim (), whereas 22.2% (6/27) and 22.2% (6/27) of the lesions had a partial peripheral hypointense rim ().
Table 2. SWI characteristics of lesions after MRgFUS ablation.
Value of SWI features in predicting NPV ratio ≥ 90%
The occurrence of the two SWI features in leiomyomas with NPV ratios ≥90% and <90% is shown in . The results showed a significant difference in the incidence of hypointense peripheral rims between the two groups (85.7%, 7.1%, and 7.1% vs. 23.1%, 38.5%, and 38.5%, respectively; reader 1, p = .002; 78.6%, 14.3%, and 7.1% vs. 23.1%, 30.8%, and 46.2%, respectively; reader 2, p = .016). No significant statistical difference was observed in the relative signal intensity incidence of leiomyomas with NPV ratios ≥90% and <90% (p = .695 and 1.00). displays the hypointense peripheral rim value for the diagnosis of NPV ratio ≥90%. When the cutoff point was defined between a complete and partial hypointense peripheral rim, readers 1 and 2 had diagnostic sensitivity, specificity, and accuracy of 85.7%, 76.9%, 81.5%, and 78.6%, 76.9%, 77.8%, respectively, for an NPV ratio ≥90%. When the cutoff point was defined between a partial and absent hypointense peripheral rim, the diagnostic sensitivity, specificity, and accuracy of readers 1 and 2 for an NPV ratio ≥90% were 92.9%, 38.5%, 66.7%, and 92.9%, 46.2%, 70.4%, respectively.
Table 3. Relationship between characteristic of SWI and NPV ratio groups.
Table 4. Diagnostic value of a hypointense peripheral rim to NPV ratio ≥ 90% (n = 27).
Discussion
It has long been a technical challenge to reliably monitor ablative lesions during MRgFUS treatment using non-gadolinium techniques [Citation18, Citation19]. To the best of our knowledge, the present study is the first to report the value of SWI for evaluating early ablation outcomes of uterine fibroids during MRgFUS treatment. In this study, we investigated the SWI findings of uterine fibroids immediately after MRgFUS treatment. Similar to a previous study of uterine fibroids 1 week after UAE [Citation17], our study performed immediately after MRgFUS revealed a SWI-specific finding, namely, a hypointense peripheral rim. Additionally, we found that this hypointense peripheral rim could be an imaging marker to assess whether the NPV ratio is ≥90%. This technique offers reproducible intraoperative guidance for individualized therapeutic strategies for MRgFUS.
In this study, we analyzed some SWI findings to evaluate ablated necrotic lesions of uterine fibroids, focusing on the relative signal intensity and hypointense peripheral rim. Our findings indicate that the extent of ablative necrotic lesions may be determined by the presence of lower or higher signal intensity types and complete or partial hypointense peripheral rims on the images. The findings from this study indicated that approximately 60% of ablative lesions showed an SWI signal intensity lower than that of the surrounding residual leiomyomas, and approximately 75% of necrotic lesions displayed a complete or partial hypointense peripheral rim. Based on these results, SWI shows promise as a potential nonenhanced method for assessing the ablation outcome of uterine fibroids because of its ability to display the boundaries of the most ablated necrotic lesions [Citation18]. Inter-observer consistency analysis demonstrated a higher ICC for the presence of a hypointense peripheral rim. This finding suggests that a hypointense peripheral rim is a reliable and distinctive characteristic appropriate for clinical use. Another manifestation of SWI, known as the intertumoral lower-signal type, may also help determine the margins of the ablated necrotic lesion. However, our study revealed a suboptimal ICC value for this feature, suggesting relatively high inter-reader variability. Further optimization may be necessary to enhance the inter-reader agreement.
In our study, we conducted SWI within 15 min of MRgFUS ablation. Therefore, a hypointense peripheral rim may be a hyperacute SWI characteristic of uterine fibroids after ablation. Another MRgHIFU case study by Liu et al. showed that a completely dark line around the NPV margin can be seen using T2*-weighted imaging [Citation20]. Yamahana et al. confirmed that a low-signal rim is treatment-related [Citation17]. It is widely recognized that significant hypointensity is a characteristic feature of hemorrhage on SWI or T2*-weighted imaging [Citation13–17,Citation20]. We hypothesized that a small hemorrhage at the surface of the ablated necrotic lesion might underlie the hypointense peripheral rim apparent on SWI and T2*-weighted imaging. Previous histology studies have confirmed the presence of hemorrhagic changes between ablated necrotic lesions and normal lesions [Citation21,Citation22]. Several studies have also revealed that a hypointense peripheral rim on SWI, induced by leiomyoma hemorrhagic infarction [Citation15,Citation17], may correspond to acute thrombosis (hemosiderin or deoxyhemoglobin deposition) in embolized vessels on the surface of a tumor.
Our further study showed that the incidence of the hypointense peripheral rim was higher in ablated lesions with NPV ratio ≥90% than <90%, especially the complete hypointense peripheral rim. This finding was consistent with a prior SWI study on UAE treatment [Citation17] and highlighted the importance of the hypointense peripheral rim for early detection of NPV ratio ≥90%. The present study also examined the diagnostic cutoff for complete and partial rims and found that a ‘complete’ hypointense peripheral rim was more effective in determining whether the NPV ratio of uterine fibroids was ≥90%. The sensitivity, specificity, and accuracy of diagnosing an NPV ratio of ≥90% were 85.7%, 76.9%, and 81.5% for reader 1 and 78.6%, 76.9%, and 77.8% for reader 2, respectively. This finding suggests that a hypointense peripheral rim can serve as an imaging marker to monitor whether a predicted ablative outcome has been achieved, thereby providing additional guidance for MRgFUS in treating uterine fibroids. As a non-gadolinium monitoring technique, SWI could potentially be used for the intraoperative assessment of treatment outcomes during MRgFUS ablation in the future, helping to improve the effectiveness and efficiency of ablation. Meanwhile, the study indicated that using a ‘partial’ hypointense peripheral rim as a diagnostic criterion could increase sensitivity, but it resulted in a diagnostic specificity of less than 50%. This may lead to underablation of uterine leiomyomas, negatively affecting ablation efficacy [Citation4,Citation5]. Because our study had a small number of patients, further study of a larger sample is needed to determine whether a ‘partial’ hypointense peripheral rim can be used as an initial screening indicator.
In addition, compared to other non-contrast enhanced MRI techniques such as T2-weighted imaging and diffusion-weighted imaging [Citation18,Citation19], SWI offers an advantage in identifying an imaging marker, namely, hypointense peripheral rim, as an indicator of whether the NPV ratio is ≥90% for a rapid determination of treatment outcome. However, further studies are necessary to compare the values of the different MR techniques.
This study had some limitations. First, this was a preliminary retrospective study with a small sample size, which may have caused a statistical bias. Thus, validating the diagnostic sensitivity and specificity in a larger cohort is necessary. Second, SWI was performed only after MRgFUS treatment, and dynamic changes in SWI were not observed. In future studies, additional repetitive SWI scans during MRgFUS will be required to determine the dynamic changes in lesions and their value for monitoring treatment. Third, because our study lacked histopathological results for comparison, a definitive interpretation of the histopathology of the SWI results cannot be provided. For instance, is there a difference in the pathological basis of hypointensity within and on the surface of the lesion? Furthermore, the SWI was limited to providing qualitative assessment in our study. Another new technique, quantitative susceptibility mapping (QSM), can quantitatively assess iron content changes. Further research is required to determine whether QSM can be used as a new reference.
Conclusion
SWI can help immediately assess the extent of ablated necrotic lesions in uterine fibroids after MRgFUS ablation. A characteristic SWI feature of ablated necrotic lesions is the presence of a hypointense peripheral rim. Identifying the complete hypointense peripheral rim on SWI may serve as a potential imaging marker for assessing the hyperacute outcome of ablation of uterine fibroids using MRgFUS, specifically in determining whether the NPV ratio is ≥90%.
Disclosure statement
No potential conflict of interest was reported by the author(s).
Data availability statement
Patient data cannot be publicly shared because of the national legislature on patient data. But the data used to support the findings of this study are available from the corresponding author upon request.
Additional information
Funding
References
- Kociuba J, Łoziński T, Zgliczyńska M, et al. Occurrence of adverse events after magnetic resonance-guided high-intensity focused ultrasound (MR-HIFU) therapy in symptomatic uterine fibroids-a retrospective case-control study. Int J Hyperthermia. 2023;40(1):2219436. doi: 10.1080/02656736.2023.2219436.
- Silberzweig JE, Powell DK, Matsumoto AH, et al. Management of uterine fibroids: a focus on uterine-sparing interventional techniques. Radiology. 2016;280(3):675–692. doi: 10.1148/radiol.2016141693.
- Verpalen IM, Anneveldt KJ, Nijholt IM, et al. Magnetic resonance-high intensity focused ultrasound (MR-HIFU) therapy of symptomatic uterine fibroids with unrestrictive treatment protocols: a systematic review and meta-analysis. Eur J Radiol. 2019;120:108700. doi: 10.1016/j.ejrad.2019.108700.
- Mindjuk I, Trumm CG, Herzog P, et al. MRI predictors of clinical success in MR-guided focused ultrasound (MRgFUS) treatments of uterine fibroids: results from a single centre. Eur Radiol. 2015;25(5):1317–1328. doi: 10.1007/s00330-014-3538-6.
- Bitton RR, Fast A, Vu KN, et al. What predicts durable symptom relief of uterine fibroids treated with MRI-guided focused ultrasound? A multicenter trial in 8 academic centers. Eur Radiol. 2023;33(11):7360–7370. doi: 10.1007/s00330-023-09984-4.
- Tempany CM, Stewart EA, McDannold N, et al. MR imaging-guided focused ultrasound surgery of uterine leiomyomas: a feasibility study. Radiology. 2003;226(3):897–905. doi: 10.1148/radiol.2271020395.
- Luo W, Zhang PD, Yang X, et al. Role of contrast-enhanced ultrasonography in MR-guided focused ultrasound ablation on uterus fibroids: lesion selection and assessment of ablative effects. Eur Radiol. 2022;32(3):2110–2119. doi: 10.1007/s00330-021-08294-x.
- Idée JM, Port M, Robic C, et al. Role of thermodynamic and kinetic parameters in gadolinium chelate stability. J Magn Reson Imaging. 2009;30(6):1249–1258. doi: 10.1002/jmri.21967.
- Erdoğan MA, Apaydin M, Armagan G, et al. Evaluation of toxicity of gadolinium-based contrast agents on neuronal cells. Acta Radiol. 2021;62(2):206–214. doi: 10.1177/0284185120920801.
- Venkatesan AM, Partanen A, Pulanic TK, et al. Magnetic resonance imaging-guided volumetric ablation of symptomatic leiomyomata: correlation of imaging with histology. J Vasc Interv Radiol. 2012;23(6):786–794.e4. PMID: 22626269. doi: 10.1016/j.jvir.2012.02.015.
- Fruehauf JH, Back W, Eiermann A, et al. High-intensity focused ultrasound for the targeted destruction of uterine tissues: experiences from a pilot study using a mobile HIFU unit. Arch Gynecol Obstet. 2008;277(2):143–150. doi: 10.1007/s00404-007-0435-0.
- Viitala A, Gabriel M, Joronen K, et al. Histological findings in resected leiomyomas following MR-HIFU treatment, single-institution data from seven patients with unfavorable focal therapy. Int J Hyperthermia. 2023;40(1):2234666. doi: 10.1080/02656736.2023.2234666.
- Gencturk N, Cam I, Koksel Y, et al. Role of susceptibility-weighted imaging in detecting retinal hemorrhages in children with head trauma. Clin Neuroradiol. 2021;31(3):611–617. doi: 10.1007/s00062-020-00939-6.
- Hsu CC, Sethi SK, Haacke EM. The current state of susceptibility-weighted imaging and quantitative susceptibility mapping in head trauma. Neuroimaging Clin N Am. 2023;33(2):343–356. doi: 10.1016/j.nic.2023.01.009.
- Takeuchi M, Matsuzaki K, Bando Y, et al. Evaluation of red degeneration of uterine leiomyoma with susceptibility-weighted mr imaging. Magn Reson Med Sci. 2019;18(2):158–162. doi: 10.2463/mrms.mp.2018-0074.
- Cimsit B, Yoldemir T, Guclu M, et al. Susceptibility-weighted magnetic resonance imaging for the evaluation of deep infiltrating endometriosis: preliminary results. Acta Radiol. 2016;57(7):878–885. doi: 10.1177/0284185115602147.
- Yamahana X, Katsumori T, Miura H, et al. Susceptibility weighted MRI after uterine artery embolization for leiomyoma. Magn Reson Imaging. 2019;58(1):32–37. doi: 10.1016/j.mri.2019.01.013.
- Liao C, Xiao Z, Lv F, et al. Non-contrast enhanced MRI for assessment of uterine fibroids’ early response to ultrasound-guided high-intensity focused ultrasound thermal ablation. Eur J Radiol. 2020;122:108670. doi: 10.1016/j.ejrad.2019.108670.
- Pilatou MC, Stewart EA, Maier SE, et al. MRI-based thermal dosimetry and diffusion-weighted imaging of MRI-guided focused ultrasound thermal ablation of uterine fibroids. J Magn Reson Imaging. 2009;29(2):404–411. doi: 10.1002/jmri.21688.
- Liu J, Wei J, Keserci B, et al. T2*-weighted imaging in the assessment of the non-perfused volume of uterine fibroids following magnetic resonance-guided high-intensity focused ultrasound ablation. Int J Gynaecol Obstet. 2016;132(1):100–102. doi: 10.1016/j.ijgo.2015.07.005.
- Zhang Q, Chen Y, Lai M, et al. Magnetic resonance imaging-guided focused ultrasound surgery in a swine adenomyosis model. Acad Radiol. 2023;30 Suppl 2: S220–S226. (doi: 10.1016/j.acra.2022.11.034.
- Felker WR, Dregely I, Chung DJ, et al. Irreversible electroporation: defining the MRI appearance of the ablation zone with histopathologic correlation in a porcine liver model. AJR Am J Roentgenol. 2017;208(5):1141–1146. doi: 10.2214/AJR.16.17207.