
 ?Mathematical formulae have been encoded as MathML and are displayed in this HTML version using MathJax in order to improve their display. Uncheck the box to turn MathJax off. This feature requires Javascript. Click on a formula to zoom.
ABSTRACT
For analyzing incidence data on diabetes and health problems, the bivariate geometric probability distribution is a natural choice but remained unexplored largely due to lack of models linking covariates with the probabilities of bivariate incidence of correlated outcomes. In this paper, bivariate geometric models are proposed for two correlated incidence outcomes. The extended generalized linear models are developed to take into account covariate dependence of the bivariate probabilities of correlated incidence outcomes for diabetes and heart diseases for the elderly population. The estimation and test procedures are illustrated using the Health and Retirement Study data. Two models are shown in this paper, one based on conditional-marginal approach and the other one based on the joint probability distribution with an association parameter. The joint model with association parameter appears to be a very good choice for analyzing the covariate dependence of the joint incidence of diabetes and heart diseases. Bootstrapping is performed to measure the accuracy of estimates and the results indicate very small bias.
1. Introduction
In health data, often there are occurrences of two correlated outcomes for the first time or incidence of two symptoms, diseases or conditions. The repeated measures data on the outcomes at different times observed longitudinally provide us with the scope for modeling correlated outcomes as functions of potential risk factors. There is association between incidence of diabetes and heart diseases. However, we are yet to know the relationship between the incidence of diabetes mellitus and heart diseases fully. It is known that there is an increased risk of diabetes mellitus among the elderly people. Manson et al. [Citation18] examined the relationship between diabetes mellitus and incidence of heart diseases (coronary heart disease, stroke, total cardiovascular diseases) using a cohort study data for women 30–55 years of age. They found the association between diabetes and increased risk of nonfatal myocardial infarction and fatal coronary heart disease. Similarly, according to Haffner et al. [Citation13] the non-insulin dependent type 2 diabetes is associated with a marked increase in the risk of coronary heart disease. There is a very important issue of concern (debate) regarding whether the delayed onset of fatal and nonfatal coronary heart disease in women as compared to that of the men is offset (eradicated) attributable to the reduced risk as a result of estrogen therapy in postmenopausal period among the diabetic women [Citation5–7]. Another possible link can be examined between the obesity, insulin resistance, and heart disease. Caballero [Citation9] observed that there is no fully established cause–effect relationship but we can come closer to more conclusive evidence if combined together. In other words, still there is ambiguity in understanding the underlying mechanism properly. One of the reasons for the lack of understanding in such relationships is the dependence in outcomes as well as the dependence between risk factors and outcomes in the presence of dependence in outcomes. In most of the models, these diseases are not considered as joint outcomes with dependence and hence the relationships under such dependence between risk factors and outcomes cannot be assessed properly.
In the Health and Retirement Study [Citation23], there are questions regarding occurrence of diabetes and heart problem during successive follow-ups or waves. These outcome variables are expected to be correlated. At this backdrop, the joint model for incidence of diabetes and heart problem considering the association between the outcome variables as well as the relationship between risk factors and outcome variables are of great interest to epidemiologists and biostatisticians as well as to the medical professionals in general. The analysis based on the dependence between diabetes and heart disease at the time of incidence (first occurrence) for each along with their dependence on potential risk factors may reveal the nature of realistic underlying relationships which may not be found from analysis based on univariate models for incidence of diabetes and heart problem separately. The conditional models alone cannot provide any realistic explanation to these relationships in true sense due to complexity associated between two outcome variables.
Dependence in outcome variables may arise in various fields such as epidemiology, time series, environment, public health, economics, and anthropology. In longitudinal studies, we deal with outcomes from more than one time point on each subject under study. If the observations are recorded on the same subjects at different times or observations recorded at the same time by different persons then there may be dependence in the outcome variables. We can use marginal, conditional and joint models to address the dependence in outcomes with covariate dependence. In this context, the occurrence of two events for the same individuals for the first time is of interest in many situations. As the dependence in two outcomes results in a bivariate geometric distribution, an attempt is made to propose a generalized linear model based on bivariate geometric distribution. A bivariate Bernoulli generalized linear model has been proposed by Islam et al. [Citation15]. It is known that the geometric distribution is a discrete counterpart of the exponential distribution. In many instances, this can be applied to survival or reliability analysis for discrete time analysis for follow up or panel data where time to event data are not available but occurrence or non-occurrence of events are reported at different times. Examples of the application of reliability and survival analysis concepts in discrete time are discussed in [Citation12,Citation20,Citation27]. Nair and Nair [Citation21] provided a form of the bivariate geometric distribution which is employed in this paper. Other forms can be seen in [Citation2,Citation14,Citation22,Citation25]. Analogous to bivariate exponential model by Marshal and Olkin [Citation19], Basu and Dhar [Citation8] proposed a bivariate geometric model. Characterization results are shown by Sun and Basu [Citation26] and Sreehari [Citation24] and Sreehari and Vasudeva [Citation25]. Recently characterizations of bivariate geometric distributions were also shown by Jayakumar and Mundassery [Citation16] and Li and Dhar [Citation17]. An application of bivariate lifetime geometric distribution in the presence of cure fraction was studied by Davarzani et al. [Citation10]. Arnold [Citation1] and Arnold and Strauss [Citation3,Citation4] proposed bivariate distributions with exponential conditionals rather than using the joint distributions directly in order to make the modeling easier. In this paper, we have proposed two generalized linear models, for bivariate geometric and the link functions are identified. The first model is based on the marginal and conditional distributions to obtain joint distribution [Citation22,Citation25]. The second model is based on a joint distribution form of bivariate geometric proposed by Nair and Nair [Citation21]. It is noteworthy that there have been no attempts so far to develop generalized linear models based on the bivariate geometric forms. In this paper, the link functions are obtained by extending the generalized linear model for the bivariate geometric model using the bivariate exponential form. Similar extended approach with theoretical justification was illustrated for the generalized bivariate Bernoulli model by Islam et al. [Citation15]. The proposed work may initiate extensive potential application of the bivariate geometric models.
2. Univariate geometric distribution
Let us consider a geometric distribution of the form
(1)
(1) and the moment-generating function is given by
The expected value and variance are
3. Bivariate geometric distribution: marginal and conditional models
The marginal or conditional distributions alone may not be sufficient to obtain the joint distribution. However, the knowledge about the marginal and conditional distributions can provide helpful strategy in determining the joint distribution. For the bivariate geometric distribution, we can employ the joint distribution based on marginal and conditional distributions introduced by Phatak and Sreehari [Citation22] and Sreehari and Vasudeva [Citation25] as follows:
(2)
(2)
(2)
(2)
Let us denote this as Model 1. The marginal and conditional distributions are
(3)
(3)
(4)
(4) The likelihood function for the marginal model in Equation (Equation3
(2)
(2) ) is as follows:
(5)
(5) The log likelihood for the marginal model is
(6)
(6)
The exponential form for Model 1 is
(7)
(7) which can be expressed as
(8)
(8) where the natural parameters are
and
. The link functions can be expressed as follows:
where
.
Model 1 as shown in Equation (Equation7(7)
(7) ) provides link functions for the outcomes but it does not contain any parameter pertaining to the association between the dependent outcomes.
The log likelihood function using Equation (Equation8(8)
(8) ) is
(9)
(9)
For parameter estimation, we used estimating equations and information matrix. The estimating equations are
(10a)
(10a)
(10b)
(10b)
The second derivatives are
(11a)
(11a)
(11b)
(11b)
(11c)
(11c)
(11d)
(11d)
The estimates of the standard errors are obtained from the observed information based on the second derivatives as shown above. An application of the models is illustrated in Section 5.
We can use the likelihood ratio tests for against the alternative
for the significance of the full model where
. Let us denote
for the parameters in the full model and
for the parameters in the null model then the test statistic is
(12)
(12)
4. Bivariate geometric distribution: joint model
In Section 3, a bivariate model is proposed on the basis of marginal and conditional distributions to specify the joint distribution. Although the proposed model in Section 3 provides the estimates of the parameters of the linear models, the association between outcome variables cannot be estimated for this model. Hence, a joint distribution for correlated geometric outcomes [Citation21] is employed in this section which includes an association parameter. The bivariate geometric distribution of and
can be expressed as
(13)
(13) where
.
The marginal expectations for bivariate geometric distribution of
Let
then
From the condition
we have
We can express the bivariate geometric in Equation (Equation13(13)
(13) ) in terms of exponential family as
(14)
(14) where
,
,
, and
Here, and
are natural link functions and θ is the association parameter of outcome variables
and
which is a function of natural link functions,
and
. This is Model 2.
The log likelihood function using Equation (Equation14(14)
(14) ) is
(15)
(15) where
.
Then the estimating equations for Model 2 are
(16a)
(16a)
(16b)
(16b)
(16c)
(16c)
(16d)
(16d)
Similarly, we can obtain
Similar as the likelihood ratio test as shown in Equation (Equation12(12)
(12) ), we can test for
against the alternative
for significance of the full model where
. Let us denote
for the parameters in the full model and
for the parameters in the null model then the test statistic is
(17)
(17)
5. Applications
In this paper, the panel data from the Health and Retirement Study (HRS), sponsored by the National Institute of Aging (grant number NIA U01AG09740), conducted by the University of Michigan [Citation23] is used. A total of 11 waves of the RAND version of the data from 1992 to 2012, two consecutive waves are conducted two years apart, is considered for this application. In wave one, a total of 12,762 subjects were included in the HRS cohort. Out of all these subjects, 598 cases were identified (3 cases were considered as missing) with the incidence of diabetes first followed by incidence of heart problems at a later wave. The outcome variables considered are: reported diabetes based on the diagnosis by doctor in the current or any prior wave () and reported heart problem in the current or any prior wave (
) followed by the incidence of diabetes in any wave. To make sure of the incidence cases, we have started from the respondents who did not report conditions of diabetes and heart problems in wave 1 to exclude all the prevalent cases of diabetes and heart problems in the beginning of the study. Then the cases of incidence are identified when the reporting of diabetes is found in any of the subsequent waves for the first time. Similarly, we have identified the incidence cases of heart problems when it is reported first time followed by diabetes at a later wave. It may be noted here that the incidence cases of heart problems are considered here for only those who reported health problems as diagnosed by doctors after incidence of diabetes. The heart problems include conditions such as heart attack, coronary heart disease, angina, congestive heart failure, or other heart problems. The explanatory variables considered are: age (in years), BMI (Body Mass Index), whether drink (
,
) and sex (
,
). BMI is calculated as weight divided by the square of height where weight is converted to kilograms and height to meters. The variable drinks indicate whether the respondent drinks alcoholic beverages. After removal of cases with missing covariate values, the number of subjects is 598 who had reported diabetes in any wave followed by reported heart problems. Table displays the bivariate frequency distribution of incidence of diabetes and heart problem for different waves.
Table 1. Bivariate frequency distribution of incidence of Diabetes and Heart Diseases from the HRS Data, Waves 1–10.
In Tables –, we have shown estimates from marginal, conditional-marginal, and joint models. We have considered two models, one with the interaction term between age and sex and another without the interaction term. We have considered additional models with interaction term for age and sex to examine the role of age for females in explaining the time of incidence of diabetes and subsequently its influence in explaining the time of incidence of heart problems. We have used the time of incidence to represent the follow-up or wave number as a discrete-time variable. In the univariate geometric models, presented in Table , we observe that age is associated positively with both times (follow-up number represents time here) of incidence of diabetes and heart problem (p=0.000 ). The joint model based on the marginal and conditional probabilities, illustrated in Section 3, is used to estimate the parameters of the generalized linear model for the bivariate geometric model which are presented in Table . In this case, the marginal model is fitted for diabetes incidence and conditional model for reported heart problem for given reported diabetes. The result for the reported diabetes and heart disease appears to be similar to that of the marginal models as displayed in Table for age. As we have mentioned earlier that the model shown in Section 3 does not provide any estimate for the measure of association, we can use the alternative model, shown in Section 4, for joint distribution of reported diabetes and heart problems which includes an association parameter, θ. The estimated association parameter shows a positive association between the times of incidence of diabetes and heart problems (p<0.001 ). We now observe a marked variation in the estimates for both diabetes and heart problems. The variables age, BMI and sex appear to have positive association while drinks and interaction between age and sex display statistically significant negative association for incidence of diabetes. In other words, the risk of diabetes for the males increases at higher ages as compared to that of the females in this new joint model unlike all the previous models presented in Tables and . However, the males, compared to the females, show a significant negative association between age and time of incidence of diabetes indicating an increase in the risk for females at higher ages although still the males have a relatively higher overall risk.
Table 2. Estimates of the parameters of the univariate geometric models with or without interaction terms.
Table 3. Estimates of the parameters of the bivariate geometric based on conditional-marginal models with or without interaction terms.
Table 4. Estimates of the parameters of the bivariate geometric models with association parameter with or without interaction terms.
For heart diseases, the results are similar except for the risk factor sex and the interaction between age and sex. The females appear to have higher incidence of heart diseases at a later time compared to males while there is positive association of the age and sex interaction term indicating increased incidence of heart diseases among the males compared to females as they become older. In this case, the overall risk remains higher for females, compared to males. These results reveal that the incidence of diabetes is increased at older ages but is increased for heart disease among the males compared to the females although these effects are offset to some extent due to reversal in the interaction term in both the cases.
These findings provide new insights to explain some of the ongoing debates in the relationship between incidence of diabetes and heart problem in relation to age, BMI and sex as we have indicated in the introduction. The positive association of age with the incidence of diabetes is well established and this is confirmed by the estimates obtained from the joint model as shown in Table . It is observed that an increase in incidence occurs with aging. Similar roles of age and BMI are also found for incidence of heart problem, although BMI does not show statistically significant relationship in the model with interaction between age and sex.
Table summarizes the log likelihood and AIC for the conditional-marginal and joint models with the association parameter with or without interaction terms. In both the cases, the joint models with association parameter appear to be better in terms of goodness of fit. A comparison between the joint models with association parameter, the model with interaction term shows the best fit to the dependent outcomes for incidence of diabetes and heart diseases.
Table 5. Log Likelihood and AIC for bivariate geometric models with or without interaction terms.
6. Bootstrapping
To measure the accuracy of sample estimates, bootstrapping is used. We performed 10,000 bootstraps and computed bias, standard error, and mean-squared error for estimates. Estimates from Tables and are considered as population parameters while bias, standard error and mean-squared error are computed. Bias is very small generally (less than 1%) for the estimators of parameters of bivariate geometric model based on conditional marginal distributions. Standard error and mean-squared errors are also found to be very small. For the model based on the marginal/conditional approach, convergence is achieved for all 10,000 bootstrap samples. Results are presented in Table . Density plots for all bootstrap estimates for Model 1 are shown in Figures and .
Figure 1. Density plot of bootstrap estimates of model without interaction for Model 1.
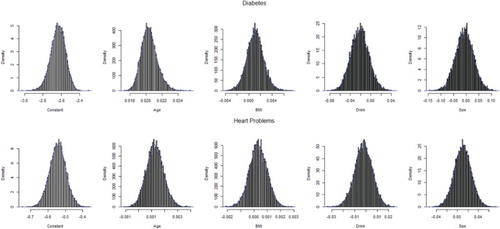
Figure 2. Density plot of bootstrap estimates for the model with interaction for Model 1.
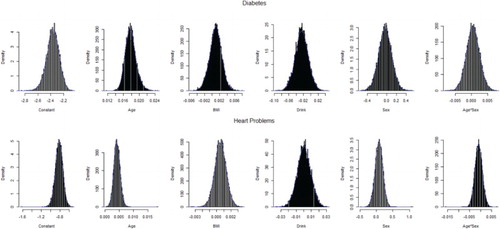
Table 6. Bootstrap results from the bivariate geometric model based on conditional–marginal models with or without interaction terms.
Bootstrap results for the joint model with association parameter are presented in Table . For the model without interaction, 483 bootstrap samples did not converge. On the other hand, for the model with an interaction term, convergence is not achieved in case of 1839 samples. Convergence problem arises because of very few or no cell frequencies in case of bootstrap samples. Density plots for all bootstrap estimates for Model 2 are shown in Figures –. Bias for the full model without interaction appears to be very small for Model 2, however, it is higher for some estimators in the full model with interaction term.
Figure 3. Density plot of bootstrap estimates for the model without interaction for Model 2.
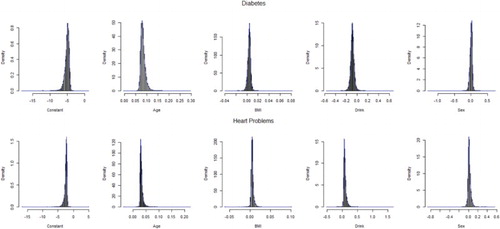
Figure 4. Density plot of bootstrap estimates for the model with interaction for Model 2.
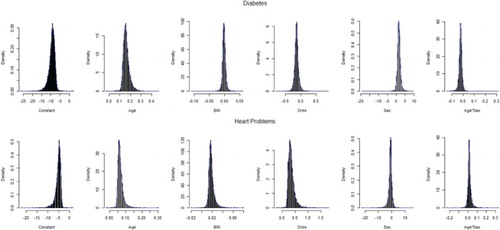
Figure 5. Density plot of bootstrap estimates for θ for Model 2.
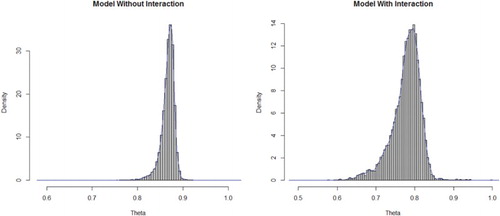
Table 7. Bootstrap results from the bivariate geometric model with association parameter with or without interaction terms.
7. Conclusions
In reliability or survival analysis, modeling of incidence data is a challenging issue of concern. In this paper, two bivariate models are proposed where correlated outcomes are of interest. As the geometric distribution is a natural choice for analyzing the incidence data, which has not been explored for correlated outcomes in the past, the proposed models may provide insights to the researchers and potential users with models which can be applied to the practical life situations very extensively. In addition, the estimation of parameters of the proposed models are based on generalized linear models and thus the procedure becomes easier to the potential users. Two bivariate generalized linear models are proposed in this paper for bivariate geometric distribution where two correlated geometric outcomes are considered and the corresponding link functions are shown for mean as function of covariates. An association parameter is also introduced in the bivariate generalized linear model based on a joint model which is a function of link functions for both the outcomes. An alternative model is also demonstrated using conditional and marginal distributions. However, this model does not provide any estimate of the measure of association between the outcome variables which is a major limitation, although there is no difficulty with estimation of the bivariate model for parameters for dependent outcomes. The proposed model has practical applications in survival and reliability analysis where correlated geometric outcomes are of interest.
We have applied the proposed models for analyzing the dependence in outcomes diabetes and heart disease. An effort is made to examine the effect of the explanatory variables age, BMI, drinking habit, and sex. Findings of this study provide new insights to explain some of the ongoing debates in the relationship between incidence of diabetes and heart problem in relation to age, BMI, and sex. The positive association of age with the incidence of diabetes is well established and this is confirmed by the estimates obtained from the joint model. An increased incidence of diabetes is observed with aging. Similar results are also found for age and BMI for incidence of heart problem. From our findings based on the data from only elderly population, we observe that although there is positive association between incidence of diabetes and sex, indicating higher incidence among elderly males, the age and sex interaction shows negative association. This is indicative of the fact that females start to have higher risk of diabetes compared to males with aging. It is noted by Gale and Gillespie [Citation11] that men seem more susceptible than women to the consequences of indolence and obesity, possibly due to differences in insulin sensitivity and regional fat deposition. Among the elderly, the higher risk among males starts to offset over time for incidence of diabetes among those who end up with incidence of heart disease later. In case of heart disease for those who are already suffering from diabetes, the results are opposite. Females have higher risk of heart disease among the elderly subjects of this study which might be due to menopausal effect when the risk for heart disease increases for females. However, there is a reversal in the association between sex and time of incidence of the two diseases. From these results based on the dependence model, we can conclude that there might be delayed onset of fatal and nonfatal heart diseases in women as compared to the men [Citation5–7] and may not necessarily be eradicated and women may still experience a higher risk of heart problem in general in the presence of diabetes mellitus. Based on the log likelihood and AIC for the conditional–marginal and joint models with the association parameter, with or without interaction, the joint models with association parameter appears to be better.
Acknowledgments
We acknowledge gratefully that the study is supported by the HEQEP subproject 3293 of the University Grants Commission of Bangladesh and the World Bank. The authors acknowledge gratefully to the HRS (Health and Retirement Study) which is sponsored by the National Institute of Aging (grant number NIA U01AG09740) and conducted by the University of Michigan for the data.
Disclosure statement
No potential conflict of interest was reported by the authors.
Additional information
Funding
References
- B.C. Arnold, Conditionally specified distributions: Lecture notes monograph series, In Topics in Statistical Dependence, H.W. Block, A.R. Sampson, and T.H. Savits, eds., Institute of Mathematical Statistics, Hayward, CA, 1990, pp. 13–18.
- B.C. Arnold, E. Castillo, and J. Serbia, Conditionally Specified Distributions, Springer, New York, 1992.
- B.C. Arnold and D.J. Strauss, Bivariate Distributions with Exponential Conditionals, JASA 83 (1988), pp. 522–527. doi: 10.1080/01621459.1988.10478627
- B.C. Arnold and D.J. Strauss, Bivariate distributions with conditionals in prescribed exponential families, JRSS B 53 (1991), pp. 365–375.
- E.L. Barrett-Connor, Diabetes and heart disease, Diabetes Care 26 (2003), pp. 2947–2958. doi: 10.2337/diacare.26.10.2947
- E.L. Barrett-Connor, B.A. Cohn, D.L. Wingard, and S.L. Edelstein, Why is diabetes mellitus a stronger risk factor for fatal ischemic heart disease in women than in men? The Rancho Bernardo Study, JAMA 265 (1991), pp. 627–631. doi: 10.1001/jama.1991.03460050081025
- E.L. Barrett-Connor and D. Grady, Hormone replacement therapy, heart disease, and other considerations, Annu. Rev. Public Health 19 (1998), pp. 55–72. doi: 10.1146/annurev.publhealth.19.1.55
- A.P. Basu and S.K. Dhar, Bivariate geometric distribution, JASS 2 (1995), pp. 33–44.
- A.E. Caballero, Endothelial dysfunction in obesity and insulin resistance: A road to diabetes and heart disease, Obes Res. 11 (2003), pp. 1278–1289. doi: 10.1038/oby.2003.174
- N. Davarzani, J.A. Achcar, E.N. Smirnov, and R. Peeters, Bivariate lifetime geometric distribution in presence of cure fraction, J. Data Sci. 13 (2015), pp. 755–770.
- E.A. Gale and K.M. Gillespie, Diabetes and Gender, Diabetologia 44 (2001), pp. 3–15. doi: 10.1007/s001250051573
- P.L. Gupta, Some characterizations of distributions by truncated events, Statistics 16 (1985), pp. 465–473. doi: 10.1080/02331888508801876
- S.M. Haffner, M.P. Stern, H.P. Hazuda, B.D. Mitchell, and K.K. Patterson, Cardiovascular risk factors in confirmed prediabetic individuals: Does the clock for coronary heart disease start ticking before the onset of clinical diabetes? JAMA 263 (1990), pp. 2893–2898. doi: 10.1001/jama.1990.03440210043030
- A.G. Hawkes, On characterizing the bivariate exponential and geometric distributions, JRSS B 34 (1972), pp. 129–131.
- M.A. Islam, A. Alzaid, R.I. Chowdhury, and K.S. Sultan, A generalized bivariate bernoulli model with covariate dependence, J. Appl. Stat. 40 (2013), pp. 1064–1075. doi: 10.1080/02664763.2013.780156
- K. Jayakumar and D.A. Mundassery, On bivariate geometric distribution, Statistica 67 (2007), pp. 389–404.
- J. Li and S. Dhar, Modeling with bivariate geometric distributions, Commun. Stat – Theory Methods 42 (2013), pp. 252–266. doi: 10.1080/03610926.2011.579704
- J.E. Manson, G.A. Colditz, M.J. Stampfer, W.C. Willett, S. Andrzej, A.S. Krolewski, B. Rosner, R.A. Arky, F.E. Speizer, and C.H. Hennekens, A prospective study of maturity-onset diabetes mellitus and risk of coronary heart disease and stroke in women, Arch. Int. Med. 151 (1991), pp. 1141–1147. doi: 10.1001/archinte.1991.00400060077013
- A.W. Marshal and I.A. Olkin, A multivariate exponential distribution, JASA 62 (1967), pp. 30–44. doi: 10.1080/01621459.1967.10482885
- K.R.M. Nair, Some characterization problems associated with the bivariate exponential and geometric distributions, Ph.D. thesis submitted to the Cochin University of Science and Technology, 1990.
- K.R.M. Nair and N.U. Nair, On characterizing the bivariate exponential and geometric distributions, AISM 40 (1988), pp. 267–271. doi: 10.1007/BF00052343
- A.G. Phatak and M. Sreehari, Some characterizations of a bivariate geometric distributions, J. Indian Stat. Assoc. 19 (1981), pp. 141–146.
- Public Use Dataset, Health and Retirement Study, University of Michigan, Ann Arbor, 1992–2012.
- G. Sreehari, Characterizations via conditional distributions, J. Indian Stat. Assoc. 43 (2005), pp. 77–93.
- M. Sreehari and R. Vasudeva, Characterizations of multivariate geometric distributions in terms of conditional distributions, Metrika 75 (2012), pp. 271–286. doi: 10.1007/s00184-010-0326-4
- K. Sun and A.P. Basu, A characterization of a bivariate geometric distribution, Stat. Probab. Lett. 23 (1995), pp. 307–311. doi: 10.1016/0167-7152(94)00129-V
- E. Xekalaki, Hazard functions and life distribution in discrete time, Commun. Stat, Theory Methods 12 (1983), pp. 2503–2509. doi: 10.1080/03610928308828617