
 ?Mathematical formulae have been encoded as MathML and are displayed in this HTML version using MathJax in order to improve their display. Uncheck the box to turn MathJax off. This feature requires Javascript. Click on a formula to zoom.
Abstract
Although there have been a number of available tests of bivariate exchangeability, i.e. bivariate symmetry for bivariate distributions, the literature is void of tests whether a multivariate distribution with more than two dimensions is exchangeable or not. In this paper, multivariate permutation tests of exchangeability of multivariate distributions are proposed, which are based on the non-parametric combination methodology, i.e. on combining non-parametric bivariate exchangeability tests. Numerical experiments on real as well as simulated multivariate data with more than two dimensions are presented here. The multivariate permutation test turns out to be typically more powerful than a bivariate exchangeability test performed only over a single pair of variables, and also more suitable compared to tests exploiting the approaches of Benjamini–Yekutieli or Bonferroni.
1. Introduction
Let us consider a random vector . Let
with a fixed n represent p-dimensional random vectors following the probability distribution
. The distribution
is called exchangeable (interchangeable, permutable) if it holds
(1)
(1)
for all permutation matrices P, i.e. for all square matrices P of size
with values 0 or 1 such that each row and each column contains the value 1 exactly once. In other words, (Equation1
(1)
(1) ) means that indexing of variables of
is irrelevant and
is permutation invariant. This work is interested in testing exchangeability of
based on given data, i.e. testing the null hypothesis
that (Equation1
(1)
(1) ) holds against the general alternative hypothesis
stating that
does not hold.
Attention has been paid to exchangeable distributions mainly for the bivariate case (p = 2). For a bivariate random vector , exchangeability (Equation1
(1)
(1) ) is equivalent to
(2)
(2)
Bivariate exchangeability often denoted as bivariate symmetry can be interpreted as symmetry with respect to permutation of axes or symmetry along the axis of the first quadrant (i.e. line
). We note that (Equation2
(2)
(2) ) in the bivariate case naturally implies
(3)
(3)
Already the first bivariate symmetry tests in the 1970s [Citation18,Citation45] were motivated by a practical question of whether a medical treatment has an effect or not. There have been a number of available bivariate symmetry tests, which are suitable for paired data allowing for a (possibly high) correlation of the two variables within pairs. Still, we are not aware of any test for distributions with more than two dimensions, although these could represent very natural extensions of tests for the bivariate case. Only in the context of copulas, a test of exchangeability of copulas based on empirical processes was proposed in [Citation14] for an arbitrary dimension. To give a motivation example for distributions with
, the income of five nutrients (calcium, iron, protein, vitamin A, vitamin D) on a sample of women was investigated in [Citation11], where a test of exchangeability of the multivariate distribution of the 5 variables would be useful. Another example may be a study of the effect of a treatment (e.g. of the COVID-19 vaccine) applied in three sequential doses.
Testing exchangeability of multivariate distributions may also be motivated within a broader context of tests of various forms of symmetry of multivariate continuous distributions. It was recently suggested to replace testing the exchangeability of a distribution by testing axial symmetry, e.g. using the test based on (multivariate) directional quantiles of [Citation19]; it namely holds that if a multivariate distribution is exchangeable after a shift, then it is symmetric around the axis of the first orthant. Another connection mentioned in [Citation20] is related to p independent univariate distributions, which are assumed to be the same up to their location; their joint distribution (after a shift) has to be exchangeable. Thus, the test whether their distributions are the same (up to a shift) may be performed as a test of exchangeability of the joint distribution (again up to a shift). Other useful relationships between exchangeability of a distribution and some symmetry concepts (defined in [Citation33,Citation39]) were also described in [Citation19,Citation20].
It is important to stress that this paper is interested in permuting the variables of a multivariate distribution but not in permuting observations. The latter is connected to the concept of an exchangeable sequence of random variables (or arrays; see Section 7 of [Citation25]), which is defined as a sequence invariant to permuting the observations, in other words, as a sequence with an exchangeable distribution [Citation7]. Exchangeability of a sequence represents a weaker property compared to independence of the coordinates and the theory of finite exchangeable random vectors stems from de Finetti's theorem as overviewed in [Citation21]. Exchangeability of a sequence of random variables have found applications within conformal inference, which can be characterized as a method for constructing valid prediction errors for new sequentially added observations; conformal inference has become popular for neural networks or random forests [Citation26].
Section 2 recalls available tests of bivariate symmetry. In the methodological Section 3, multivariate permutation tests of exchangeability of distributions with more than two dimensions are proposed. The performance of the tests is investigated on real data in Section 4 and on simulated data in Section 5. Multivariate permutation tests turn out to outperform tests constructed from multiple comparison procedures of Benjamini–Yekutieli or Bonferroni. Section 6 brings conclusions.
2. Available bivariate symmetry tests
We now consider i.i.d. bivariate random vectors . Particular available tests of the null hypothesis of bivariate symmetry are overviewed in this section. Testing the exchangeability of distribution is desirable, especially if it can be performed in a non-parametric, distribution-free, coordinate-free way by means of simple and powerful tests not relying on strong assumptions. Bivariate symmetry tests can typically be performed as exact (permutation) tests; advantages of permutation tests in the context of bivariate symmetry were recalled in [Citation3] or [Citation10] and for the context of various other symmetry hypotheses in [Citation35]. We stress that all tests mentioned in this paper are performed on raw data without any normalization.
Bell and Haller [Citation3] overviewed several equivalent formulations of bivariate symmetry. They derived the likelihood ratio test for normal data in the form
(4)
The test of Hollander [Citation18] is based on empirical distribution functions
Yanagimito and Sibuya [Citation45] proposed and investigated rank tests of bivariate symmetry based on the maximal invariant statistic. Let us now use the notation
Snijders [Citation41] also considered rank tests (Equation5
Ernst and Schucany [Citation10] focused on testing the null hypothesis formulated as (Equation3
Modarres [Citation32] proposed five tests of bivariate symmetry. The first three are obtained as two-sample tests of equality of distribution functions based on Euclidean interpoint distances; they compare the distribution of the raw data with that of the data reflected along the line
Runs test (based on evaluating a minimum spanning tree).
Nearest neighbor test (application of the test of Henze [Citation15] to bivariate symmetry).
Rank test of equality of multivariate distribution functions (application of the test of Maa et al. [Citation28] to bivariate symmetry).
Sign test (based on diving the observations to 6 regions, performed as a standard test about the probability of a binomial distribution).
Bootstrap test based on
Concerning the rank test, Modarres [Citation32] described it to reject bivariate symmetry for large values of the test statistic M; however, we can immediately think of a simplistic example, in which the test statistic decreases as we deviate from
Rao and Raghunath [Citation37] developed a non-parametric test for a more general situation of symmetry about a line (possibly different from the line
A bivariate symmetry test for competing risks in survival analysis was proposed in [Citation9] and its saddle point approximation was derived in [Citation1].
3. Tests of exchangeability of multivariate distributions
Because there seems to be no direct way for obtaining exchangeability tests for distributions with more than two dimensions, we propose to construct such tests by combining (dependent) permutation tests of bivariate symmetry applied to individual pairs of variables. The proposed non-parametric combination methodology is presented in Section 3.1. For comparison, tests constructed from multiple comparisons procedures of Benjamini–Yekutieli or Bonferroni are also considered; these are described in Section 3.2. This paper concentrated on data coming from continuous distributions. For categorical data, which can be represented in square contingency tables, exchangeability of the distribution is known as complete symmetry and we refer to Section 10.7 of [Citation2] for its treatment.
Using the notation of Section 1, (Equation1
(1)
(1) ) is replaced by a different null hypothesis
(7)
(7)
formulated for the total number
of all pairs of variables. We thus consider testing the composite null hypothesis
, which may be expressed as
(8)
(8)
against
(9)
(9)
However, because testing (Equation7
(7)
(7) ) is not equivalent to testing the null hypothesis (Equation1
(1)
(1) ), it may happen that exchangeability (Equation1
(1)
(1) ) fails to be true while pairwise exchangeability is fulfilled for each individual pair.
3.1. Multivariate permutation test
As bivariate symmetry tests are often performed as permutation tests [Citation35], it is the most natural approach to exploit the non-parametric combination methodology using one of the approaches due to Fisher, Lipták or Tippett. In such approach, the dependence of the tests is implicitly taken into account by means of the permutation strategy (Section 1.2 of [Citation6]), irrespective of the dependence relations. The approach, which is free of assumptions about the distribution of the data, yields a global (combined) p-value and may be interpreted as a multivariate permutation test.
The implementation of the non-parametric combination methodology is straightforward following Algorithm 1 formulated for a general p, based on combining the total number of tests of bivariate symmetry for all pairs of variables. In (11),
is used instead of
(10)
(10)
where
denotes indicator function; the reason is a better ability of
to keep the probability of type I error in numerical experiments [Citation6].
In the experiments with multivariate data, we use tests obtained by combining these bivariate symmetry tests:
The test of Hollander [Citation18].
The likelihood ratio (LR) test of Bell and Haller [Citation3]; this is the only test which is rejected for a small value of the test statistic.
The rank test of Snijders [Citation41] with Wilcoxon scores.
The sign test of Modarres [Citation32].
The nearest neighbor (NN) test of Modarres [Citation32] based on interpoint distances.
The rank test of Modarres [Citation32] based on interpoint distances (say ID-rank test) with Wilcoxon scores; as explained in Section 2, we (unlike the original test) reject for very large or for very small values of the test statistic.
Algorithm 1 can be described as an adaptation of the general algorithm of [Citation6], using one of these combination functions as a special case:
Fisher (omnibus)
Lipták
Tippett
As discussed in Section 4.2.4 of [Citation34], Tippett's combination is recommendable if only one or a few (but not all) sub-alternatives are true, and that of Lipták [Citation27] performs well when all sub-alternatives are jointly true. Fisher's combination is the most popular in practice [Citation12]; it is considered intermediate between the two others and thus suitable when no prior expectation is available. Finding the optimal combining function for given data appears, however, impossible (Section 4.2.2 of [Citation34]).
Properties of the multivariate permutation tests of this section follow from the non-parametric combination methodology. Particularly, the constructed tests hold the probability of type I error and the distribution of the test statistics under does not depend on the underlying distribution of the data. This is true in spite of the individual p-values being dependent and the three choices of ψ used here to fulfil the assumptions of Section 1.2 of [Citation6]. If the individual (pairwise) tests are consistent, the multivariate permutation test is consistent. If the individual tests are unbiased, the multivariate permutation test is unbiased (Section 4.3 of [Citation8,Citation34]).
3.2. Testing exchangeability of a distribution based on multiple comparisons
For the sake of comparisons, we also consider exchangeability tests for distributions with dimensionality based on multiple comparisons. Although the methods of this section are not primarily designed for the task and are intended for post hoc comparisons (after a global test of a composite null hypothesis), we use them here for constructing a global test of
based on (corrected) p-values of pairwise tests of bivariate symmetry. We use here the notation
for p-values of the pairwise tests, which will be arranged in ascending order as
(13)
(13)
Benjamini–Yekutieli. The most popular multiple testing procedure keeping the false discovery rate (FDR), defined as the percentage of false positive tests (incorrectly rejecting the null hypothesis) among all significant tests, below the chosen level α is the approach of Benjamini and Hochberg (B-H) [Citation4] for independent tests. An extension of Benjamini and Yekutieli (B-Y) [Citation5] is suitable for (potentially) dependent statistics even if the structure of the dependence is not known. It is convenient to express the (global) test based on the B-Y procedure by means of the scheme
(14)
(14)
Some other procedures for testing high-dimensional data controling for FDR were presented in the overview [Citation23].
The Bonferroni method represents the simplest approach to multiple tests ensuring to keep the family-wise error rate (FWER), defined as the probability of at least one incorrect rejecting the null hypothesis (i.e. making at least one type I error) among all tests, under the specified level α. We now use it to construct the (very conservative) global test according to the scheme
(15)
(15)
4. Analysis of real datasets
We consider two real datasets to illustrate the performance of the tests of exchangeability of distributions with p = 3. All computations of this paper were performed in R software [Citation36] exploiting additional packages (NSM3, spdep, purrr, FNN, and BioConductor).
The first dataset contains gene expression (GE) measurements acquired in the study described in [Citation31]. Gene expressions for gene transcripts were measured on 24 individuals having a cerebrovascular stroke and 24 control persons. First, the Limma methodology (Linear Models for Microarray Data of [Citation40]) was applied to find the most differentially expressed genes. The data are used here only for the n = 24 patients and with p = 3 most important genes that contribute the most to the separation between the two groups of individuals.
We are interested in testing whether the joint distribution of the three considered genes is exchangeable. The results of permutation tests of bivariate symmetry applied to individual pairs of variables (1-2, 1-3, and 2-3, i.e. with D = 3 in the notation of Algorithm 1) for the GE dataset are presented in Table . The multivariate permutation tests based on test statistics of bivariate symmetry tests are presented there as well. Tests of bivariate symmetry for the second and third gene have smaller p-values compared to tests evaluated for other pairs of genes. For all the tests, the multivariate permutation tests yield the smallest p-values, if a suitable combination method is chosen; however, the best of the three combination methods in terms of power turns out to be different for different bivariate symmetry tests. Most commonly (although not always), the approach of Tippett yields the best results here.
Table 1. P-values of tests for the gene expressions (GE) dataset of Section 4 with p = 3 and n = 24.
The second dataset is a subset of the Australian athletes (AA) dataset with p = 3. This dataset available, e.g. in the R software package DAAG [Citation29] with the red blood cell count (), white blood cell count (
), and hemoglobin concentration (
) was analyzed, e.g. in [Citation16] or [Citation24]. Graphical visualizations reveal the variables to be very far from being permutable; thus, we further consider 1000 random subsamples from the dataset, where each contains only n = 20 measurements. If we consider all tests presented in Table for the GE dataset, the average p-values across the 1000 subsamples of the AA dataset are all highly significant and below 0.001. This also makes the global tests using Bonferroni correction and the B-Y procedure significant in all situations under consideration.
5. Simulations
The aim of the simulations is to compare the performance of the tests of exchangeability of a distribution proposed in Section 3 for testing the null hypothesis against
. The performance of permutation tests of bivariate symmetry applied to pairs of variables is investigated as well. The simulations are performed for data generated from four different models. In simulations A, B, C, and E, we randomly generate
samples and for each of them, the permutation tests (bivariate or multivariate) are always performed with 1000 permutations.
Simulation A. Using n = 20, we independently generate 3-dimensional data from normal distribution , where
denotes the unit matrix of size
. A selected percentage (ranging from 0 to
) of the observations is replaced by values, which are independently generated from
, where
. The results in the form of empirical rejection frequencies (rates) are presented in Table .Footnote1
Table 2. Simulation A: Empirical rejection frequencies (in ).
Simulation B. Using n = 30, we independently generate 3-dimensional data from multivariate distribution with scale matrix
. A selected percentage (ranging from 0 to
) of the observations is replaced by values, which are independently generated from non-central multivariate
distribution with scale matrix
and with non-centrality parameter (i.e. mode) equal to
. The results in the form of empirical rejection frequencies are presented in Table .
Table 3. Simulation B: Empirical rejection frequencies (in ).
Simulation C. Using n = 30, we independently generate 4-dimensional data from the multivariate logistic distribution [Citation30] with the vector of location parameters and the vector of scale parameters
. A selected percentage (ranging from 0 to
) of the observations is replaced by values, which are independently generated from multivariate logistic distribution with the vector of location parameters
and the vector of scale parameters
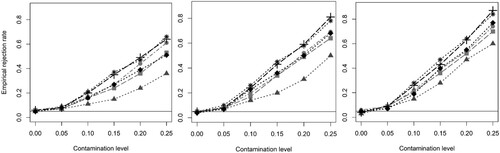
. The results in the form of averaged empirical rejection frequencies are visualized in Figure , where the horizontal lines correspond to
. The average rejection rates of bivariate symmetry tests applied to variables 1 and 3 are shown in Figure (left); testing for the pairs of variables 1-4, 2-3, and 2-4 yields analogous results due to the structure of the data. Average rejection rates of the multivariate permutation test using Tippett's method is shown in Figure (middle) and using Lipták's method in Figure (right).
Figure 1. Simulation C: empirical rejection rates for the permutation test of bivariate symmetry for variables 1 and 3 (left), and for the multivariate permutation test using the approach of Fisher (middle) and Tippett (right). The curves correspond to (1) Hollander (stars), (2) LR (circles), (3) rank test of Snijders (squares), (4) sign test (triangles), (5) NN test (diamonds), and (6) ID-rank test (plus signs).
Simulation D. Simulation D is aimed at comparing the methods for larger values of p. Using n = 20, we independently generate p-dimensional data from multivariate normal distribution , where
is considered for
with a given m. We use always 1000 permutations;
is used for p = 10, but only
is used for p = 100. The results are presented in Table .
Table 4. Simulation D: Empirical rejection frequencies (in ).
To discuss the results of all the simulations, the multivariate permutation tests hold the probability of type I error at the level. The power of all the tests increases together with increasing contamination of the datasets, i.e. increases as the data become more distant from
. To compare individual tests, the largest powers are obtained with Hollander's test and the ID-rank test (i.e. in the novel version as a two-sided ID-rank test as justified here in Section 2). It seems as the most interesting result that the computations confirm the powers of the multivariate permutation tests to outperform those of bivariate symmetry tests applied to an individual pair of variables. Concerning the non-parametric combination methodology, Tippett's approach yields the largest power and Fisher's is slightly weaker, leaving Lipták's approach behind.
The Benjamini–Yekutieli or Bonferroni approaches, which are primarily designed for post hoc comparisons, without any surprise reduce the type I errors and also attain lower powers. For p = 3, the global test based on the B-Y procedure compares with 0.009,
with 0.018, and
with 0.027, and the test based on the Bonferroni procedure has its probability of type I error equal to precisely 0.017. For a small deviation from
with p = 3, the powers of the B-Y or Bonferroni global tests turn out to be extremely low (much below those of the multivariate permutation tests), and rapidly increase with an increasing deviation from
. For a larger p, the probability of type I error of B-Y and Bonferroni drops even more, which is very apparent here for p = 100 with a corresponding D = 4950 pairs to be compared. Tippett's approach outperforms the B-Y or Bonferroni approaches in all considered situations under
for p = 10 as well as for p = 100.
Simulation E. In order to remind that the test procedures of Section 3.1 were formulated after replacing by
, we present one more simulation for data that violate
and retain close to
as much as possible. To approximate such situation, we start with the non-contaminated data from Simulation A. These are modified to decrease the density around points
,
,
, and
with m = 1.5 by finding always 3 closest observations to these points in terms of the Euclidean distance. These are replaced by data around points
,
,
, and
, which are generated as normally distributed with expectation given to these points and with covariance matrix
. The results in Table show the pairwise tests to have their powers very slightly above 0.05 being outperformed by multivariate permutation tests. The results of the latter remain nevertheless quite low for such a strong violation of
, so this specific design reveals the limitation of replacing
by
.
Table 5. Simulation E: Empirical rejection frequencies (in ).
6. Conclusions
While the literature seems void of exchangeability tests for distributions with , this paper investigates several possibilities for their construction based on combining bivariate symmetry tests performed over individual pairs of variables. We recommend to perform the multivariate tests as multivariate permutation tests obtained by the non-parametric combination methodology. The computations over the presented real as well as simulated multivariate data reveal the multiple testing procedures to be more powerful than a bivariate exchangeability test performed only over a single pair of variables.
Numerous available studies comparing the Bonferroni correction with B-H and/or B-Y approaches [Citation44] have most often not considered the non-parametric combination methodology. This is because the non-parametric combination methodology is a specific approach tailor-made for combining permutation tests. Multivariate permutations tests keep the probability of type I error under the specified level. This does not, however, hold for tests based on the approaches of B-H, B-Y or Bonferroni, which are all primarily designed for post hoc comparisons; these approaches turn out in the simulations of Section 5 to be unsuitable for testing a composite (global) null hypothesis. All the multivariate tests presented in this paper are computationally demanding for larger values of p, which is a natural property of all tests based on permutations. Let S denote the complexity of computing an individual test statistic and B the number of permutations (as in Algorithm 1). The computational complexity of the multivariate permutation test, which can be expressed as , is fully comparable to that of the approaches of B-Y or Bonferroni, which both have the complexity of DBS.
Finally, we can say that the multivariate tests of this paper consider p-values as significance probabilities, as it is typical in statistical practice, not reflecting that they are actually random variables. A perspective approach based on expected p-values (EPV) developed in [Citation38] and extended in [Citation42,Citation43] for the context of multiple testing seems, however, not to have been extended to the context of permutation tests (as EPV-based testing needs a specified null distribution of the test statistic and its known or estimated distribution under the alternative) and to the context with a composite alternative hypothesis.
Acknowledgments
The authors would like to thank Miroslav Šiman for the discussion. The authors received valuable input from the reviewers and an associate editor.
Disclosure statement
No potential conflict of interest was reported by the author(s).
Additional information
Funding
Notes
1 A confidence interval for a rejection frequency π based on its estimate obtained in simulations may be computed using the standard error
, if the lower bound is non-negative. When simulating
random samples, it approximately holds here that
for
and
for
or for
.
References
- E.F. Abd-Elfattah, Bivariate symmetry tests for complete and competing risks data: A saddle point approach, J. Stat. Comput. Simul. 87 (2017), pp. 1269–1275.
- A. Agresti, Categorical Data Analysis, 2nd ed., Wiley, Hoboken, 2002.
- C.B. Bell and H.S. Haller, Bivariate symmetry tests: parametric and nonparametric, Ann. Math. Stat. 40 (1969), pp. 259–269.
- Y. Benjamini and Y. Hochberg, Controlling the false discovery rate: A practical and powerful approach to multiple testing, J. R. Stat. Soc. Ser. B. 57 (1995), pp. 289–300.
- Y. Benjamini and D. Yekutieli, The control of the false discovery rate in multiple testing under dependency, Ann. Stat. 29 (2001), pp. 1165–1188.
- S. Bonnini, L. Corain, M. Marozzi, and L. Salmaso, Nonparametric Hypothesis Testing: Rank and Permutation Methods with Applications in R, Wiley, New York, 2014.
- D. Commenges, Transformations which preserve exchangeability and application to permutation tests, J. Nonparametr. Stat. 15 (2003), pp. 171–185.
- L. Corain and L. Salmaso, Nonparametric permutation and combination-based multivariate control charts with applications in microelectronics, Appl. Stoch. Models Bus. Ind. 29 (2013), pp. 334–349.
- J.V. Deshpande, A test for bivariate symmetry of dependent competing risks, Biom. J. 32 (2007), pp. 737–746.
- M.D. Ernst and W.R. Schucany, A class of permutation tests of bivariate interchangeability, J. Am. Stat. Assoc. 94 (1999), pp. 273–284.
- C. Genest, J. Nešlehová, and J.F. Quessy, Tests of symmetry for bivariate copulas, Ann. Inst. Stat. Math. 64 (2012), pp. 811–834.
- R.A. Giancristofaro and C. Brombin, Overview of nonparametric combination-based permutation tests for multivariate multi-sample problems, Statistica 74 (2014), pp. 233–246.
- J. Hájek, Z. Šidák, and P.K. Sen, Theory of Rank Tests, 2nd ed., Academic Press, San Diego, 1999.
- M. Harder and U. Stadtmüller, Testing exchangeability of copulas in arbitrary dimension, J. Nonparametr. Stat. 29 (2017), pp. 40–60.
- N. Henze, A multivariate two-sample test based on the number of nearest neighbor type coincidences, Ann. Stat. 16 (1988), pp. 772–783.
- N. Henze, Z. Hlávka, and S.G. Meintanis, Testing for spherical symmetry via the empirical characteristic function, Statistics 48 (2014), pp. 1282–1296.
- J.F. Hilton and L. Gee, The size and power of the exact bivariate symmetry test, Comput. Stat. Data Anal. 26 (1997), pp. 53–69.
- M. Hollander, A nonparametric test for bivariate symmetry, Biometrika 58 (1971), pp. 203–212.
- Š. Hudecová and M. Šiman, Testing axial symmetry by means of directional regression quantiles, Electron. J. Stat. 15 (2021), pp. 2690–2715.
- Š. Hudecová and M. Šiman, Testing symmetry around a subspace, Stat. Pap. 62 (2021), pp. 2491–2508.
- S. Janson, T. Konstantopoulos, and L. Yuan, On a representation theorem for finitely exchangeable random vectors, J. Math. Anal. Appl. 442 (2016), pp. 703–714.
- J. Jurečková and J. Kalina, Nonparametric multivariate rank tests and their unbiasedness, Bernoulli 18 (2012), pp. 229–251.
- J. Kalina, Classification methods for high-dimensional data, Biocybern. Biomed. Eng. 34 (2014), pp. 10–18.
- J. Kalina, Common multivariate estimators of location and scatter capture the symmetry of the underlying distribution, Commun. Stat. Simul. 50 (2021), pp. 2845–2857.
- O. Kallenberg, Probabilistic Symmetries and Invariance Principles, Springer, New York, 2005.
- A.K. Kuchibhotla, Exchangeability, conformal prediction, and rank tests, preprint (2021). Available at https://arxiv.org/abs/2005.06095v3.
- T. Lipták, On the combination of independent tests, Magyar Tud. Akad. Mat. Kutató Int. Közl. 3 (1958), pp. 171–197.
- J.F. Maa, D.K. Pearl, and R. Bartoszyński, Reducing multidimensional two-sample data to one-dimensional interpoint comparisons, Ann. Stat. 24 (1996), pp. 1069–1074.
- J.H. Maindonald and W.J. Braun, DAAG: Data analysis and graphics data and functions, R package version 1.22, 2015. Available at https://cran.r-project.org/web/packages/DAAG.
- H.J. Malik and B. Abraham, Multivariate logistic distributions, Ann. Stat. 3 (1973), pp. 588–590.
- M. Marozzi, A. Mukherjee, and J. Kalina, Interpoint distance tests for high-dimensional comparison studies, J. Appl. Stat. 47 (2020), pp. 653–665.
- R. Modarres, Tests of bivariate exchangeability, Int. Stat. Rev. 76 (2008), pp. 203–213.
- H. Oja, Multivariate Nonparametric Methods with R: An Approach Based on Spatial Signs and Ranks, Springer, New York, 2010.
- F. Pesarin and L. Salmaso, Permutation Tests for Complex Data: Theory, Applications and Software, Wiley, New York, 2010.
- J.F. Quessy, On consistent nonparametric statistical tests of symmetry hypotheses, Symmetry 8 (2016), Article 31.
- R Core Team, R: A language and environment for statistical computing, R Foundation for Statistical Computing, Vienna, 2018. Available at http://www.R-project.org.
- K.S.M. Rao and M. Raghunath, A simple nonparametric test for bivariate symmetry about a line, J. Stat. Plan. Inference 142 (2012), pp. 430–444.
- H. Sackrowitz and E. Samuel-Cahn, P-values as random variables: Expected p values, Am. Stat. 53 (1999), pp. 326–3321.
- R. Serfling, Multivariate symmetry and asymmetry, in Encyclopedia of Statistical Sciences, S. Kotz, N. Balakrishnan, C.B. Read, B. Vidakovic, eds., 2nd ed., Vol. 8, Wiley, New York, 2006, pp. 5338–5345.
- G.K. Smyth, Limma: Linear models for microarray data, in Bioinformatics and Computational Biology Solutions Using R and Bioconductor, R. Gentleman, V. Carey, S. Dudoit, R. Irizarry, W. Huber, eds., Springer, New York, 2005, pp. 397–420.
- T. Snijders, Rank tests for bivariate symmetry, Ann. Stat. 9 (1981), pp. 1087–1095.
- A. Vexler and J. Yu, To t-test or not to t-test? A p-values-based point of view in the receiver operating characteristic curve framework, J. Comput. Biol. 25 (2018), pp. 541–550.
- A. Vexler, J. Yu, Y. Zhao, A.D. Hutson, and G. Gurevich, Expected p-values in light of an ROC curve analysis applied to optimal multiple testing procedures, Stat. Methods Med. Res. 27 (2018), pp. 3560–3576.
- T. White, J. van der Ende, and T.E. Nichols, Beyond Bonferroni revisited: Concerns over inflated false positive research findings in the fields of conservation genetics, biology, and medicine, Conserv. Genet. 20 (2019), pp. 927–937.
- T. Yanagimoto and M. Sibuya, Test of symmetry of a bivariate distribution, Sankhya A 38 (1976), pp. 105–115.