
ABSTRACT
Owing to the inherent nature of the process, typically material produced via electron beam melting (EBM) has a columnar microstructure. As a result of that, the material will have anisotropic mechanical properties. In this work, anisotropic elastic properties of EBM built Alloy 718 samples at room temperature were investigated by using experiments and modelling work. Electron backscatter diffraction data from the sample microstructure was used to predict the Young’s modulus. The results showed that the model developed in the finite element software OOF2 was able to capture the anisotropy in the Young’s modulus. The samples showed transversely isotropic elastic properties having lowest Young’s modulus along build direction. In addition to that, complete transversely isotropic stiffness tensor of the sample was also calculated.
This paper is part of a thematic issue on Nuclear Materials.
Introduction
According to the ASTM standards, the term additive manufacturing (AM) is defined as a process of joining materials to make objects from 3D model data (from CAD model), usually layer upon layer, as opposed to subtractive manufacturing methodologies [Citation1]. AM is also known as 3D printing, rapid manufacturing, rapid prototyping or freeform fabrication. In recent years, AM has gained high interest in the field of manufacturing engineering due to its attractive features compared to the conventional manufacturing methods such as casting, shaping and machining. Ability to produce complicated geometries, low cost of retooling and control of the microstructure are some of the advantages that have been reported [Citation2].
Electron Beam Melting (EBM) is a type of powder bed AM technique, which was commercialised in 1997 by Arcam Corporation in Sweden [Citation2]. In the EBM process, the powder material is selectively melted by using an electron beam in a layer-by-layer approach. Before melting, the powder material is sintered to overcome the problem with smoking effect caused by powder particle charging [Citation3]. EBM has been shown to be capable of producing high-performance products such as biomedical implants and high-performance superalloy components used in gas turbine engine applications. Faster deposition rates due to high beam energy and speed, lower residual stresses, possibility of tailoring the microstructure [Citation4] and reduced problems with oxidation are some of the advantages of the EBM process when compared with laser powder bed processes [Citation2].
Alloy 718 is a γ′ precipitation hardened nickel-based superalloy, which is extensively used in gas turbine components due to its good mechanical properties at elevated temperatures, corrosion resistance and good weldability [Citation5,Citation6]. Nevertheless, manufacturing Alloy 718 components through traditional manufacturing methods are time consuming and expensive. For an example, machining of Alloy 718 to get the desired shape is difficult due to excessive tool wear and low material removal rate [Citation7,Citation8]. Therefore, the application of novel non-conventional processing methods, such as EBM, is a promising candidate for manufacturing near net shape complex components. In addition to that, EBM opens up a completely new manufacturing platform that enables design freedom for design engineers to come up with topologically optimised components that save material usage, time and money. EBM of Alloy 718 has, therefore, gained high interest within the AM community.
Typically, nickel-based superalloys exhibit anisotropic elastic behaviour at the crystal level depending upon the orientation of the crystal. Nevertheless, at the macroscopic level, the behaviour of these alloys tends to be isotropic due to the randomly oriented polycrystalline grains. When the alloy microstructure contain textured grains (such as in the AM components [Citation2,Citation9,Citation10], directionally solidified alloys [Citation11], cold rolled sheets [Citation12]), the behaviour will become anisotropic. Then the elastic behaviour will change depend upon the direction of loading. Tayon et al. [Citation10] showed that the Young’s modulus of Electron Beam Freeform Fabricated Alloy 718 will change depend up on the angle with respect to the deposition direction. Recent studies [Citation13–15] show that the typical microstructure resulting from the EBM process is columnar in nature with a strong fibre texture towards the build direction. Nevertheless, by changing process parameters and scanning strategies, this can be changed to a microstructure having equiaxed grains [Citation4,Citation9]. This strong texture in the EBM built alloy will cause the material to have anisotropic elastic properties. In the literature, few studies have been reported on evaluating these anisotropic elastic properties of the Alloy 718 produced via electron beam melting [Citation2,Citation9]. In these studies, Young’s Modulus values were calculated using the tensile test data. However, these values are limited to the build direction and normal to the build direction. Both the studies [Citation2,Citation9] showed lower Young’s modulus in the build direction compare to the normal to build direction. As to the authors’ knowledge, no information has been reported on the complete anisotropic elastic property tensor of the EBM produced material. This elastic property tensor is a crucial parameter in finite element (FE) simulation of EBM build components. These FE simulations will help the design engineers to evaluate the performance (such as vibration, strength, stability) of their design before actual manufacturing and make necessary adjustments in advance. Obtaining this elastic tensor through experimental work is time consuming and tidies work.
In this study, a modelling approach was carried out to investigate the anisotropic elastic behaviour of the Alloy 718 produced via EBM. This modelling method, unlike experiments, does not require building relatively larger tensile specimens and thus can minimise time and cost associated with the experiments. It might, therefore, be a valuable technique to investigate the effect of microstructure on mechanical properties thus enabling tailoring the properties in AM.
Experimental work
Material and method
In the present study, the EBM sample was manufactured in an Arcam A2X EBM machine using plasma atomised powder (nominal size ranges from 25 to 106 μm) supplied by Arcam AB. The chemical composition of the powder is given in Table . The manufacturing process started after the powder bed was pre-heated to1000°C. The Arcam standard setting for Alloy 718 was used in this batch. Each deposition cycle consisted of: (1) preheating of the current powder layer, (2) contour melting of the build geometry, (3) hatch melting of the interior of the build geometry, (4) post-heating of the current layer and (5) lowering down the powder bed and raking the powders to form a uniform layer of approximately 75 μm for next cycle. The as-manufactured sample was cuboid, with dimensions as shown in Figure .
Figure 1. Schematic representation of the tensile test sample geometry (all dimensions are in mm). Both direction tensile specimens have the same dimensions.
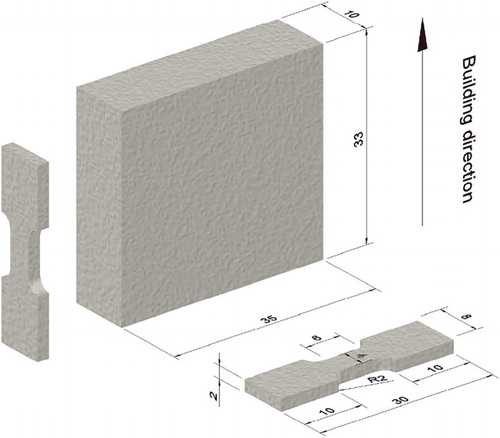
Table 1. Nominal chemical composition of the raw powder.
Tensile testing
It was shown in a previous study [Citation15], by some of the co-authors of this article, that the hatch region of the built sample showed a strong <001>fibre texture along the building direction. However, the overall microstructure of the contour region of the sample did not show any preferential crystallographic texture. They also found that the volume fraction of the contour region was very small compared to the hatch region. Therefore, the tensile test samples were machined out from the hatch region. In order to investigate the elastic properties, the tensile samples were machined out from the direction parallel and normal to the building direction. The geometry details are as shown in Figure . The tensile tests were performed with an Instron 5582 universal test machine in open air and at room temperature, the strain rate was set to 0.1%/s and due to the small sample size a digital image correlation (DIC) system, Image System AB, was utilised to measure the strains during the tensile tests. For each test condition, 3–4 tensile test was performed.
Acquisition of electron backscatter diffraction images
In order to evaluate Young’s Modulus of the sample (both parallel to the build direction and normal to the build direction), electron backscatter diffraction (EBSD) data was utilised. Therefore, to obtain the EBSD data, the as-built samples were cut parallel to the build direction and normal to the build direction as shown in Figure . The EBSD images were taken only from the hatch region of the sample.
Figure 2. Schematic representation of the EBM samples. Hatch planes show the planes that were used to obtain EBSD data.
The samples for EBSD analysis were mounted in Bakelite and mechanically ground from 500 Grit to 4000 Grit. Polishing started with diamond suspensions from 3 to ¼ µm and with OP-U colloidal silica suspension as the final step. Hitachi SU70 FEG scanning electron microscope, equipped with EBSD system from Oxford Instrument, was operated at 20 kV to do the EBSD mappings. The HKL Channel 5 program was used to plot the pole figures, inverse pole figures and the inverse pole figure colouring mapping.
The size of the EBSD images will have an impact on the results. Smaller size EBSD images containing fewer grains might not be a good representation of the grain orientation of the entire microstructure. Therefore, the size of an EBSD image was selected in such a way that a sufficient number of grains were captured. Details of the EBSD acquisition are shown in Table . To investigate the effect of build height on Young’s Modulus EBSD, images were taken at differents locations in the XZ plane.
Table 2. EBSD image acquisition details.
Modelling work
The EBSD image contains crystal orientations data of the microstructure. Therefore, it is possible to evaluate the Young’s Modulus of the sample based on these crystal orientations with the use of single-crystal elastic constant data [Citation10,Citation16]. FE analysis was then used to predict the Young’s Modulus of the EBM build Alloy 718 sample. Additionally, a texture analysis method was utilised to visualise the Young’s Modulus variation with respect to the build direction of the sample and to compute the anisotropic elastic material property tensor.
Elastic constants of alloy 718
The generalised Hook’s law for a material can be written as follows where is the stress vector,
is the stiffness matrix and the
is the corresponding strain vector. Generally, with respect to an arbitrary coordinate system, the stiffness matrix has 21 independent components (elastic constants). However, with the presence of crystal symmetries, the number of independent elastic contents that is needed to define the stiffness matrix will be drastically reduced [Citation17]. For instance, material having cubic, hexagonal and tetragonal crystal symmetries will have three, five and six elastic constants, respectively. In this study, it is assumed that the properties of Alloy 718 mainly originate from the matrix γ phase having the cubic crystal structure with three independent elastic constants.
Independent elastic constants are key parameters when it comes to computing material properties such as Young’s Modulus, shear modulus and Elastic wave velocities from microstructure data. Inputting reasonably right value for these constants make the prediction more reliable and accurate. Table summarises the published data from the literature related to Alloy 718 elastic constants together with other nickel-based superalloys elastic constants (which has been used as Alloy 718 elastic constants in modelling works). For comparison purposes, elastic constants related to pure nickel are also presented. The directional Young’s Modulus of the single crystal material presented in the Table has been calculated by using the equation (1) found in the literature [Citation17]. This helps to get a good picture of the effect of these elastic constants on the mechanical behaviour, especially of a material having a strong texture.
(1)
Table 3. Single crystal elastic constants (units in GPa) of nickel-based superalloys and directional Young’s Modulus values (units in GPa).
Here Ed is the directional Young’s Modulus, Sij are the compliance matrix constants, Cij are the stiffness matrix constants and h, k, and l are the direction indices.
As presented in the table, the reported elastic constants for the Alloy 718 gave different directional Young’s Modulus values. In some cases, they were lower than the pure Nickel directional Young’s Modulus value. The average values of the reported elastic constants were, therefore, used in this study.
FE approach
To simulate the tensile test numerically, 2D FE modelling was carried out by using the open source software code, OOF2, developed at National Institute of Standards and Technology [Citation18]. Information of about this software and its use can be found in [Citation19].
First, the EBSD data were inputted to OOF2 through the orientation map function. Based on the orientation data, an EBSD image was constructed. The simple meshing algorithm was used to generate an FE mesh. In this procedure, each pixel on the EBSD image was converted into two triangular elements. The diagonal dividing each pixel was alternated from pixel to pixel so that the orientations of the right-triangle elements were not all the same. Selected single crystal elastic constants were thereafter given as material property to the model. Plane stress condition was assigned and boundary conditions applied as shown in Figure . Finally, Young’s Modulus values of the EBSD image were predicted by considering the applied displacement and the resulting force at the boundary.
Figure 3. Schematic representation of the boundary conditions used in OOF2 model.
Texture analysis method
Based on the EBSD analysis data, the material exhibits a strong <100> crystallographic orientation parallel to the build direction. Therefore, Young’s Modulus of the material will vary in different directions. To visualise this variation, Young’s Modulus of the sample was computed and plotted as a function of the angle with respect to the build direction. For this MTEX (version 4.5.0), a free texture analysis toolbox for Matlab®[Citation20] was used.
In order to calculate Young’s Modulus using MTEX, Voight [Citation21], Reuss [Citation22] and Hill [Citation23] average material stiffness tensors (6X6) have to be calculated. These tensors were, therefore, calculated based on the single crystal elastic constants and the crystal orientation data from EBSD analysis. The Voigt and Reuss solutions, respectively, provide the upper and lower bounds for the effective elastic stiffness for the material. When averaging the elastic stiffness of each crystal over the whole domain, Voight method assumes that the local strain is to be uniform in the material. Whereas in Reuss method, it assumes that the local stress of the material to be uniform. Measured elastic stiffness tensors of a polycrystalline material have been shown to usually lie between these upper and lower bound. Therefore, Hill [Citation23] suggested an averaging criterion based on the upper and lower bound of the elastic field limits. Hill suggested that calculating the volume-weighted arithmetic mean of the Voight and Reuss solutions would give a better estimation of the elastic stiffness value, which is close to the experimentally observed value. Using the computed Hill average material stiffness matrices, Young’s Modulus values were computed with respect to the angle from the build direction.
Results and discussion
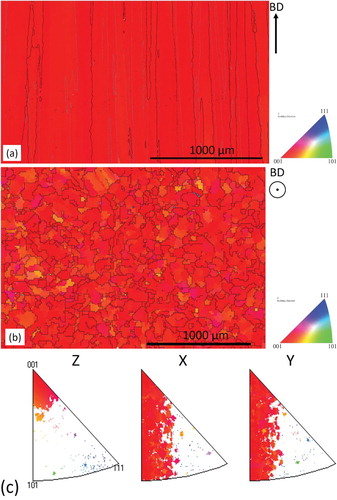
When analysing the EBSD data, it was observed that the material has a columnar grain microstructure with strong crystallographic fibre texture along the build direction, as can be seen in Figure . In the building direction, the samples preferentially showed a strong <001> crystallographic orientation. This could be due to the strong thermal gradient that results in the build direction while building the sample [Citation9]. During the solidification process, materials having a f.c.c. crystal structure, like Alloy 718, has a tendency to orient the <001> direction along the steepest thermal gradient direction [Citation24]. In contrast, normal to the build direction, the material did not show any strong texture. Along both X and Y directions, grain orientations were more uniform with any random orientation between the <001> and <101>directions. This kind of columnar textured EBM Alloy 718 microstructures are in accordance with previously reported EBM Alloy 718 microstructures [Citation4,Citation9,Citation25].
Figure 4. EBSD invers pole figure colour maps from hatch region: (a) parallel to the build direction (BD), (b) normal to the build direction (BD), inverse pole figure maps for the EBSD image in (b).
The Young’s Modulus values predicted using the FE modelling work is given in Table . It can be seen that the selected image sizes were enough to predict Young’s Modulus. In this study, deferent images with different resolutions were also evaluated. Higher resolution (images with 1 µm step size) images give a more accurate representation of the grain orientations at a cost of higher EBSD image acquisition time. Whereas lower resolution (images with 15 µm step size) will give less accurate information about the orientation distribution with faster EBSD accusation time. When looking at the results, a considerable amount of difference between the low- and high-resolution images was not observed. This indicates that low-resolution images were good enough to capture adequate information that is needed to represent the grain orientation of the microstructure. This also gives the additional advantage of decrease in computational time since the FE simulations based on high-resolution images are significantly more time consuming compared to analyses that use lower resolution images.
Table 4. Predicted Young’s Modulus.
Figure , shows the average Young’s Modulus values obtained from both the modelling work and the tensile testing in parallel to build direction and normal to the build direction. For comparison purposes, Young’s Modulus values that are reported in the literature [Citation2,Citation9] for EBM Alloy 718 with a similar columnar microstructure are also shown. It can be seen that the Young’s Modulus parallel to the build direction was lower than the value normal to the build direction indicating a strong anisotropy. This is as a result of the lowest Yong’s modulus in the f.c.c. crystal is in the <001> direction, Table . The average Young’s Modulus values in X and Y direction were very similar, Table . The values were in between <001>and <101>directional Young’s Modulus values of the Alloy 718 single crystal. This is because of the observed random crystal orientation distribution between <001> and <101> direction in the XY plane (refer inverse pole figures in Figure ).
Figure 5. Average Young’s Modulus from Experimental and Modelling work together with reported Young’s Modulus values of EBM Alloy 718 with columnar microstructure.
Both the predicted and the measured Young’s Modulus data show that the material exhibits a transversely isotropic behaviour. This behaviour was also confirmed when analysing the overall Hill elastic matrix of the sample. The overall Hill elastic stiffness matrix that was calculated using the MTEX toolbox is shown in Table . The values that should appear in the blank cells in the table were actually not zero. However, compared with the larger values in the matrix, these were very small and, therefore, neglected (assumed to be zero). By looking at the values, it can be seen that C11 ≈ C22, C13 ≈ C23 and C44 ≈ C55. This indicates that the EBM Alloy 718 sample used in this study exhibits transversely isotropic elastic behaviour. This elastic tensor data will be valuable when conducting FE modelling work of EBM Alloy 718 components that exhibits transversely isotropic behaviour. In addition, it can be used to evaluate the Young’s modulus and shear modulus variation of the sample. Conducting experiments to get this tensor data would be complicated and tidies. Therefore, evaluating this matrix from EBSD data would be an easy alternative solution with reasonable accuracy.
Table 5. Overall elastic stiffness matrix.
The experimental Young’s Modulus values obtained in this study were in general lower than the corresponding values predicted from the models. Moreover, they were lower than the values found in the published literature. Parallel to the build direction, the experimental Young’s Modulus value was around 100 GPa which was lower than the lowest possible Young’s Modulus value (in <001> direction) for pure Nickel (refer Table ). One can argue that this could be as a result of the observed porosity in the sample since the porosity was neglected in the modelling work. However, the observed porosity value (which were calculated by using Scanning Electron Microscopy Images) was approximately 1%. Therefore, the effect of porosity on Young’s Modulus can be assumed negligible. A possible reason for the low experimental Young’s Modulus could be due to the experimental method. As previously stated, the DIC method was utilised since the tensile samples were small. Therefore, the strain measurement of the experiments was not linked to the tensile testing while the test was performed. Strains were instead calculated separately using the obtained images from the DIC method. This might have caused an error when calculating the Young’s Modulus from strains obtained from DIC measurements. The predicted Young’s Modulus values were in good agreement with values found in the published literature for EBM Alloy 718 samples, which had a columnar microstructure. In addition to that, the method was able to capture the anisotropy of the build sample.
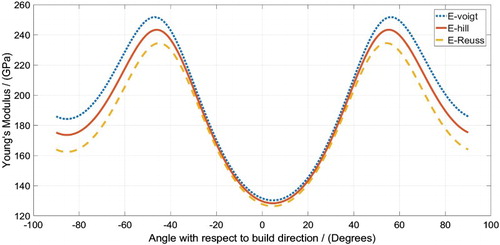
Figure shows the Voight, Ruess and Hill Young’s Modulus variation with respect to the build direction. This variation is similar to Young’s modulus variation that observed in the directionally solidified nickel-based superalloys [Citation11]. From the graphs, it can be observed that Young’s Modulus reached a higher value (even higher than normal to the build direction), at an angle of 50–60 degrees from the build direction. The value is almost twice the value of the parallel to the build direction. This was also observed in the FE modelling work of Image 14, Table . This value is in between <101> and <111> directional Young’s Modulus values of the ALLOY 718 single crystal. Therefore, the material will have a higher stiffness in this direction compared to other directions. This indicates that the stiffness that is needed in the loading direction of a physical component can be changed by changing the orientation of the build component in the build chamber.
Figure 6. Young’s Modulus variation with respect to the build direction.
Conclusions
In this study, elastic properties of the Alloy 718 samples produced via EBM were studied. For this, both modelling and experimental methods were utilised. The following conclusions were made based on the observed results.
The samples showed significant anisotropic elastic properties. Lowest Young’s modulus was observed along the build direction. Normal to the build direction elastic properties were shown isotropic. Overall, elastic behaviour of the sample was similar to the transversely isotropic case.
The modelling method used in this study was able to capture the anisotropic elastic properties with reasonable accuracy.
Young’s modulus of the sample varied with respect to the angle with the build direction. The highest Young’s Modulus value was observed in between the build direction and normal to the build direction. This indicates that the stiffness of a component can be tailored by changing the component build orientation in the build chamber.
These modelling results indicate that the proposed modelling method can be utilised in evaluating the elastic properties of functionally graded or tailored microstructures using EBM.
Acknowledgements
The authors would like to thank Sandvik Machining Solutions AB in Sandviken, Sweden for providing EBM ALLOY 718 material for this research and Dr Stephen Langer at National Institute of Standards and Technology for the support in the modelling work with OOF2.
Disclosure statement
No potential conflict of interest was reported by the authors.
ORCID
Chamara Kumara http://orcid.org/0000-0002-4087-6467
Per Nylén http://orcid.org/0000-0001-7787-5444
Additional information
Funding
Reference
- Standard Terminology for Additive Manufacturing Technologies. F2792-12a A. West Conshohocken (PA): ASTM International;2012. www.astm.org.
- Sames WJ. Additive manufacturing of Inconel 718 using electron beam melting: processing, post- processing, & mechanical properties, PhD Thesis. Texas A&M University, Texas. 2015.
- Sames WJ, List FA, Pannala S, et al. The metallurgy and processing science of metal additive manufacturing. Int Mater Rev. 2016;6608:1–46.
- Dehoff RR, Kirka MM, List FA, et al. Crystallographic texture engineering through novel melt strategies via electron beam melting: Inconel 718. Mater Sci Technol. 2015;31:939–944. doi: 10.1179/1743284714Y.0000000697
- Attallah MM, Jennings R, Wang X, et al. Additive manufacturing of Ni-based superalloys: the outstanding issues. MRS Bull. 2016;41:758–764. doi: 10.1557/mrs.2016.211
- Wang Z, Guan K, Gao M, et al. The microstructure and mechanical properties of deposited-ALLOY 718 by selective laser melting. J Alloys Compd. 2012;513:518–523. doi: 10.1016/j.jallcom.2011.10.107
- Costes JP, Guillet Y, Poulachon G, et al. Tool-life and wear mechanisms of CBN tools in machining of Inconel 718. Int J Mach Tools Manuf. 2007;47:1081–1087. doi: 10.1016/j.ijmachtools.2006.09.031
- Attia H, Tavakoli S, Vargas R, et al. Laser-assisted high-speed finish turning of superalloy Inconel 718 under dry conditions. CIRP Ann Manuf Technol. 2010;59:83–88. doi: 10.1016/j.cirp.2010.03.093
- Körner C, Helmer H, Bauereiß A, et al. Tailoring the grain structure of ALLOY 718 during selective electron beam melting. MATEC Web Conf. 2014:14; doi: 10.1051/matecconf/20141408001
- Tayon Wa, Shenoy RN, Redding MR, et al. Correlation between microstructure and mechanical properties in an inconel 718 deposit produced via electron beam freeform fabrication. J Manuf Sci Eng. 2014;136: 61005–061005–061007. doi: 10.1115/1.4028509
- Hermann W, Sockel HGG, Han J, et al. Elastic properties and determination of elastic constants of nickel-base superalloys by a free-free beam technique. Superalloys. 1996: 229–238.
- Hu HH. Elastic properties of cold-rolled and annealed sheets of phosphorus steel having high normal plastic anisotropy. Texture Cryst Solids. 1980;4:111–127. doi: 10.1155/TSM.4.111
- Kirka MM, Unocic KA, Raghavan N, et al. Microstructure development in electron beam-melted Inconel 718 and associated tensile properties. JOM. 2016;68:1012– 1020. doi: 10.1007/s11837-016-1812-6
- Helmer H, Bauereiß A, Singer RF, et al. Grain structure evolution in Inconel 718 during selective electron beam melting. Mater Sci Eng A. 2016;668:180–187. doi: 10.1016/j.msea.2016.05.046
- Deng D, Moverare J, Peng RL, et al. Microstructure and anisotropic mechanical properties of EBM manufactured Inconel 718 and effects of post heat treatments. Mater Sci Eng A. 2017;693:151–163. doi: 10.1016/j.msea.2017.03.085
- Den Toonder JMJ, Van Dommelen JAW, Baaijens FPT. The relation between single crystal elasticity and the effective elastic behaviour of polycrystalline materials: theory, measurement and computation. Model Simul Mater Sci Eng. 2000;7:909–928. doi: 10.1088/0965-0393/7/6/301
- Hosford WF. The mechanics of crystals and textured polycrystals. Oxford: Oxford University Press; 1993.
- OOF2. Available from: https://www.ctcms.nist.gov/oof/oof2/. 2017 May 13.
- Langer SA, Fuller ER, Carter WC. OOF: an image-based finite-element analysis of material microstructures. Comput Sci Eng. 2001;3:15–23. doi: 10.1109/5992.919261
- MTEX. Available from: http://mtex-toolbox.github.io/. 2017 May 13.
- Voigt W. Lehrbuch der kristallphysik VW. mit ausschluss der kristalloptik. Sammlung von Lehrbèuchern auf dem Gebiete der Math. Wissenschaften. Leipzig: B.G. Teubner; 1928.
- Reuss A. Berechnung der Fließgrenze von Mischkristallen auf Grund der Plastizitätsbedingung für Einkristalle. ZAMM. J Appl Math Mech/Zeitschrift für Angew Math und Mech. 1929;9:49–58. doi: 10.1002/zamm.19290090104
- Hill R. The elastic behaviour of a crystalline aggregate. Proc Phys Soc Sect A. 1952;65:349–354. doi: 10.1088/0370-1298/65/5/307
- Grong O. Metallurgical Modelling of Welding. Boca Raton (FL): CRC Press; 1997.
- Strondl A, Palm M, Gnauk J, et al. Microstructure and mechanical properties of nickel based superalloy ALLOY 718 produced by rapid prototyping with electron beam melting (EBM). Mater Sci Technol. 2011;27:876–883. doi: 10.1179/026708309X12468927349451
- Reed RC. The superalloys fundamentals and applications. Cambridge: Cambridge University Press; 2006.
- Haldipur P, Margetan RBT FJ. Estimation of single-crystal elastic constants from ultrasonic measurements on polycrystalline specimens. AIP Conf Proc AIP. 2004;700(1):1061–1068. doi: 10.1063/1.1711735
- Martin G, Ochoa N, Saï K, et al. A multiscale model for the elastoviscoplastic behavior of directionally solidified alloys: application to FE structural computations. Int J Solids Struct. 2014;51:1175–1187. doi: 10.1016/j.ijsolstr.2013.12.013
- Jothi S, Merzlikin S V, Croft TN, et al. An investigation of micro-mechanisms in hydrogen induced cracking in nickel-based superalloy 718. J Alloys Compd. 2016;664:664–681. doi: 10.1016/j.jallcom.2016.01.033
- Holden TM, Holt RA, Clarke AP. Intergranular strains in Inconel-600 and the impact on interpreting stress fields in bent steam-generator tubing. Mater Sci Eng A. 1998;246:180–198. doi: 10.1016/S0921-5093(97)00732-6
- Wang Z, Stoica AD, Ma D, et al. Diffraction and single-crystal elastic constants of Inconel 625 at room and elevated temperatures determined by neutron diffraction. Mater Sci Eng A. 2016;674:406–412. doi: 10.1016/j.msea.2016.08.010
- Han J, Bertram A, Olschewski J, et al. Identification of elastic constants of alloys with sheet and fibre textures based on resonance measurements and finite element analysis. Mater Sci Eng A. 1995;191:105–111. doi: 10.1016/0921-5093(95)80008-5