
ABSTRACT
Modelling of tertiary creep in single-crystal superalloys – operative over the majority of the temperature/stress regime of relevance – is assessed. Traditional, empirical approaches are useful for the prediction of component life; a modern trend is for more physically faithful models which account for microstructure and alloy composition. Calculations are made using different methods, to identify advantages/disadvantages, in an effort to approach best practice. The predictions are tested against experimental data. The creep resistance can be estimated to within approximately one-half of a Larson–Miller parameter, from an input of alloy composition, deformation conditions, and estimates of microstructural parameters, rate laws (and parameters therein), and physical constants. Different merit indices are considered to identify the most appropriate for compositional optimisation.
1. Introduction
The nickel-based superalloys – especially when cast in single-crystal form – display outstanding resistance to creep behaviour even at temperatures beyond 1000°C. This justifies their use for critical components needed for jet propulsion and power generation [Citation1–3]. Nevertheless, when one examines typical compositions employed in practice, one finds that only relatively few alloys have entered service. Over time, there has been a trend to improve creep performance via alloying with refractory elements such as tantalum, molybdenum, tungsten, and particularly rhenium, at the expense of reduced corrosion resistance impaired by the lower chromium contents needed to maintain alloy stability, e.g. with respect to the precipitation of topologically close-packed (TCP) phases [Citation4,Citation5].
Why are relatively few alloy compositions available? The main reason is the traditional, overarching emphasis on empirical means of alloy development, which involves many make/test iterations, followed by experimental testing for the purpose of screening, ranking, and subsequent down-selection. This leads to considerable cost but also significant lag in the insertion of new grades into practice [Citation6]. There is no doubt also that the theory and models developed so far have been insufficiently accurate to make a difference to the prevailing situation. Consider the available models for the creep deformation behaviour of this class of alloy, for example, those based upon damage mechanics approaches. The earliest contain many fitting parameters and are rather empirical [Citation7–11]. The latest are more microstructurally explicit and depend upon estimates of microstructural-scale and rate-dependent evolution laws for dislocation content [Citation12–16]. Most can be applied well once a given alloy composition has been fixed, for example, to predict the effects of altering temperature or stress state. So they are useful for component lifing. But it is very rare for such models to be sensitive to changes in material chemistry; it is only with this capability that optimisation of alloy composition can be achieved [Citation17].
The research in the present paper was carried out with the above in mind. We set out to consider the modelling of the creep phenomenon in these materials, with an emphasis on the influence of alloy composition, microstructural architecture, and dislocation evolution. Within this scope, we focus on the tertiary creep deformation mode, operative at intermediate levels of applied stress and temperature, as illustrated in Figure . Its main characteristics are that neither precipitate shearing nor rafting is prevalent and that deformation is largely confined to the γ matrix, thus giving rise to a steady increase in creep strain rate with creep strain [Citation1,Citation18,Citation19]. Existing analysis procedures available in the literature are reviewed first. Then, a new merit index which relates alloy composition to creep performance is introduced. By testing against a significant set of experimental data mined from the literature, it is demonstrated that the new approach has advantages over those currently available.
Figure 1. Plot illustrating the regimes of temperature and applied stress under which primary, tertiary, and rafting modes of creep deformation are dominant for the single-crystal superalloy CMSX-4, adapted from reference [Citation1].
![Figure 1. Plot illustrating the regimes of temperature and applied stress under which primary, tertiary, and rafting modes of creep deformation are dominant for the single-crystal superalloy CMSX-4, adapted from reference [Citation1].](/cms/asset/b8cc289f-a9d7-4392-86c7-ecf790d24bc6/ymst_a_1528733_f0001_oc.jpg)
2. Background and literature review
Early attempts to describe the evolution of creep damage in engineering materials by da Andrade [Citation20], Dorn [Citation21], Garofalo [Citation22], or Webster [Citation23] were based largely upon empiricism and sought to offer optimal mathematical representations of observed experimental creep curves. Later advances including the 6-θ-projection technique [Citation24] or the Ω-method [Citation25] added more fitting parameters to their formulations. While this facilitated reasonable mathematical descriptions of large creep data sets, only limited further insight into operative creep damage mechanisms was gleaned.
Such shortcomings led to the development of creep continuum damage mechanics (CDM) models [Citation26,Citation27]. These relate the creep strain rate to measurable, external parameters – stress, strain, temperature, and time – and to a number of internal state variables, , which provide a measure for accumulated damage [Citation26]. A constitutive model is then proposed by an equation for the evolution of creep strain rate and by i equations for the evolution of
:
(1) The origins of creep CDM lie in the attempts of Kachanov [Citation28] and Rabotnov [Citation29] to quantify damage evolution during tertiary creep using a single internal damage parameter. This method was later expanded by Leckie and Hayhurst [Citation30] to also include the effects of multiaxial stress states. Despite these approaches being similar to previous empirical relations, they laid the foundations for physically based CDM, in which damage parameters and damage rates are associated with distinct physical mechanisms and are directly related to microstructural evolution. Dyson [Citation31] identified three broad categories of operating mechanisms based on the kinetics of damage evolution: (1) strain-induced damage, where the damage rate depends on stress, temperature, the level of internal back-stress, H, and the current level of accumulated damage, D; (2) thermally induced damage, depending on temperature and accumulated damage alone; and (3) environmentally induced damage, in which the mean radius of the specimen, R, also plays a role in controlling the damage rate:
(2) A comparison of Equations (Equation1
(1) ) and (Equation2
(2) ) reveals that H and D represent two physically rationalised state variables,
and
, for which the evolution functions
and
are derived from theory. Suitable damage parameters and damage rates have been compiled by McLean and Dyson [Citation27] for the most common examples of creep damage: multiplication of mobile dislocations and creep-constrained cavity growth (strain-induced), particle coarsening and depletion of solid solution elements (thermally induced), and internal oxidation or corrosion (environmentally induced). The present work focuses on the first two categories and assumes that environmental effects can be neglected for bulk specimens, as do virtually all other creep CDM models for nickel-based superalloys.
A selection of constitutive equation sets describing tertiary creep in superalloys is presented chronologically in Table . A general comparison reveals a persisting lack of agreement on the impact of certain factors on creep resistance. However, the overall approach has remained the same and can be discussed in the context of physically based CDM [Citation34]. For example, an early creep model proposed by Dyson and McLean [Citation7] can be re-written as a CDM formulation involving multiplication of mobile dislocations and particle coarsening. Furthermore, Dyson [Citation31] showed that empirical lifing methods including the Larson–Miller parameter can be readily derived from CDM after making suitable physical assumptions.
Table 1. Models of tertiary creep in superalloys compiled from open literature. Each model is represented by a set of constitutive CDM equations describing creep damage evolution. The column on the right lists parameters determined by fitting models to experimental results and which are not given a clear physical derivation in the respective studies. A general trend towards less fitting parameters over time can be observed.
Early creep models [Citation8–11] provide few or no explanations for the values of fitting parameters involved. Although this issue was acknowledged later on [Citation31], most parameters were still obtained by fitting numerical calculations to experiments. The first truly physically based model, relating damage rates directly to alloy composition and microstructure, was that of Manonukul et al. [Citation12]. It was followed by other similar formulations with certain adjustments [Citation13–15,Citation35]. For example, Coakley et al. [Citation36,Citation37] expanded a previous model by Dyson [Citation14] to account for multimodal particle distributions. A notable recent entry is the work of Kim et al. [Citation16], who followed a similar approach to the present study and used thermodynamic calculations to inform their creep model with regard to microstructure. It should be pointed out that the list in Table is only exemplary, and that many other models have been proposed, some of which include mechanistic expressions too complex to be reproduced above in short [Citation35,Citation38–45].
When comparing physically based models for intermediate-temperature creep, several common traits within the expressions for creep strain rate become clear. First, creep resistance increases with higher volume fraction,
, and lower effective diffusivity,
. Second, the internal back-stress, usually depending on particle spacing,
, has a profound significance on creep rate evolution. Third, particle coarsening plays an important role in affecting particle spacing, and in turn internal stresses. Fourth, the choice of values defining initial microstructure, including initial dislocation density,
, and initial precipitate radius,
, influence model predictions significantly. Finally, the same is also the case for functions derived to describe parameters like effective diffusivity,
volume fraction, or an invoked constant damage multiplication parameter,
or
, used to quantify the increase in mobile dislocation density. The latter two points have been clearly illustrated in the work of Zhu et al. [Citation15], who observed significant changes in simulated creep curves with varying values of
volume fraction,
particle size, initial dislocation density, and dislocation multiplication parameters. It can be expected that other models will behave similarly. This is problematic in the context of developing a model suitable for a wide range of alloys, as constant values rationalised for one particular case may not apply to others.
A critique on the usefulness of the different models is challenging for a number of reasons. Oruganti [Citation33,Citation46] pointed out that cases of poor correspondence between experiments and model predictions are often attributed to gaps in understanding damage mechanisms rather than to the basic constitutive creep laws used. As such, the critical assessment of these laws is of importance. For example, efforts to describe creep over a wide range of conditions led in the 1940s to the use of exponential or hyperbolic sine laws [Citation47]. These were later rationalised theoretically by Friedel [Citation48] and Hirth and Lothe [Citation49] in their seminal works on dislocation theory. An advantage of expressions is their ability to capture the strong influence of applied stress on creep life. However, when used in some models above, they give rise to an overestimation of the role of particle spacing, which is not backed up by experiments [Citation27,Citation33]. Furthermore, the use of constant stress exponents within power-law descriptions has been recently criticised as too simplistic and not supported by microstructural and physical observations [Citation50]. The same can also be stated in the case of internal back-stresses, often associated with certain strengthening mechanisms and assumed to evolve over time [Citation51,Citation52]. Attempts at addressing such issues with the introduction of effective – as opposed to directly measured – creep parameters do not shed more light on intrinsic damage accumulation [Citation53,Citation54]. Lastly, damage multiplication parameters, which relate the increase in mobile dislocations to the respective strain rate, have been assumed to depend linearly on initial dislocation density and to remain constant [Citation13,Citation14]. No clear explanation for this choice exists, and recent discrete dislocation dynamics (DDD) modelling efforts revealed that severe fluctuations in the value of
can be expected during creep [Citation55]. Such shortcomings provided an incentive for the development of a new modelling approach, complex enough to capture key influences of chemistry and microstructure on alloy properties, but simple enough to be applied in alloy design studies.
3. Modelling of tertiary creep phenomenon
3.1. General modelling approach
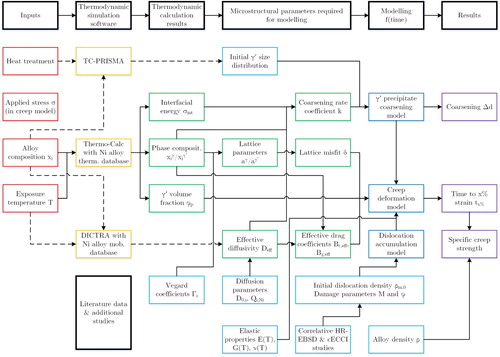
The main procedural steps and computational aspects used in this paper build upon those of the Alloys-By-Design (ABD) method [Citation6] and are illustrated in the process flow diagram of Figure . Necessary inputs include alloy chemistry and creep conditions – applied stress along the technically relevant crystal direction and temperature. These inputs can be precisely specified for known commercial alloys or standard testing conditions. Alternatively, a large design space can be generated by setting ranges and increments for each chemical element and can then be investigated to isolate compositions predicted to possess optimal property trade-offs, following references [Citation56,Citation57].
Figure 2. Process flow diagram representing the main steps taken to model precipitate coarsening and creep strain accumulation.
Alloy composition and temperature serve as inputs for CALPHAD thermodynamic modelling which estimates key microstructural parameters. In the present work, version 2016b of the Thermo-Calc software package was used along with the TCNi8 thermodynamic database and the MOBNi3 mobility database. Computed values include the interfacial energy between γ and ,
, the partitioning coefficients of different elements, and phase volume fractions. Of particular interest are the
fraction,
, and – for less stable alloys – the fractions of deleterious TCP phases. In combination with further models and data from the literature, Thermo-Calc predictions are used to estimate other important parameters such as lattice misfit, δ, and the coarsening rate coefficient, k. As noted by the use of dashed arrows, the current approach can be extended with other simulation packages. This includes using TC-PRISMA to analyse effects of chemistry and heat treatments on nucleation and growth of
precipitates, or using DICTRA to estimate effective diffusivity parameters.
In the final steps, sets of constitutive model equations are integrated for each alloy from time zero using standard finite difference methods. The results are predictions regarding (1) the coarsening of precipitates during high-temperature exposure and (2) the evolution of creep strain. Further user-defined merit indices – such as density-corrected creep strength – can be applied within ABD studies.
A novel addition is incorporating data from correlative high-resolution EBSD (HR-EBSD) and electron channelling contrast imaging under controlled diffraction conditions (cECCI) studies on specimens tested until pre-defined levels of creep strain. These provide both a quantitative and a qualitative evaluation of dislocation structure evolution during creep and lead to a more experimentally grounded description of damage through dislocation accumulation.
3.2. Modelling of superalloy microstructure and physical properties
Most creep models in the literature focus on reproducing experimental results for a few commercial alloys, and so they apply known values of precipitate size, elastic modulus, or lattice misfit. However, for alloy design purposes, changes of these properties with chemistry must be considered in further detail. In certain cases, this cannot be achieved accurately with current CALPHAD methods, and pragmatic estimates are needed.
3.2.1.  particle distribution
Essential features of the microstructure being modelled are shown in Figure . For modern single-crystal superalloys, it consists of a high volume fraction of the ordered precipitate phase residing within the face-centred cubic γ matrix. Precipitates are modelled as cubes with side length d and interparticle spacing w. A simple, unimodal distribution is shown below; however, the model accounts for variations in size by assuming a normal size distribution for d, with a mean value of 450 nm and a standard deviation of 150 nm. As the constitutive creep equations require discrete values, this distribution is approximated by a histogram containing 5 bins with an equal bin width of 100 nm.
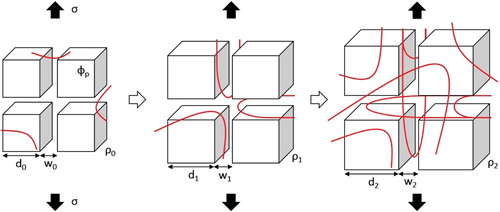
Figure 3. Assumed evolution of damage during tertiary creep in single-crystal superalloys. The main operating mechanisms are (1) an increase in mobile dislocation density in γ matrix channels, ρ, and (2) coarsening of precipitates, i.e. an increase of the average cube side length, d, and of the interparticle spacing, w.
The mean value of 450 nm has been noted to lead to optimal creep properties in typical modern superalloys with a low, negative lattice misfit at high temperatures [Citation58,Citation59]. It is assumed here that it can be attained for any particular composition through appropriate heat treatments. However, it would be insufficient to only consider mean particle size – as done in most creep models – since it has been shown that a homogeneous microstructure, with evenly distributed particles oriented along the crystal direction, significantly improves creep strength [Citation60]. The standard deviation of 150 nm was chosen based on particle size measurements carried out on recently developed ABD alloys [Citation56] and is also assumed to remain constant for all investigated compositions. For regions with constant
volume fraction and size, it follows from geometry that
, and that
.
3.2.2. Elastic properties
Influences of chemistry on elastic properties have been commonly estimated separately for each phase using ‘rule-of-mixtures’ approaches, with the moduli of individual elements being scaled for temperature [Citation16,Citation61]. For example, Kim et al. [Citation16] calculated the temperature dependence of shear modulus, G, as:
(3) Here, factors
represent changes in the shear moduli of pure nickel and of pure Ni3Al caused by an amount
of alloying element i. For the
phase, different changes in modulus depending on the location of alloying elements on Ni or on Al sites are taken into account. Partitioning coefficients
and site fractions
can be obtained from CALPHAD calculations. Ultimately, Kim et al. derived optimal values for
,
, and
for a range of elements by calibrating Equation (Equation3
(3) ) to match experimental data.
While this approach shows promise for general alloy design purposes, it assumes isotropic elastic properties and can only be applied to polycrystalline materials. In contrast, early studies of elastic properties in directionally solidified superalloys showed a strong dependence on crystal direction [Citation62,Citation63]. As discussed in more detail by Reed [Citation1], this stems from the anisotropic elasticity of pure nickel in single-crystal form, and must be considered when modelling mechanical properties of new single-crystal superalloys.
Siebörger et al. [Citation64] carried out extensive measurements of the temperature dependence of Young's modulus, shear modulus, and Poisson's ratio of superalloy CMSX-4 and its isolated γ and phases. Based on tests in near
and
directions, these authors derived linear temperature dependences for
,
, and
between room temperature and 1000°C. These data can be used to calculate stiffness matrix components
,
, and
at a certain temperature. Lastly, elastic properties along the active
slip planes during loading along the
tensile axis can be obtained.
Morrell et al. [Citation65] compared the relative effects of temperature, crystal orientation, and chemical composition on the elastic moduli of several commercial single-crystal superalloys. These authors concluded that the effect of composition on stiffness tensor values is a minor one. This is in agreement with the observations of Dye et al. [Citation66], who compiled experimental data on stiffness matrix components for a range of superalloys and compared these results to the levels of solid solution strengtheners (Cr+Mo+Re+W) and of -formers (Al+Ta+Ti) in each alloy. No clear trends could be distinguished for solid solution strengtheners, while titanium in particular was noted to increase the stiffness of
. Considering the results of Morrell et al. and Dye et al. pragmatically, it can be expected that deviations from the ideal
orientation during casting will have a much more significant effect than chemistry. As such, in the present work, the temperature-dependent results obtained by Siebörger et al. for CMSX-4 are applied generally to all compositions.
3.2.3. γ/ lattice misfit
Interfaces between matrix and precipitates are assumed to be coherent in the present study, and misfit stresses are not taken into account. As lattice misfit is often cited as a key parameter for alloy design and improved creep strength, reasons for this omission are discussed in the following.
First, there is no clear consensus regarding either the optimal magnitude, or the optimal sign of lattice misfit for increased creep resistance [Citation67]. On the one hand, it seems beneficial to keep the value close to zero, in order to obtain a low coarsening rate coefficient and homogeneous, cuboidal precipitates [Citation1,Citation68–70]. On the other hand, it has been suggested that a high, usually negative, mismatch will promote dense dislocation networks at γ/ interfaces, ultimately leading to increased protection against precipitate shearing [Citation71–79].
Second, regression analysis studies carried out by Harada et al. [Citation80–83] revealed a decreasing influence of misfit and an increasing influence of solid solution strengthening on creep properties as testing temperature is reduced. While dense interfacial dislocation networks appear important in the rafting regime, they do not play a main role for tertiary creep.
Third, and of most importance from a practical perspective, influences of chemistry and temperature on lattice misfit cannot be accurately predicted by current methods, as seen in Figure . With respect to misfit calculations for alloy design, most authors including Caron [Citation84], Reed [Citation1,Citation6], and Rettig [Citation70] follow the approach proposed by Watanabe and Kuno [Citation85] to calculate lattice misfit, δ, and lattice constants for γ and at room temperature as:
(4) where
is the lattice constant of pure nickel or pure Ni3Al, and
and
are the Vegard coefficient and the atomic fraction of chemical element i in phase j. Following Caron [Citation84],
and
are taken as 3.524 Å and 3.57 Å, respectively. Values for the Vegard coefficients of different elements can be found in the works of Mishima et al. [Citation86], Nash [Citation87], Kablov et al. [Citation88], or Reed [Citation1]. Phase compositions can be estimated using CALPHAD methods. While reported values for Vegard coefficients are in reasonable agreement, there are significant differences between studies for certain elements, leading to discrepancies between misfit results based on different datasets.
Figure 4. Comparison of changes in lattice misfit with temperature from (a) experimental XRD measurements [Citation92], (b) empirical calculations of lattice constants [Citation70], (c) empirical calculations of lattice constants and thermal expansions coefficients [Citation90], and (d) CALPHAD calculations of molar volumes.
![Figure 4. Comparison of changes in lattice misfit with temperature from (a) experimental XRD measurements [Citation92], (b) empirical calculations of lattice constants [Citation70], (c) empirical calculations of lattice constants and thermal expansions coefficients [Citation90], and (d) CALPHAD calculations of molar volumes.](/cms/asset/ab7b76b2-47f3-4adf-b28f-0f6f40998433/ymst_a_1528733_f0004_oc.jpg)
The influence of temperature on lattice constants for pure nickel and Ni3Al has been reported in the work of Kamara et al. [Citation89] and Reed et al. [Citation6], and is also taken into consideration in the alloy design studies cited above. However, chemical additions will influence not only lattice constants at room temperature, but also thermal expansion coefficients. The most comprehensive studies covering this topic are the empirical model of Sung and Poirier [Citation90], based on experimental data for a range of superalloys, and the phase mixture model of Karunaratne et al. [Citation91]. Both approaches show good agreement with selected literature data, however, prove difficult to be applied more broadly.
A promising and straightforward approach is to obtain lattice constants for the γ and phases from molar volumes calculated by CALPHAD, which accounts for both chemical composition and temperature. As these phases contain four atoms in each unit cell, lattice constants
can be obtained as
, where
is the calculated molar volume of phase j and
is the Avogadro constant.
Unfortunately, when compared to the experimental work of Pyczak et al. [Citation92], none of the approaches discussed above can accurately predict changes in lattice misfit with temperature, as shown in Figure . Pyczak et al. carried out X-ray diffraction (XRD) measurements on a range of rhenium-containing and rhenium-free superalloys and noted an increasingly negative mismatch at higher temperatures for all compositions (Figure (a)). This qualitative trend is reproduced correctly by the misfit formula used by Rettig et al. [Citation70] for alloy design, although quantitative values differ markedly (Figure (b)). Misfit values obtained based on the empirical model of Sung and Poirier [Citation90] (Figure (c)) or based on CALPHAD calculations of molar volumes (Figure (d)) deviate even more from experiments. Lastly, it is interesting to note that all three modelling approaches in Figure (b)–(d) largely predict the same ‘descending order’ of lattice misfit from IN792DS to ExAl8, although this is not in good agreement with XRD results.
3.3. Modelling of damage evolution during tertiary creep
3.3.1. Kinetic creep equation
The derivation of the kinetic creep equation follows the considerations of Dyson [Citation14] and Zhu et al. [Citation15], who identify dislocation accumulation in γ matrix channels and coarsening of precipitates as the main sources of damage. It is acknowledged that strain-induced nucleation and growth of cavities and microcracks will occur in the later stages of creep [Citation18,Citation19]; however, these additional damage mechanisms are omitted in the present model, which focuses on the initial deformation regime up to several percent plastic strain.
In the undeformed state, only a few dislocations are located within γ channels, as represented schematically in Figure . Recent cECCI work by Ram et al. [Citation93] showed conclusively that such isolated dislocations are the main dislocation sources during tertiary creep. Under an applied uniaxial stress, some of them will become active via Frank-Read [Citation94] or double cross-slip mechanisms [Citation95] once a critical shear stress has been reached locally. Low-angle grain boundaries (LAGB) formed as crystal defects during casting [Citation96] also give rise to dislocations; however, these were observed to only percolate a few micrometers away, meaning that LAGBs are not major sources as previously assumed [Citation93].
Newly generated dislocations glide until reaching the nearest particle, where they become arrested at γ/ interfaces. Depending on the local geometry and on the sign of uniaxial stress, a series of climb events through vacancy absorption or vacancy emission are required to overcome precipitates [Citation14]. For the usual case of an applied tensile load, vacancy absorption will take place in ‘vertical’ channels and emission in ‘horizontal’ ones, leading to creep deformation progressing through combined climb/glide events. This situation has been theoretically assessed by Friedel [Citation48] and Hirth and Lothe [Citation49], who derived expressions for the jump frequencies of vacancy-absorbing and vacancy-emitting jogs. These can in turn be combined to yield a net escape frequency under the premise of an equal number of absorption and emission events. The particular rate at which trapped dislocations are released constitutes the core of previous creep models by Dyson [Citation14] and Zhu et al. [Citation15]. However, a linear dependency between creep strain rate and
is debatable, as discussed in Section 2.
In the present work, a different approach is taken by considering relations between (1) effective forces acting on dislocations under the influence of solute drag and (2) average dislocation velocities, for both the climb and the glide step. This approach builds on insights gained from recent DDD studies [Citation55,Citation97,Citation98] and also considers novel experimental work by ur Rehman et al. [Citation61] on quantifying climb and glide drag coefficients in the γ matrix. It is acknowledged that not all theoretical contributions towards the forces acting on dislocation segments are considered [Citation98]. Some sources such as the line tension which minimises the dislocation core energy, the elastic force due to the stress field of the dislocation network, or the osmotic force due to vacancy depletion or supersaturation are too complex in nature to be included in the present model. Furthermore, following the simplified approach proposed by Takeuchi and Argon [Citation99], the same ‘effective stress’ acting on dislocations is assumed for both the climb and the glide step.
The average dislocation velocity can be expressed as , where τ is the effective shear stress, b is the length of the Burgers vector, and B is the drag or friction coefficient [Citation100]. It can be further related to the microscopic shear strain rate,
, via the Orowan equation,
, where
is the total density of mobile dislocations. A few points must be taken into consideration. First, the total density
is composed of the density of climbing dislocations at particle/matrix interfaces,
, and the density of gliding dislocations within matrix channels,
. Second, a distinction must also be made between the average velocities of climbing and gliding dislocations,
and
, owing to different drag coefficients,
and
. Third, the standard Orowan equation cannot be readily applied to precipitate-strengthened materials like superalloys, since to a large extent, deformation is localised within the matrix and precipitates only deform elastically during tertiary creep. This point is addressed by Dyson [Citation14] by considering the necessary load transfer from matrix to particles as plastic creep strain accumulates. Assuming that the elastic moduli of matrix and precipitates are equal, a simple relation between the measured global shear strain rate,
, and the microscopic shear strain rate within the matrix,
, is given by
. The premise that no precipitate shearing occurs is not entirely true; however, TEM and ECCI studies confirm that it is not significant during tertiary creep [Citation18,Citation93]. Finally, following the considerations of Ghosh et al. [Citation101], eight
slip systems will be active during symmetrical loading along the
tensile axis and will have equal Schmid factors of
. Thus, the macroscopically measured creep strain rate,
, can be expressed as
. Overall, we obtain:
(5) Attention should now be given to the effective operating shear stress, τ, resulting from externally applied stress on the one hand, and strengthening mechanisms on the other. Following the considerations of Pollock and Field [Citation18], creep strain rate in the tertiary regime is obtained as:
(6) where
is a material constant,
is the applied stress, and
,
, and
are the respective contributions from Orowan strengthening, solid solution strengthening, and dislocation resistance. Some models also include an additional stress component arising from lattice misfit,
, which is added to the applied stress. As most commercial alloys exhibit negative misfit at high temperatures, this superposition leads to significantly increased deformation in ‘horizontal’ γ matrix channels, perpendicular to the loading direction, and only limited creep in ‘vertical’ channels, parallel to loading [Citation102]. Considering the aforementioned issues regarding ABD calculations of misfit, it is both difficult and open to doubt to incorporate misfit stresses in a model used for alloy design, as incorrect predictions of misfit – and therefore of misfit-induced stress – could lead to faulty conclusions and design rules.
In Equation (Equation6(6) ), the main source of strengthening is the local Orowan resistance of matrix channels, which must be overcome in order to bow dislocations between precipitates. The resolved shear stress required can be expressed as:
(7) where G is the shear modulus, l is the distance between precipitates in
direction, and w is the γ channel width. A small contribution is also provided by dislocation passing stresses and can be approximated for the case of random interactions between dislocations as:
(8) A value of 0.1 is chosen for α, in accordance with references [Citation18,Citation103]. A creep stress exponent, n, is not included in the present model, as such exponents have been shown to only remain constant over a restricted stress and temperature range [Citation31]. As a correction, Dyson [Citation31] derived a more advanced expression for n, in relation to empirical hyperbolic sine functions, as
, with
being a function of temperature,
volume fraction, and Orowan resistance stress. Calculated values for n would normally range between 1 and 2 for nickel-based superalloys, in agreement with the expected dominating mechanism of diffusional climb. Nonetheless, such an expression ultimately does little towards improving the basic understanding of creep deformation [Citation50].
The constraint factor in Equation (Equation6
(6) ) accounts for the additional frictional resistance imposed by non-deforming particles on the matrix, which results in large pressure gradients in γ channels. This factor is discussed in detail by Pollock and Argon [Citation103], who offer an analytical approximation as a function of precipitate side length, d, and channel width, w. Assuming an ideal, unimodal particle distribution like in Figure , the constraint factor can be expressed as depending only on the
volume fraction:
(9) This expression is incorporated readily into the models of Basoalto et al. [Citation13] and Zhu et al. [Citation15]. However, Pollock and Argon [Citation103] debated its general validity, as it leads to values of tensile creep resistance far in excess of experimental estimates. Instead, it appears that as γ channels become populated by a knitted network of dislocations, many of which are lying along γ/
interfaces, some additional sliding will become possible [Citation103]. As such, Pollock and Field put forward a value between 1 and 2 for ζ, depending on the size and shape of
precipitates [Citation18]. Van Sluytman and Pollock [Citation104] discussed how such a factor might vary with
morphology, and in turn with lattice misfit. They predict optimal values can be reached in the range of
. However, since accurate misfit predictions are again required, it is difficult to incorporate a shape- and misfit-dependent factor into the present model.
Furthermore, this resistance from the build-up of pressure gradients due to frictional drag will evolve during the creep test. Dyson [Citation14,Citation31] took ζ to increase from unity to a maximum value of due to stress redistribution around particles and proposed a stochastic approach to describe the evolution of internal stress,
, as:
(10) where
is the upper bound collapse value. An analogue relation to Equation (Equation10
(10) ) is constructed to describe the evolution of ζ with creep strain rate, and the upper bound value of
is chosen as 1.75. This is slightly lower than the initial, ideal estimate of Pollock and Argon from Equation (Equation9
(9) ) and the simple expression of
proposed by Dyson [Citation31], in order to account for imperfect particle shapes and reduced resistance to sliding at particle interfaces.
Equation (Equation5(5) ) for creep strain rate can now be expressed as:
(11)
3.3.2. Effective climb and glide drag coefficients
As a consequence of the substantial levels of solid solution strengthening in modern superalloys – normally maximised up to the limit of TCP phase precipitation [Citation70] – dislocations experience significant drag forces and move through γ channels in a viscous manner [Citation103]. Therefore, the values of the effective climb and glide drag coefficients in Equation (Equation11(11) ),
and
, play a key role in determining creep strain rate.
Early estimates come from the theoretical work of Cottrell and Jawson [Citation105] and Hirth and Lothe [Citation49], who considered gliding dislocations surrounded by an atmosphere of solute atoms at high temperatures. Takeuchi and Argon [Citation99,Citation106] expanded on these results and derived expressions for modelling the effects of viscous drag on climbing and on gliding edge dislocations. In more recent studies, ur Rehman et al. [Citation61] applied the model of Takeuchi and Argon to assess climb and glide resistances in single-crystal binary Ni–X (X=Re,Ta,W) solid solution alloys, while Hafez Haghighat et al. [Citation55] and Liu et al. [Citation98] used similar descriptions as part of DDD simulations of tertiary creep in single-crystal superalloys. The authors of the latter study expressed the drag coefficient for climb as:
(12) where
is the Boltzmann constant,
is the diffusion coefficient of the solute,
is the solute concentration at a theoretically infinite distance from the dislocation, and Ω is the atomic volume of the solvent. Due to the inverse relation between
and
, additions of slow-diffusing elements – particularly molybdenum, rhenium, tantalum, and tungsten for superalloys – will have a profound effect on generating increased drag. Similarly, the drag coefficient for glide was evaluated as [Citation61]:
(13) with factors as defined above. While solute diffusivity again plays an important role, it is supplemented by misfit effects due to differences in the atomic radii of solute and solvent. These are expressed by the size interaction parameter, β, which can be obtained as [Citation99]:
(14) The term
, present in both expressions, is used to define the interaction between dislocations and the solute environment, with
and
being the inner and the outer cut-off radii. Following the considerations of Hirth and Lothe [Citation49],
is equal to the length of the Burgers vector, b, while
depends on the velocity and the diffusivity of the solute as
. However, when this ratio becomes larger than the average distance between dislocations in the crystal – which is the case for densely packed dislocations in matrix channels – it no longer represents a meaningful estimate and must be replaced by an appropriate distance, R [Citation49]. Pollock and Argon [Citation103] used the value of γ channel width, w, as an estimate for R. Considering microstructural coarsening during creep, the term
will increase gradually towards a constant value. As a simplification, we assume this value to be effective throughout the duration of creep tests. Taking w equal to 70 nm as a representative value for the coarsened state [Citation107] yields
, similar to the constant factor of 4.3 first derived by Cottrell and Jawson [Citation105].
So far, only the influence of an individual solute species has been considered. In order to estimate total, effective drag coefficients, we follow the considerations of Reed et al. [Citation6] with regard to dislocation pinning by different types of solute atoms. These authors defined an effective time to circumvent a unit length of pinning atoms as:
(15) Terms
denote the site densities of pinning solute atoms met by the leading segment of the dislocation, while
are the characteristic times of escape, depending on the relative pinning strength of the solutes. The time of escape will scale inversely with average dislocation velocity, and therefore linearly with the drag coefficient, as
. As such, total, effective drag coefficients for climb and for glide can be estimated as:
(16) and
(17) The factor
, with
and
being the mole fraction and the interdiffusion coefficient of solute i, respectively, is identical to the merit index for creep resistance proposed by Reed et al. [Citation6]. For single-crystal superalloys with a similar microstructural architecture – in terms of lattice misfit and
volume fraction – a clear correlation between the Larson–Miller parameter and this merit index has been established [Citation6,Citation56,Citation57]. This correlation was strengthened when the calculated solute mole fraction in the γ matrix,
, was used instead of the mean composition. The same is done in the present study, as it is reasonable to calculate drag coefficients based on the composition of the γ phase.
Interdiffusion coefficients, , are calculated as
. Pre-exponential factors,
, and activation energies pertaining to the interdiffusion process,
, have normally been obtained experimentally using Ni–X diffusion couples. The ample work of Karunaratne et al. [Citation108–111] covered all relevant chemical additions in superalloys with the exception of chromium and cobalt, which had been assessed previously [Citation112,Citation113]. A critical review reveals significant discrepancies between experimental results in different reports and makes it difficult to choose ‘optimal’ values for estimating effective diffusivity [Citation113]. For alloy design purposes, a CALPHAD-based approach using a multicomponent diffusion mobility database, as proposed by Campbell et al. [Citation114], appears more promising. A comparison between experimental and CALPHAD-based results, along with their respective sources, are shown in Table . While most values are in good agreement, it is clear that using experimental rather than CALPHAD-based data will give more weight to tungsten and rhenium additions. It can be argued that CALPHAD-based data will help minimise experimental scatter by considering several sources, as such, values in the ‘CALPHAD’ column are used in the present study.
Table 2. Pre-exponential factors and activation energies for solute diffusion in nickel based on diffusion couple experiments and CALPHAD predictions.
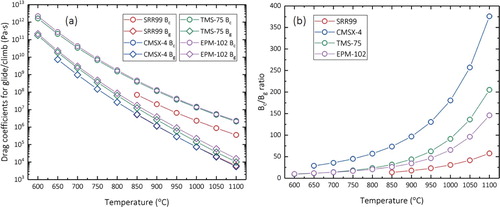
Finally, it is instructive to estimate the ratio at operating temperatures for successive generations of superalloys. This serves both as a sanity check, by comparing these results to usual assumptions in DDD studies, and as a critical assessment of the effects of solid solution strengthening in the present model. Following Zhu et al. [Citation117], the alloys SRR99, CMSX-4, TMS-75, and EPM-102 are taken as representative of first- to fourth-generation superalloys. Their nominal chemical compositions are shown in Table .
Table 3. Nominal chemical compositions of exemplary first- to fourth-generation single-crystal superalloys in wt.%.
Results in Figure (a) show an increase in resistance to dislocation motion in higher-generation superalloys. This trend is related to the rising amounts of slow-diffusing elements, particularly molybdenum, tungsten, and rhenium. However, it is important to consider that although these elements partition preferentially to the γ phase, actual values of the partitioning coefficients , and consequently effective levels of solution strengthening, may differ. Since the climbing step controls the rate of creep strain accumulation, it is of particular importance to increase
rather than
. The plot in Figure (b) reveals to what extent this is achieved for different superalloys. CMSX-4 provides the highest relative level of solution strengthening, benefiting from a favourable partitioning of rhenium to γ. In the case of EPM-102, ruthenium has been added specifically to increase
and limit TCP phase precipitation [Citation120]. This obvious trade-off brings to mind the difficulty of developing new superalloys with improved specific creep strength, as discussed in the introduction. The range of observed
ratios is in good agreement with the commonly assumed constant value of 100 from recent DDD studies [Citation55,Citation61,Citation98].
Figure 5. (a) Estimated drag coefficients for dislocation climb and glide in matrix channels. (b) Estimated ratio of .
3.3.3. Mobile dislocation density
The first type of damage accumulation considered within Equation (Equation11(11) ) is the strain-induced multiplication of mobile dislocations. As discussed in Section 2, most phenomenological models for tertiary creep assume a linear relation for the evolution of mobile dislocation density with increasing creep strain:
(18) where the constant dislocation multiplication parameter,
, is expressed as a multiple of initial dislocation density,
, as
. Depending on the study, the assumed value for K is 50 [Citation9], 300 [Citation14], 67 [Citation13], or 100 [Citation15,Citation31]. A first matter of contention is that such differences in the value of K, albeit relatively small, result in significant changes of predicted time to 1% creep strain [Citation15]. Furthermore, recent DDD studies of tertiary creep deformation in superalloys predict a non-constant value for
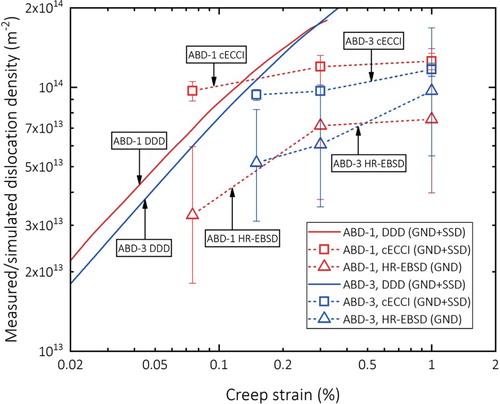
[Citation55,Citation93], as illustrated in Figure . In this graph, DDD simulations are compared to HR-EBSD and cECCI measurements for the second-generation, rhenium-containing superalloy ABD-1 and the first-generation, rhenium-free superalloy ABD-3 under deformation conditions of 900°C and 450 MPa. Results consistently show a strong initial increase in
at low plastic strain values, followed by an exponential decrease as more creep strain accumulates [Citation55,Citation93]. Furthermore, despite the differences in
volume fraction and level of solid solution strengthening, similar trends are observed for both alloys. This change in dislocation density with creep strain can be described using the fundamental equation proposed by Gilman [Citation121] for the dependence of mobile dislocation density on the plastic shear strain in crystalline solids:
(19) Here, M is a multiplication parameter leading to an initial rise in mobile dislocation density, and φ is an attrition parameter which expresses the exponential decay over time. Equation (Equation19
(19) ) was used successfully to describe the creep response of single-crystal CMSX-4 specimens in the tertiary and rafting regimes [Citation122,Citation123]. Based on values obtained from fitting to experimental results, these authors concluded that M increases exponentially with applied stress and that φ depends on crystal orientation and appears to scale inversely with applied stress. Approaches for estimating M and φ are discussed in more detail in Sections 4.1 and 4.2.
Figure 6. Evolution of dislocation density with plastic creep strain for the single-crystal superalloys ABD-1 and ABD-3 deformed at 900°C and 450 MPa. DDD simulation results are compared to experimental values from HR-EBSD and cECCI analyses and show good overall agreement.
For small strain values – as is the case for common design targets of nickel-based superalloys – it follows that:
(20)
As the present model differentiates between climbing and gliding dislocations, their mobile densities must be treated separately. Following the considerations of Dyson [Citation14], slightly modified by Zhu et al. [Citation15] for cuboidal rather than spherical precipitates, the change in the net rate of climbing dislocations can be expressed as:
(21) with all terms as defined previously. This change is obtained as the sum of the rate at which trapped climbing dislocations are released from
precipitate interfaces and the rate at which gliding dislocations become temporarily arrested at the next particle. The half of the cuboid side length, d/2, and the channel width, w, are assumed to be the average distances that dislocations must overcome in each step [Citation15]. Furthermore, the likelihood of climbing dislocations escaping depends on their probability of encountering a particle in the first place, which is taken to be equal to
[Citation14]. As climbing and gliding dislocation densities are codependent, the change in the net rate of gliding dislocations can be obtained as:
(22) Manonukul et al. [Citation12] discussed the inclusion of two further terms in Equation (Equation22
(22) ) to account for changes in the net rate of pinned dislocations,
, arising from individual dislocations being immobilised by the dislocation network and from thermally activated network recovery. However, as argued by these authors, the rate of climbing dislocations can be assumed to dominate the rate of pinning,
, therefore
can be neglected.
Finally, initial values must be chosen for and
. Considering ECCI and TEM results, it can be assumed that all mobile dislocations will begin by gliding through γ channels once an external load has been applied. As such, we take
and
. An often cited value for
in the literature has been 1010 m−2 [Citation12–15], though none of these authors provide a clear source for this estimate. Similarly, Preußner et al. [Citation124] chose an initial value of 5×10¹⁰ m−2. An early TEM study of dislocation densities in cast superalloys does indeed mention densities as low as 1010 m−2 for the undeformed state [Citation125], and this value is also in accordance with the estimate of Hull and Bacon [Citation100] for as-cast crystals. Nonetheless, as the choice of this value will severely impact model results [Citation15], and as the material undergoes further processing and machining steps prior to testing, a careful consideration is essential. Recent HR-EBSD and cECCI studies [Citation93] yielded a dislocation density of 5×10¹¹ m−2 in the undeformed regions of machined creep specimens. As such, in the present work, a figure of 1011 m−2 is considered more representative of the initial microstructure prior to creep testing.
3.3.4. precipitate coarsening
The second type of damage considered is the thermally induced coarsening of precipitates. The fundamental equation for competitive particle growth can be expressed as:
(23) Here,
and
represent average particle sizes at times t and 0. The exponent n is characteristic for the dominating coarsening mechanism and takes a value of 2 for interface-controlled reactions and of 3 for diffusion-controlled reactions. The latter case corresponds to the widely applied Lifshitz–Slyozow–Wagner (LSW) theory [Citation126,Citation127] for diffusion-controlled Ostwald ripening. Coarsening in modern nickel-based superalloys can be accurately described by Equation (Equation23
(23) ), with n=3 and
, where d is the average side length of
cuboids [Citation128]. The key parameter defining coarsening rate is k, and the way in which it is estimated remains a matter of contention between different theories. An ample discussion of this point can be found in the reviews by Baldan [Citation128,Citation129] on the progress in Ostwald ripening theories and on their application to
precipitates in nickel-based superalloys. A similar analysis is beyond the scope of the present work, nonetheless, it is important to carefully choose the method of calculating k, as particle coarsening and the corresponding increase in particle spacing will have a significant effect on creep resistance.
All coarsening theories developed for nickel-based superalloys express k as having the form:
(24) Here,
is a dimensionless proportionality factor,
is the effective diffusion coefficient,
is the matrix concentration of the constitutive particle element,
is the interfacial energy between matrix and particles, and Ω is the molar volume of the precipitate. Different methods of estimating
,
,
, and Ω have been proposed in the literature.
The LSW theory assumes a negligible precipitate volume fraction and obtains from theoretical considerations . Later studies argued that k should scale with
and provided different analytical or numerical approaches to estimate
. McLean [Citation130] compared the LSW theory with the modified LSW (MLSW) theory of Ardell et al. [Citation131–133], the Lifshitz–Slyozov encounter modified (LSEM) theory of Davies et al. [Citation134], and the Brailsford–Wynblatt (BW) theory [Citation135] and compiled a table of
values for different
volume fractions, reproduced in Table . Six additional theories, each yielding somewhat different results, have been reviewed and discussed by Baldan [Citation129]. Considering all these discrepancies, it can be concluded that no single theory is optimal and that each will be more or less effective depending on the alloy system and the coarsening conditions involved. Furthermore, while numerical approaches provide certain improvements, for example, by reproducing realistic particle size distributions, they also require extensive computational resources, which remains prohibitive for alloy design purposes.
Table 4. Comparison of proportionality factors estimated by different coarsening theories.
In the present work, four analytical methods of calculating the coarsening rate coefficient k are compared to experimental results. These are the standard LSW theory, the MLSW theory, the LSW-type theory of Li et al. [Citation136], and the MLSW-type theory of Ai et al. [Citation137]. The latter two methods have been developed primarily to help guide the development and design of new nickel-based superalloys and include estimates of ,
,
,
, and Ω depending on alloy composition and temperature. For the LSW and the MLSW theories, these factors must still be evaluated. Following Ai et al. [Citation137],
for the MLSW theory is estimated with a polynomial as
. For both theories,
is obtained following Reed et al. [Citation6] as
, analogue to the calculations described in the section on effective drag coefficients.
represents the matrix concentration of the rate-controlling element. According to McLean [Citation130], aluminium is likely to be rate-controlling for both Ni3Al and Ni3(Al,Ti). The increasing amounts of slower-diffusing tantalum in modern alloys may, however, affect
for Ni3(Al,Ti,Ta). As such,
is taken as the sum of the matrix concentrations of aluminium, titanium, and tantalum, following Li et al. [Citation136]. Lastly,
and Ω are estimated from CALPHAD calculations using Thermo-Calc and the associated databases TCNi8 and MOBNi3.
Experimental data for testing the models were selected to cover the first three superalloy generations and include results on first-generation CMSX-2 exposed between 800 and 1050°C [Citation138], on second-generation CMSX-4 exposed between 850 and 1000°C [Citation107], and on third-generation CMSX-10 exposed at 950 and 1050°C [Citation139]. This data set allows to check whether theories correctly reproduce the beneficial effects of increased rhenium additions, as this slow-diffusing element has been shown to play a key role in reducing , and in turn k [Citation140,Citation141]. Results in Figure show that the MLSW theory and the approaches of Ai et al. and Li et al. increasingly overestimate k. This observation is in accordance with the critical review by McLean [Citation130], who concluded that neither particle shape, nor volume fraction appear to have an obvious effect on k, implying that the factor
can be largely neglected. The standard LSW theory slightly underestimates k. As such, a slight correction as provided by the LSEM theory would be beneficial but remains challenging to implement due to the associated computational cost.
Figure 7. Comparison of experimental coarsening rate coefficients with model predictions from (a) LSW [Citation126,Citation127], (b) MLSW [Citation132], (c) Ai et al. [Citation137], and (d) Li et al [Citation136].
![Figure 7. Comparison of experimental coarsening rate coefficients with model predictions from (a) LSW [Citation126,Citation127], (b) MLSW [Citation132], (c) Ai et al. [Citation137], and (d) Li et al [Citation136].](/cms/asset/6e2daa25-c29b-49f1-ba73-42057150a542/ymst_a_1528733_f0007_oc.jpg)
Equations (Equation11(11) ), (Equation21
(21) ), (Equation22
(22) ) and (Equation24
(24) ) now represent a set of physically based constitutive equations describing the evolution of creep strain rate based on strain-induced mobile dislocation multiplication and thermally induced precipitate coarsening. An amended version of the process flow diagram from Figure which includes these relations is presented in Figure . Assumed microstructural parameters are summarised in the inset table. The set of differential equations can be integrated using standard finite difference methods to yield the full shape of the creep curve. This in turn can be compared to experimental results to validate the present model.
Figure 8. Process flow diagram including explicit constitutive equations and microstructural parameters used in the present model.
4. Critical appraisal of model predictions
4.1. Predictions of tertiary creep in CMSX-4
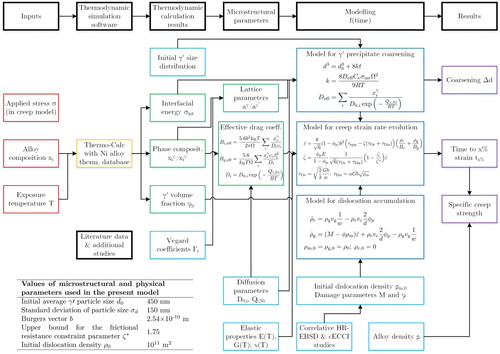
Model predictions are first compared to an experimental creep data set for CMSX-4 [Citation123,Citation142], which includes a wide range of testing conditions over which the model can be assessed. As shown in Figure , experimental results are closely reproduced by the present model. Predictions for time to 1% strain – often used as a design parameter for turbine blade applications [Citation143] – are close to measured values. Only two parameters were varied in order to achieve good agreement – the coefficients for dislocation multiplication and attrition, M and φ, in Equation (Equation20(20) ).
Figure 9. Comparison of simulated creep curves with experimental data for CMSX-4 at (a) 850°C, (b) 900°C, (c) 950°C, and (d) 1000°C.
As discussed by Reed et al. [Citation122], the exponential decrease will be more pronounced in the high-temperature rafting regime. This higher value of φ has been related to additional hardening provided by the rafted microstructure, which traps dislocations in the γ matrix channels. In the case of CMSX-4, rafting can be expected to begin playing a role at 950°C and to become dominant at 1000°C [Citation1]. In the present model, φ was taken to be equal to 225 at 850 and 900°C and equal to 1500 at 950 and 1000°C. The former value of 225 corresponds to the attrition parameter obtained by Ram et al. [Citation93] from DDD simulations of tertiary creep in single-crystal superalloy ABD-1 deformed at 900°C and 450 MPa. The latter value of 1500 was chosen based on the attrition parameters derived by Reed et al. [Citation122] from creep tests on CMSX-4 at 1050°C. These figures are assumed to remain constant for the duration of the creep tests for the sake of simplicity. However, the magnitude of operating dislocation attrition mechanisms is expected to fluctuate with changes in alloy microstructure, which will result in varying levels of resistance to dislocation movement [Citation122].
4.2. On the increase in mobile dislocation density
Values of the dislocation multiplication parameter, M, obtained from fitting to experimental data for CMSX-4 are illustrated in Figure . Furthermore, a data point obtained from DDD simulation results for ABD-1 deformed at 900°C and 450 MPa has been added [Citation93]. As ABD-1 and CMSX-4 possess similar chemistries and microstructures, comparable rates of dislocation multiplication can be expected. Although the M value from DDD will be strongly influenced by assumptions and restrictions pertaining to this modelling technique, it is nonetheless interesting to note that it is in good agreement with the inferred values for CMSX-4, which gives further confidence in the present approach.
Figure 10. Dislocation multiplication parameters obtained from fitting to experimental data for CMSX-4 plotted against applied stress. A value obtained from DDD simulations of ABD-1 deformed at 900°C and 450 MPa has also been added [Citation93].
![Figure 10. Dislocation multiplication parameters obtained from fitting to experimental data for CMSX-4 plotted against applied stress. A value obtained from DDD simulations of ABD-1 deformed at 900°C and 450 MPa has also been added [Citation93].](/cms/asset/69047bdc-bf4c-4814-8d37-ca1315fe630a/ymst_a_1528733_f0010_oc.jpg)
Results also confirm the trend reported by Matan et al. [Citation122,Citation142] that the rate of dislocation multiplication increases exponentially with applied stress. Furthermore, the stress exponent in a relation of the form appears to depend on the dominating damage mechanism – in this case, intermediate-temperature dislocation climb at particle interfaces or high-temperature precipitate rafting. In the tertiary regime, a pronounced dependence on applied stress is found at both 850 and 900°C, whereas in the rafting regime at 950 and 1000°C, applied stress plays a lesser role. This is in line with the expectation that the coarsening rate, dictated primarily by temperature, will control deformation rates for rafting.
Quantitative values for and n lack a clear physical meaning, as it has not yet been determined when isolated dislocation sources become active dislocation emitters, nor by which mechanism this occurs. Moreover, previous studies on the influence of stress and temperature on M, and in turn on
, in superalloys have only reported the observed trends, but have not discussed these in a physical sense [Citation55,Citation122,Citation142]. For the case of low-temperature plasticity governed by continuous dislocation glide, Kocks et al. [Citation144,Citation145] derived a function of the form:
(25) where α is a constant on the order of unity. It is acknowledged that this simplified relation cannot be readily extended to the present case of a complex engineering material deformed at high temperatures. Nonetheless, it suggests a clear dependence of
and M on applied stress, as shown in Figure . The influence of temperature can be related to a lower shear modulus, G, at higher temperatures.
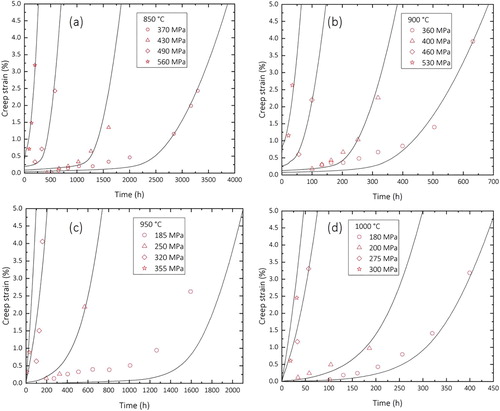
4.3. Model sensitivity analysis
While model predictions appear reasonable, it is essential to assess their sensitivity to individual parameters. Figure shows simulated creep curves for CMSX-4 at the common design point of 900°C and 400 MPa. In each case, a different parameter is varied while keeping the others constant: (a) volume fraction,
, (b) initial mean particle size,
, (c) dislocation multiplication parameter, M, and (d) dislocation attrition parameter, φ.
Figure 11. Assessment of the influence of microstructural parameters on the creep performance of CMSX-4 at 900°C and 400 MPa: (a) volume fraction, (b) initial
mean particle size, (c) dislocation multiplication parameter, and (d) dislocation attrition parameter.
In Figure (a), results for the volume fraction predicted by Thermo-Calc and TCNi8 for CMSX-4 at 900°C, 64.3%, are compared to volume fractions 2% lower and higher. Creep performance is very sensitive to slight changes in fraction. This is in good agreement with the work of Murakumo et al. [Citation146,Citation147] on tie-line single-crystal superalloys. These authors obtained the longest creep lives at 900°C and 392 MPa for 70%
alloys and associated this with an increasing Orowan resistance provided by narrower matrix channels, in line with Equation (Equation7
(7) ).
The same qualitative trend can be observed in Figure (b) for different initial particle size distributions. In this case, the standard deviation of 150 nm was kept constant and only the mean particle size was varied from 450 to 350 and to 550 nm. These distributions were again estimated through histograms containing 5 bins with an equal bin width of 100 nm. As expected, Orowan resistance and creep strength are increased by smaller particles. However, three caveats must be pointed out. First, decreasing initial size becomes increasingly difficult in industrial practice, as it requires higher cooling rates after the solutioning heat treatment, which can result in damaged turbine blades. Second, for most modern superalloys which possess a small, negative lattice mismatch at high temperatures, a decreasing particle size will eventually result in a shape change from cuboidal to spherical particles, which will lower creep strength [Citation58,Citation60]. Third, the importance of initial particle size and of coarsening damage decreases as creep testing conditions become less severe. During isothermal service conditions, all coarsening curves will converge on a certain asymptotic particle size regardless of initial values [Citation27,Citation148]. As such, it can be argued that while it remains important to consider for modelling laboratory creep results, this value is of less importance for industrial purposes.
Figure (c,d) reveals an equivalent trend with regard to the evolution of mobile dislocation density, as described by Equation (Equation20(20) ). Creep life is extended as the multiplication parameter, M, increases, or as the attrition parameter, φ, decreases. This observation appears counterintuitive, since a rapid increase in the net rate of mobile dislocations is commonly expected to lead to higher strain rates [Citation13–15]. However, this can be rationalised by considering Equations (Equation21
(21) ) and (Equation22
(22) ), which describe the net rates of climbing and gliding dislocations, and also the experimental results of Ram et al. [Citation93]. These authors showed that the activation of several individual dislocation sources at low levels of creep strain will result in ‘dislocation avalanches’ within γ matrix channels and, eventually, in the formation of stable, equilibrium dislocation networks. For higher values of M, this drastic surge will be more pronounced and will first lead to a higher initial net rate of gliding dislocations,
, in Equation (Equation22
(22) ). Second, this also implies a higher initial density of dislocations gliding through the matrix,
, which will then become arrested at particle interfaces. Third, following Equation (Equation21
(21) ), this will increase the initial net rate of climbing dislocations,
, and their density,
. Fourth, the higher value of
will produce a strong negative feedback effect in Equation (Equation22
(22) ) and will outweigh the positive term for the generation of new gliding dislocations, dictated by M. Finally, this effect will markedly reduce the net rate of gliding dislocations, thus inducing an equilibrated state. A lower value of φ will have the same qualitative effect. Overall, this situation can be compared to other physical or biological systems which strive towards a state of equilibrium or homeostasis. In the present work, a higher value of M or lower value of φ will bring about this equilibrium more rapidly by, counterintuitively, causing more damage in very early stages.
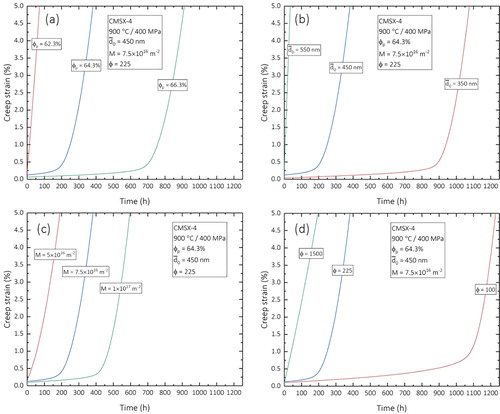
Finally, it is critical to examine whether the model can reproduce the increasing creep performance of later-generation superalloys which contain higher amounts of rhenium. The same four compositions presented in Section 3.3.2 are compared at the design point of 900°C and 400 MPa. All microstructural parameters are chosen to be constant, in order to isolate the effects of chemistry on solid solution strengthening and on the rate of particle coarsening. Thermo-Calc and TCNi8 are first used to calculate γ and phase compositions at 900°C. Individual chemistries are then slightly adjusted to yield the same
volume fraction of 64.3%, while maintaining the predicted phase compositions.
As shown in Figure , creep performance increases as expected in the order SRR99, CMSX-4, TMS-75, and EPM-102. This agrees with experimental results which show significant improvements in creep resistance associated with lower effective diffusivity values and with a retardation of diffusion-controlled deformation mechanisms. However, on the one hand, predicted time to 1% strain is almost identical for SRR99 and CMSX-4, despite the 3 wt.% rhenium additions in the latter. On the other hand, the model underestimates the time to 1% strain for TMS-75 and EPM-102 by about 50%. These discrepancies can be explained by the general inaccuracies associated with CALPHAD calculations and they underline the importance of improving and expanding thermodynamic parameter databases like TCNi8. Nonetheless, alloy performance remains in good qualitative agreement with published data and affirms the usefulness of the present model for alloy design.
Figure 12. Comparison of simulated creep curves at 900°C and 400 MPa for first- to fourth-generation single-crystal superalloys.
5. Discussion: choice of a composition-Dependent creep merit index
One significant goal of the present work is to provide an improved description of creep resistance for use in ABD calculations. In this context, model predictions must be critically assessed for a larger number of compositions and testing conditions. A survey of journal articles, patents, and grey literature yielded around 1500 data points for time to 1% creep strain in different single-crystal superalloys. This set was filtered to include only the tertiary creep regime at intermediate levels of applied stress and temperature, resulting in 265 data points. Upper limits were set at 517 MPa (75 ksi) and 955°C (1750°F), following the results for CMSX-4 shown in Figure . Furthermore, alloys predicted by Thermo-Calc and TCNi8 to exceed a total TCP phase volume fraction of 5% were removed, since the effects of these deleterious phases are not considered in the present work. Previous studies showed that a volume fraction of up to 2% TCP phases is tolerable for shorter creep tests with rupture times in the range of 200 to 300 h [Citation149–151], similar to most tests considered here. However, since Thermo-Calc provides estimates for thermodynamic equilibrium conditions, in which a higher volume fraction of TCP phases is expected, the critical limit was increased to 5%.
In Figure , experimental results are rendered on the x-axes as temperature-compensated time in the form of the Larson–Miller parameter . Under the assumption that the same damage mechanisms are operating in all the tests considered, the ‘merit indices’ or microstructural parameters rendered on the y-axes should provide relative measures of creep resistance and, in principle, should scale with Larson–Miller values.
Figure 13. Comparison between experimentally measured Larson–Miller parameters for time to 1% creep strain and different ‘merit indices’ for creep strength: (a) effective diffusivity index proposed by Reed et al. [Citation6,Citation56], (b) solid solution strengthening index proposed by Rettig et al. [Citation70], (c) yield stress contribution from solid solution strengthening as calculated by Roth et al. [Citation152], (d) volume fraction predicted by Thermo – Calc, (e)
precipitate yield strength as modelled by Crudden et al. [Citation153], and (f) Larson–Miller parameters calculated with the present model.
![Figure 13. Comparison between experimentally measured Larson–Miller parameters for time to 1% creep strain and different ‘merit indices’ for creep strength: (a) effective diffusivity index proposed by Reed et al. [Citation6,Citation56], (b) solid solution strengthening index proposed by Rettig et al. [Citation70], (c) yield stress contribution from solid solution strengthening as calculated by Roth et al. [Citation152], (d) volume fraction predicted by Thermo – Calc, (e) precipitate yield strength as modelled by Crudden et al. [Citation153], and (f) Larson–Miller parameters calculated with the present model.](/cms/asset/035608f7-b436-42ee-8b89-160cd4415ad5/ymst_a_1528733_f0013_oc.jpg)
Previous creep merit indices for alloy design consider a fixed microstructural architecture, with a set volume fraction for all compositions, and neglect coarsening damage. Under this interpretation, creep resistance is primarily dictated by the effective diffusivity controlling climb processes at particle/matrix interfaces. Reed et al. [Citation6,Citation56] proposed the inverse of
as a suitable first-order merit index (Figure (a)). Similarly, Rettig et al. [Citation70] proposed a weighted solid solution strengthening index which takes into account the relative contributions of molybdenum, rhenium, and tungsten in the γ phase, as derived from experiments on binary Ni–X (X=Mo,Re,W) alloys [Citation59] (Figure (b)). When compared to experimental results, neither of these indices appears effective at predicting creep resistance. Rather, data points are clustered together at similar values of the respective index, but are scattered along the x-axes depending on experimental results. A further means of quantifying solid solution strengthening is estimating its contribution towards the total yield stress, as modelled, for example, by Roth et al. [Citation152] (Figure (c)). Although this shows somewhat better correlation with experiments, results again appear clustered in a certain range of this index.
The main reason for the poor performance of these three methods is that the underlying assumption of a constant microstructural architecture does not hold true for the range of commercial compositions compared here, or indeed for the range of microstructures one would like to consider during an alloy design process. Both the volume fraction predicted by Thermo-Calc and TCNi8 (Figure (d)) and the individual strength of
precipitates estimated with the model of Crudden et al. [Citation153] (Figure (e)) show large discrepancies within the data set. It can therefore be concluded that a reasonable estimate of creep resistance can only be achieved by considering all contributing factors.
The degree of correlation between experimental results and the factors considered in Figure is illustrated in the scatter plot matrix of Figure . To account for the highly non-linear relations, Spearman's ρ rank correlation coefficient is chosen instead of Pearson's r correlation coefficient. Spearman's coefficient assesses the measure of statistical dependence between the rankings of two variables and expresses how well their relationship can be described using a monotonic function. It is less sensitive to strong outliers than Pearson's coefficient, since it limits outlier effects to rank values rather than consider actual numerical values. This is beneficial in the present case, as some strong numerical discrepancies may arise from incorrect CALPHAD predictions. Coefficient values are shown in Table . Bold figures indicate correlations significant at the 0.05 level for the experimental results and for the present model.
Figure 14. Scatter plot matrix showing Spearman correlations between experimental results and the six ‘merit indices’ considered previously. The red ellipses indicate 95% confidence levels.
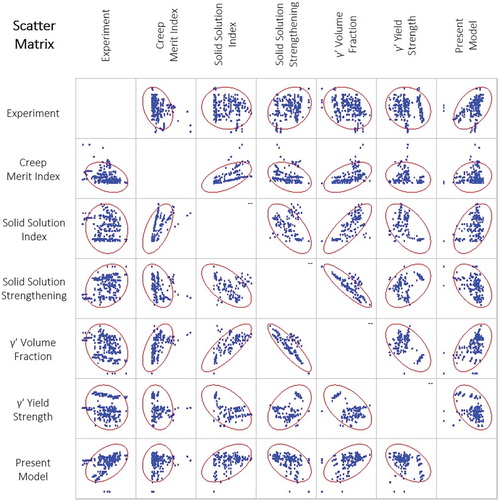
Table 5. Spearman correlation values between experimental results and the six microstructural variables considered previously. Bold coefficient values indicate correlation is significant at the 0.05 level.
Statistical analysis confirms that among the six factors considered, the present model offers the highest degree of correlation with experiments, with a Spearman's ρ of 0.56. The present model also shows positive correlations to the solid solution strengthening index proposed by Rettig et al. and to volume fraction. This is unsurprising considering the importance of retarding diffusion-controlled deformation mechanisms and of decreasing the size of matrix channels. Interestingly, no significant correlation can be found for the model and the creep merit index based on effective diffusivity. The negative correlations between the model and the two factors associated with yield strength bring to mind the necessary trade-offs in alloy design studies, in this case balancing mechanical strength at low and high temperatures.
Overall, results from the present model (Figure (f)) are shown to be in reasonable agreement with experimental results and largely differ by less than one-half of a Larson–Miller parameter. It is acknowledged that the logarithmic term in the Larson–Miller parameter will blur some differences between model and experiments. Nonetheless, unlike other creep merit indices, the model captures the relative performance of commercial compositions and – from a pragmatic point of view – is a suitable benchmark for Alloys-By-Design calculations. Furthermore, the prediction range of one-half of a Larson–Miller parameter is of the same magnitude as the scatter observed in experimental creep datasets due to (1) variations in chemistry between heats, (2) variations in heat treatment between specimen batches, and (3) variations in crystal orientation between individual specimens [Citation154].
Nonetheless, the influence of several inputs and calculated alloy properties on results is assessed in Figure to rationalise some observed discrepancies. Colour scales illustrate across five evenly spaced major levels whether parameters are beneficial (green) or detrimental (red) to creep life. As the colour maps only offer a qualitative indication of the sign and magnitude of these influences, the following approach is taken to also obtain quantitative values. First, a linear relation is assumed between modelling predictions and experimental results of temperature-compensated time, both expressed in the form of the Larson–Miller parameter . Second, residual values are calculated for each data point based on a linear fit. A histogram of residuals and a normal probability plot of residuals are used to check whether the variance is normally distributed. This is found to be the case, as the resulting histogram shows a symmetric bell-shaped distribution around zero and as the normal probability plot is almost linear. Last, residual values are plotted in Figure against several parameters, in complement to Figure .
Figure 15. Qualitative assessment of the influence of creep testing conditions – (a) applied stress and (b) temperature – and calculated material properties – (c) density, (d) volume fraction, (e) coarsening rate parameter, and (f) average metal-d level – on the accuracy of model predictions.
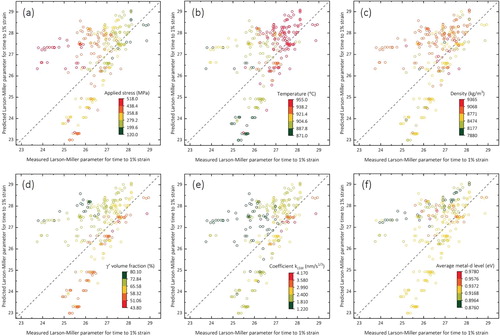
Figure 16. Quantitative residual values, obtained after assuming a linear relation between model predictions and experimental results, plotted against (a) applied stress, (b) density, (c) volume fraction, and (d) coarsening rate parameter.
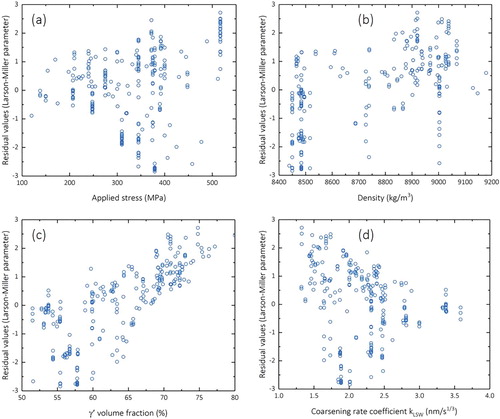
The present model appears to overestimate the performance of alloys tested at the higher-stress/lower-temperature limit of the tertiary creep regime, as shown in Figure (a, b) and Figure (a). Test results at applied stresses above 500 MPa have associated residual values of around to
units of the Larson–Miller parameter, indicating that model predictions of time to 1% creep strain are too high. At these stress levels, shearing of
precipitates becomes feasible [Citation19]. Although this mechanism may not be dominant, it represents an additional source of damage which remains unaccounted for and which explains this overestimation.
Likewise, overpredicted values for volume fraction and/or underpredicted values for the coarsening rate parameter lead to an overestimation of creep life in Figure (d, e) and Figure (c, d). In both cases, residual values are clearly scaling with these parameters. This highlights the importance of extending and improving CALPHAD thermodynamic databases and coarsening models in order to obtain accurate estimates of microstructural evolution at high temperatures for a wide range of alloy compositions.
As further guidance for alloy design studies, the impact of density and of microstructural stability is considered in Figure (c, f). Density is calculated using a corrected rule-of-mixtures approach, which also accounts for bonding characteristics in superalloys [Citation6,Citation56]. For increased performance in service, new alloys must possess higher specific creep strength. This means that the beneficial effects of adding slow-diffusing, but heavy refractory elements like rhenium or tungsten must offset the detrimental effects of higher density and, consequently, of higher stresses arising from centrifugal forces [Citation84]. The average metal-d level, denoted as , provides a basic estimate for the probability of deleterious TCP phase formation. It is calculated with a rule-of-mixtures using the average energy levels of d-orbitals expected for each chemical element from elementary band theory [Citation155,Citation156]. Although it has been established that using a critical cut-off value for
as a design criterion is too simplistic [Citation157], this parameter remains a useful first-order estimate of long-term microstructural stability. In an Alloys-By-Design study, compositions combining high specific creep strength and low
values would be investigated in more detail. Presuming other design requirements – e.g. oxidation resistance, hot corrosion resistance, castability, and cost – are met, these alloys would become candidates for small-scale trial castings and rapid property assessment campaigns.
6. Summary and conclusions
A critical assessment of models for the tertiary creep deformation behaviour of single-crystal superalloys is presented.
With the assumptions that the applied stress is too small to enable
For accurate modelling, it is shown that it is necessary to account for the influence of mean alloy chemistry on microstructural parameters such as
Several methods for calculating coarsening rates in superalloys have been compared. It is shown that using available CALPHAD-based methods, it is possible to accurately estimate both the interfacial energy between the γ and
Effective drag coefficients for dislocation climb and dislocation glide are demonstrated to be important for prediction of the creep strength imparted by slow-diffusing elements. The ratio of these coefficients is in good agreement with values from literature and can be used to rationalise improvements in creep strength of single-crystal superalloys spanning different generations. These advances are ultimately related to a retardation of diffusional flow at
Good agreement of the present model with the performance of the benchmark alloy CMSX-4 is demonstrated, without the use of excessive fitting.
An improved modelling strategy is proposed. One important advantage is the ability to provide reasonable estimates of creep strain life for given applied stress and temperature conditions. A critique using creep data from literature demonstrates that this new approach provides a more accurate merit index for creep resistance, when compared to existing alternatives. It is deemed suitable for alloy optimisation efforts.
Disclosure statement
No potential conflict of interest was reported by the authors.
ORCID
Sabin Sulzer http://orcid.org/0000-0001-6647-3538
Additional information
Funding
References
- Reed RC. The superalloys: fundamentals and applications. Cambridge: Cambridge University Press; 2006.
- Pollock TM, Tin S. Nickel-based superalloys for advanced turbine engines: chemistry, microstructure and properties. J Propulsion Power. 2006;22(2):361–374. doi: 10.2514/1.18239
- Pollock TM. Alloy design for aircraft engines. Nat Mater. 2016;15(8):809–815. doi: 10.1038/nmat4709
- Pint BA, DiStefano JR, Wright IG. Oxidation resistance: one barrier to moving beyond Ni-base superalloys. Mater Sci Eng. 2006;415(1–2):255–263. doi: 10.1016/j.msea.2005.09.091
- Pint BA. High-temperature corrosion in fossil fuel power generation: present and future. JOM. 2013;65(8):1024–1032. doi: 10.1007/s11837-013-0642-z
- Reed RC, Tao T, Warnken N. Alloys-by-design: application to nickel-based single crystal superalloys. Acta Mater. 2009;57(19):5898–5913. doi: 10.1016/j.actamat.2009.08.018
- Dyson BF, McLean M. Particle-coarsening, and tertiary creep. Acta Metallurgica. 1983;31(1):17–27. doi: 10.1016/0001-6160(83)90059-7
- Ion JC, Barbosa A, Ashby MF, et al. The modelling of creep for engineering design. National Physical Laboratory and Division of Materials Applications; 1986.
- Dyson BF, Gibbons TB. Tertiary creep in nickel-base superalloys: analysis of experimental data and theoretical synthesis. Acta Metallurgica. 1987;35(9):2355–2369. doi: 10.1016/0001-6160(87)90083-6
- Barbosa A, Taylor NG, Ashby MF, et al. A model based computer analysis of creep data (Crispen): applications to nickel-base superalloys. In: Reichman S, Duhl DN, Maurer GE, et al., editors. Superalloys 1988. Warrendale (PA): TMS; 1988. p. 683–692.
- Dyson BF, Osgerby S. Modelling and analysis of creep deformation and fracture in a 1 Cr Mo ferritic steel. National Physical Laboratory; 1993. (NPL Report DMM(A)116)
- Manonukul A, Dunne F, Knowles D. Physically-based model for creep in nickel-base superalloy C263 both above and below the gamma solvus. Acta Mater. 2002;50(11):2917–2931. doi: 10.1016/S1359-6454(02)00119-2
- Basoalto H, Sondhi SK, Dyson BF, et al. A generic microstructure-explicit model of creep in nickel-base superalloys. In: Green K, Harada H, Pollock TM, editors. Superalloys 2004. Warrendale (PA): TMS; 2004. p. 897–906
- Dyson BF. Microstructure based creep constitutive model for precipitation strengthened alloys: theory and application. Mater Sci Tech. 2009;25(2):213–220. doi: 10.1179/174328408X369348
- Zhu Z, Basoalto H, Warnken N, et al. A model for the creep deformation behaviour of nickel-based single crystal superalloys. Acta Mater. 2012;60(12):4888–4900. doi: 10.1016/j.actamat.2012.05.023
- Kim YK, Kim D, Kim HK, et al. An intermediate temperature creep model for Ni-based superalloys. Int J Plasticity. 2016;79:153–175. doi: 10.1016/j.ijplas.2015.12.008
- Rae C. Alloys by design: modelling next generation superalloys. Mater Sci Tech. 2009;25(4):479–487. doi: 10.1179/174328408X372056
- Pollock TM, Field RD. Dislocations and high-temperature plastic deformation of superalloy single crystals. In: Nabarro FRN, Duesbery MS, editors. Dislocations in solids. (Dislocations in solids; Vol. 11). Amsterdam and Oxford: Elsevier Science; 2002. p. 547–618.
- Reed RC, Rae CMF. Physical Metallurgy of the Nickel-based superalloys. In: Laughlin DE, Hono K, editors. Physical Metallurgy. Amsterdam, Netherlands: Elsevier; 2014. p. 2215–2290.
- Andrade ENDC. On the Viscous flow in metals, and allied phenomena. Proc R Soc. 1910;84(567):1–12. doi: 10.1098/rspa.1910.0050
- Dorn JE, Shepard LA. What we need to know about creep. In: Frey DN, editor. Symposium on effect of cyclic heating and stressing on metals at elevated temperatures. Philadelphia (PA): ASTM International; 1954. p. 3–28; Its Special technical publication.
- Garofalo F. Fundamentals of creep and creep-rupture in metals. New York: Macmillan; 1965.
- Webster GA, Cox APD, Dorn JE. A relationship between transient and steady-state creep at elevated temperatures. Metal Sci J. 1969;3(1):221–225. doi: 10.1179/msc.1969.3.1.221
- Evans M. Predicting times to low strain for a 1CrMoV rotor steel using a projection technique. J Mater Sci. 2000;35(12):2937–2948. doi: 10.1023/A:1004770525118
- Monden K. Creep life assessment of tin based lead free solders based on the imaginary initial strain rate. In: Thermal and thermomechanical 10th intersociety conference on phenomena in electronics systems, 2006. ITHERM 2006; San Diego, California. p. 990–996.
- Penny RK, Marriott DL. Design for creep. 2nd ed. Dordrecht: Springer; 1995.
- McLean M, Dyson BF. Modeling the effects of damage and microstructural evolution on the creep behavior of engineering alloys. J Eng Mater Technol. 2000;122(3):273. doi: 10.1115/1.482798
- Kachanov LM. Rupture time under creep conditions. Izv Akad Nauk SSSR, Otd Tekh Nauk. 1958;8:26–31.
- Rabotnov YN. Creep problems in structural members. (North-Holland series in applied mathematics & mechanics; Vol. vol.7). Amsterdam: Elsevier Science Publishing Co Inc.; 1969.
- Leckie FA, Hayhurst DR. Constitutive equations for creep rupture. Acta Metallurgica. 1977;25(9):1059–1070. doi: 10.1016/0001-6160(77)90135-3
- Dyson B. Use of CDM in materials modeling and component creep life prediction. J Press Vessel Technol. 2000;122(3):281. doi: 10.1115/1.556185
- Miodownik AP, Li X, Saunders N, et al. Modelling of creep in nickel based superalloys. In: Strang A, Conroy RD, Banks WM, et al., editors. Proceedings of the sixth international Charles Parsons turbine conference. London: Maney; 2003. p. 1–9.
- Oruganti R. A new approach to dislocation creep. Acta Mater. 2012;60(4):1695–1702. doi: 10.1016/j.actamat.2011.11.051
- Altenbach H, Skrzypek JJ, editors. Creep and damage in materials and structures. Vienna: Springer; 1999.
- Basoalto H, Vermeulen B, Brooks JW, et al. A new hyperbolic tangent modelling approach for the creep behavior of the single crystal nickel-based superalloy CMSX4. In: Reed RC, Green KA, Caron P, et al., editors. Superalloys 2008. Warrendale, Pa.: TMS; 2008. p. 515–520.
- Coakley J, Basoalto H, Dye D. Coarsening of a multimodal nickel-base superalloy. Acta Mater. 2010;58(11):4019–4028. doi: 10.1016/j.actamat.2010.03.017
- Coakley J, Dye D, Basoalto H. Creep and creep modelling of a multimodal nickel-base superalloy. Acta Mater. 2011;59(3):854–863. doi: 10.1016/j.actamat.2010.08.035
- Svoboda J, Lukáš P. Model of creep in 001-oriented superalloy single crystals. Acta Mater. 1998;46(10):3421–3431. doi: 10.1016/S1359-6454(98)00043-3
- Svoboda J, Lukáš P. Creep deformation modelling of superalloy single crystals. Acta Mater. 2000;48(10):2519–2528. doi: 10.1016/S1359-6454(00)00078-1
- MacLachlan DW, Knowles DM. Creep-behavior modeling of the single-crystal superalloy CMSX-4. Metal Mater Trans A. 2000;31(5):1401–1411. doi: 10.1007/s11661-000-0258-0
- MacLachlan DW, Wright LW, Gunturi S, et al. Constitutive modelling of anisotropic creep deformation in single crystal blade alloys SRR99 and CMSX-4. Int J Plasticity. 2001;17(4):441–467. doi: 10.1016/S0749-6419(00)00058-9
- Manonukul A, Dunne F, Knowles D, et al. Multiaxial creep and cyclic plasticity in nickel-base superalloy C263. Int J Plasticity. 2005;21(1):1–20. doi: 10.1016/j.ijplas.2003.12.005
- Prasad SC, Rao IJ, Rajagopal KR. A continuum model for the creep of single crystal nickel-base superalloys. Acta Mater. 2005;53(3):669–679. doi: 10.1016/j.actamat.2004.10.020
- Ma A, Dye D, Reed RC. A model for the creep deformation behaviour of single-crystal superalloy CMSX-4. Acta Mater. 2008;56(8):1657–1670. doi: 10.1016/j.actamat.2007.11.031
- Wu R, Zaiser M, Sandfeld S. A continuum approach to combined evolution and dislocation plasticity in nickel-based superalloys. Int J Plasticity. 2017;95:142–162. doi: 10.1016/j.ijplas.2017.04.005
- Oruganti R, Karadge M, Nalawade S, et al. A new approach to modeling of creep in superalloys. In: Huron ES, Reed RC, Hardy MC, et al., editors. Superalloys 2012. John Wiley & Sons; 2012. p. 473–479.
- McVetty PG. Creep of metals at elevated temperatures: the hyperbolic sine relation between stress and creep rate. AIME TRANS. 1943;65:761–769.
- Friedel J. Dislocations. [1st english ed.] (International series of monographs on solid state physics; Vol. 3). Oxford and New York: Pergamon Press; 1964
- Hirth JP, Lothe J. Theory of dislocations. 2nd ed. Malabar (FL): Krieger Pub. Co; 1992.
- Nabarro F. Creep in commercially pure metals. Acta Mater. 2006;54(2):263–295. doi: 10.1016/j.actamat.2005.08.021
- Lagneborg R. Dislocation mechanisms in creep. Int Metal Rev. 1972;17(1):130–146. doi: 10.1179/095066072790137620
- Lagneborg R, Bergman B. The stress/creep rate behaviour of precipitation-hardened alloys. Metal Sci. 1976;10(1):20–28. doi: 10.1179/030634576790431462
- Carry C, Strudel J. Apparent and effective creep parameters in single crystals of a nickel base superalloy – I incubation period. Acta Metallurgica. 1977;25(7):767–777. doi: 10.1016/0001-6160(77)90092-X
- Carry C, Strudel J. Apparent and effective creep parameters in single crystals of a nickel base superalloy – II. secondary creep. Acta Metallurgica. 1978;26(5):859–870. doi: 10.1016/0001-6160(78)90035-4
- Hafez Haghighat SM, Eggeler G, Raabe D. Effect of climb on dislocation mechanisms and creep rates in -strengthened Ni base superalloy single crystals: a discrete dislocation dynamics study. Acta Mater. 2013;61(10):3709–3723. doi: 10.1016/j.actamat.2013.03.003
- Reed RC, Zhu Z, Sato A, et al. Isolation and testing of new single crystal superalloys using alloys-by-design method. Mater Sci Eng. 2016;667:261–278. doi: 10.1016/j.msea.2016.04.089
- Reed RC, Mottura A, Crudden DJ. Alloys-by-design: towards optimization of compositions of nickel-based superalloys. In: Hardy MC, Huron ES, Glatzel U, et al., editors. Superalloys 2016. Hoboken (NJ): John Wiley & Sons, Inc; 2016. p. 13–23.
- Nathal MV. Effect of initial gamma prime size on the elevated temperature creep properties of single crystal nickel base superalloys. Metal Trans A. 1987;18(11):1961–1970. doi: 10.1007/BF02647026
- Fleischmann E, Miller MK, Affeldt E, et al. Quantitative experimental determination of the solid solution hardening potential of rhenium, tungsten and molybdenum in single-crystal nickel-based superalloys. Acta Mater. 2015;87:350–356. doi: 10.1016/j.actamat.2014.12.011
- Caron P, Khan T. Improvement of creep strength in a nickel-base single-crystal superalloy by heat treatment. Mater Sci Eng. 1983;61(2):173–184. doi: 10.1016/0025-5416(83)90199-4
- ur Rehman H, Durst K, Neumeier S, et al. On the temperature dependent strengthening of nickel by transition metal solutes. Acta Mater. 2017;137:54–63. doi: 10.1016/j.actamat.2017.05.038
- Bayerlein U, Sockel HG. Measurements and calculations of the elastic moduli of ODS and cast Ni-based superalloys. Mater Sci Eng. 1991;141(2):179–187. doi: 10.1016/0921-5093(91)90768-I
- Bayerlein U, Sockel HG. Determination of single crystal elastic constants from DS- and DR-Ni-based superalloys by a new regression method between 20C and 1200C. In: MacKay RA, Antolovich SD, Stusrud RW, et al., editors. Superalloys 1992. Warrendale, (PA): TMS; 1992. p. 695–704.
- Siebörger D, Knake H, Glatzel U. Temperature dependence of the elastic moduli of the nickel-base superalloy CMSX-4 and its isolated phases. Mater Sci Eng. 2001;298(1–2):26–33. doi: 10.1016/S0921-5093(00)01318-6
- Morrell R, Ford DA, Harris K. Calculations of modulus in different directions for single-crystal alloys: NPL Report DEPC-MN 004. Teddington, UK: National Physical Laboratory and Division of Materials Applications; 2004.
- Dye D, Coakley J, Vorontsov VA, et al. Elastic moduli and load partitioning in a single-crystal nickel superalloy. Scr Mater. 2009;61(2):109–112. doi: 10.1016/j.scriptamat.2009.03.008
- Mughrabi H. Microstructural aspects of high temperature deformation of monocrystalline nickel base superalloys: some open problems. Mater Sci Technol. 2009;25(2):191–204. doi: 10.1179/174328408X361436
- Mirkin IL, Kancheev OD. Relationship between heat resistance and difference in lattice spacings of phases in precipitation-hardening alloys. Metal Sci Heat Treatment. 1967;9(1):10–13. doi: 10.1007/BF00657546
- Stoloff NS. Fundamentals of strengthening. In: Sims CT, Stoloff NS, Hagel WC, editors. Superalloys II. New York: Wiley; 1987. p. 61–96.
- Rettig R, Ritter NC, Helmer HE, et al. Single-crystal nickel-based superalloys developed by numerical multi-criteria optimization techniques: design based on thermodynamic calculations and experimental validation. Model Simul Mater Sci Eng. 2015;23(3):35004. doi: 10.1088/0965-0393/23/3/035004
- Koizumi Y, Kobayashi T, Yokokawa T, et al. Development of next-generation Ni-base single crystal superalloys. In: Green K, Harada H, Pollock TM, editors. Superalloys 2004. Warrendale (PA): TMS; 2004. p. 35–43.
- Nathal MV, MacKay RA, Garlick RG. Temperature dependence of γ-γ′ lattice mismatch in nickel-base superalloys. Mater Sci Eng. 1985;75(1–2):195–205. doi: 10.1016/0025-5416(85)90189-2
- Zhang JX, Murakumo T, Harada H, et al. Creep deformation mechanisms in some modern single-crystal superalloys. In: Green K, Harada H, Pollock TM, editors. Superalloys 2004. Warrendale (PA): TMS; 2004. p. 189–195.
- Gabb TP, Draper SL, Hull DR, et al. The role of interfacial dislocation networks in high temperature creep of superalloys. Mater Sci Eng. 1989;118:59–69. doi: 10.1016/0921-5093(89)90058-0
- MacKay RA, Nathal MV. γ′ coarsening in high volume fraction nickel-base alloys. Acta Metallurgica et Mater. 1990;38(6):993–1005. doi: 10.1016/0956-7151(90)90171-C
- Zhang JX, Murakumo T, Harada H, et al. Dependence of creep strength on the interfacial dislocations in a fourth generation SC superalloy TMS-138. Scr Mater. 2003;48(3):287–293. doi: 10.1016/S1359-6462(02)00379-2
- Zhang JX, Murakumo T, Koizumi Y, et al. Interfacial dislocation networks strengthening a fourth-generation single-crystal TMS-138 superalloy. Metallurgical Mater Trans A. 2002;33(12):3741–3746. doi: 10.1007/s11661-002-0246-7
- Carroll LJ, Feng Q, Pollock TM. Interfacial dislocation networks and creep in directional coarsened Ru-containing nickel-base single-crystal superalloys. Metallurgical Mater Trans A. 2008;39(6):1290–1307. doi: 10.1007/s11661-008-9520-7
- Hino T, Kobayashi T, Harada H, et al. Development of a new single crystal superalloy for industrial gas turbines. In: Pollock TM, Green K, Kissinger R, editors. Superalloys 2000. Warrendale (PA): TMS; 2000. p. 729–736.
- Harada H, Murakami H. Design of Ni-base superalloys. In: Zunger A, Osgood RM, Hull R, et al., editors. Computational materials design. (Springer series in materials science; Vol. 34). Berlin: Springer; 1999. p. 39–70.
- Yokokawa T, Harada H, Kawagishi K, Quantitative analysis of creep strengthening factors in Ni-base single crystal superalloys. In: Huron ES, Reed RC, Hardy MC, et al., editors. Superalloys 2012. Hoboken, New Jersey: John Wiley & Sons; 2012. p. 285–292.
- Sato A, Yokokawa T, Koizumi Y, et al. A factor analysis of creep rupture properties of Ni-base superalloys. J Japan Inst Metals. 2005;69(8):691–694. doi: 10.2320/jinstmet.69.691
- Yokokawa T, Harada H, Mori Y, et al. Design of next generation Ni-base single crystal superalloys containing Ir: towards 1150 C temperature capability. In: Hardy MC, Huron ES, Glatzel U, et al.,, editors. Superalloys 2016. Hoboken (NJ): John Wiley & Sons, Inc; 2016. p. 123–130.
- Caron P. High γ′ solvus new generation nickel-based superalloys for single crystal turbine blade applications. In: Pollock TM, Green K, Kissinger R, editors. Superalloys 2000. Warrendale (PA): TMS; 2000. p. 737–746.
- Watanabe R, Kuno T. Alloy design of nickel-base precipitation hardened superalloys. Tetsu-to-Hagane. 1975;61(9):2274–2294. doi: 10.2355/tetsutohagane1955.61.9_2274
- Mishima Y, Ochiai S, Suzuki T. Lattice parameters of Ni(γ), Ni3Al(γ′) and Ni3Ga(γ′) solid solutions with additions of transition and B-subgroup elements. Acta Metallurgica. 1985;33(6):1161–1169. doi: 10.1016/0001-6160(85)90211-1
- Nash P. Phase diagrams of binary nickel alloys. Materials Park (OH): ASM International; 1991.
- Kablov EN, Petrushin NV, Bronfin MB, et al. Specific features of rhenium-alloyed single-crystal nickel superalloys. Russian Metallurgy (Metally). 2006;2006(5):406–414. doi: 10.1134/S0036029506050089
- Kamara AB, Ardell AJ, Wagner CNJ. Lattice misfits in four binary Ni-base alloys at ambient and elevated temperatures. Metallurgical Mater Trans A. 1996;27(10):2888–2896. doi: 10.1007/BF02663837
- Sung P, Poirier D. Estimation of densities and coefficients of thermal expansion of solid Ni-base superalloys. Mater Sci Eng. 1998;245(1):135–141. doi: 10.1016/S0921-5093(97)00699-0
- Karunaratne MSA, Kyaw S, Jones A, et al. Modelling the coefficient of thermal expansion in Ni-based superalloys and bond coatings. J Mater Sci. 2016;51(9):4213–4226. doi: 10.1007/s10853-015-9554-3
- Pyczak F, Devrient B, Mughrabi H. The effects of different alloying elements on the thermal expansion coefficients, Lattice constants and misfit of nickel-based superalloys investigated by X-ray diffraction. In: Green K, Harada H, Pollock TM, editors. Superalloys 2004. Warrendale (PA): TMS; 2004. p. 827–836.
- Ram F, Li Z, Zaefferer S, et al. On the origin of creep dislocations in a Ni-base, single-crystal superalloy: An ECCI, EBSD, and dislocation dynamics-based study. Acta Mater. 2016;109:151–161. doi: 10.1016/j.actamat.2016.02.038
- Frank FC, Read WT. Multiplication processes for slow moving dislocations. Phys Rev. 1950;79(4):722–723. doi: 10.1103/PhysRev.79.722
- Koehler JS. The nature of work-hardening. Phys Rev. 1952;86(1):52–59. doi: 10.1103/PhysRev.86.52
- D'Souza N, Newell M, Devendra K, et al. Formation of low angle boundaries in Ni-based superalloys. Mater Sci Engi. 2005;413–414:567–570. doi: 10.1016/j.msea.2005.08.188
- Danas K, Deshpande VS. Plane-strain discrete dislocation plasticity with climb-assisted glide motion of dislocations. Model Simul Mater Sci Eng. 2013;21(4):045008. doi: 10.1088/0965-0393/21/4/045008
- Liu B, Raabe D, Roters F, et al. Interfacial dislocation motion and interactions in single-crystal superalloys. Acta Mater. 2014;79:216–233. doi: 10.1016/j.actamat.2014.06.048
- Takeuchi S, Argon AS. Steady-state creep of alloys due to viscous motion of dislocations. Acta Metallurgica. 1976;24(10):883–889. doi: 10.1016/0001-6160(76)90036-5
- Hull D, Bacon DJ. Introduction to dislocations. 5th ed. Oxford: Butterworth-Heinemann; 2011.
- Ghosh RN, Curtis RV, McLean M. Creep deformation of single crystal superalloys–modelling the crystallographic anisotropy. Acta Metallurgica et Mater. 1990;38(10):1977–1992. doi: 10.1016/0956-7151(90)90309-5
- Kuhn HA, Biermann H, Ungár T, et al. An X-ray study of creep-deformation induced changes of the lattice mismatch in the -hardened monocrystalline nickel-base superalloy SRR 99. Acta Metallurgica et Mater. 1991;39(11):2783–2794. doi: 10.1016/0956-7151(91)90095-I
- Pollock TM, Argon AS. Creep resistance of CMSX-3 nickel base superalloy single crystals. Acta Metallurgica et Mater. 1992;40(1):1–30. doi: 10.1016/0956-7151(92)90195-K
- van Sluytman JS, Pollock TM. Optimal precipitate shapes in nickel-base γ– alloys. Acta Mater. 2012;60(4):1771–1783. doi: 10.1016/j.actamat.2011.12.008
- Cottrell AH, Jaswon MA. Distribution of solute atoms round a slow dislocation. Proc R Soc A. 1949;199(1056):104–114. doi: 10.1098/rspa.1949.0128
- Takeuchi S, Argon AS. Glide and climb resistance to the motion of an edge dislocation due to dragging a Cottrell atmosphere. Philos Mag A. 1979;40(1):65–75. doi: 10.1080/01418617908234833
- Lapin J, Gebura M, Pelachova T, et al. Coarsening kinetics of cuboidal gamma prime precipitates in single crystal nickel base superalloy CMSX-4. Kovove Mater. 2008;46(6):313–322.
- Karunaratne M, Carter P, Reed RC. Interdiffusion in the face-centred cubic phase of the Ni–Re, Ni–Ta and Ni–W systems between 900 and 1300 C. Mater Sci Engi. 2000;281(1–2):229–233. doi: 10.1016/S0921-5093(99)00705-4
- Karunaratne M, Carter P, Reed RC. On the diffusion of aluminium and titanium in the Ni-rich Ni–Al–Ti system between 900 and 1200 C. Acta Mater. 2001;49(5):861–875. doi: 10.1016/S1359-6454(00)00390-6
- Karunaratne M, Reed RC. Interdiffusion of the platinum-group metals in nickel at elevated temperatures. Acta Mater. 2003;51(10):2905–2919. doi: 10.1016/S1359-6454(03)00105-8
- Karunaratne M, Reed RC. Interdiffusion of niobium and molybdenum in nickel between 900-1300°C. Defect Diffusion Forum. 2005;237-240:420–425.
- Ustad T, Sørum H. Interdiffusion in the Fe–Ni, Ni–Co, and Fe–Co systems. Phys Status Solidi (a). 1973;20(1):285–294. doi: 10.1002/pssa.2210200129
- Jung SB, Yamane T, Minamino Y, et al. Interdiffusion and its size effect in nickel solid solutions of Ni-Co, Ni-Cr and Ni-Ti systems. J Mater Sci Lett. 1992;11(20):1333–1337. doi: 10.1007/BF00729354
- Campbell C, Boettinger W, Kattner U. Development of a diffusion mobility database for Ni-base superalloys. Acta Mater. 2002;50(4):775–792. doi: 10.1016/S1359-6454(01)00383-4
- Liu XJ, Hu HH, Han JJ, et al. Assessment of the diffusional mobilities in fcc Ni–Nb and fcc Ni–Mo alloys. Calphad. 2012;38:140–145. doi: 10.1016/j.calphad.2012.05.003
- Liu XJ, Lin JY, Lu Y, et al. Assessment of the atomic mobility for the fcc phase of Ni–Co–X (X=Re and Ru) system. Calphad. 2014;45:138–144. doi: 10.1016/j.calphad.2013.12.003
- Zhu J, Holcomb GR, Jablonski PD, et al. Subsurface characterization of an oxidation-induced phase transformation and twinning in nickel-based superalloy exposed to oxy-combustion environments. Mater Sci Eng. 2012;550:243–253. doi: 10.1016/j.msea.2012.04.066
- Ford DA, Arthey RP. Development of single crystal alloys for specific engine applications. In: Gell M, Kortovich CS, Bricknell RH, editors. Superalloys 1984. Warrendale (PA): TMS; 1984. p. 115–124.
- Harris K, Erickson GL, Sikkenga SL, Development of the rhenium containing superalloys CMSX-4 & CM 186 LC for single crystal blade and directionally solidified vane applications in advanced turbine engines. In: MacKay RA, Antolovich SD, Stusrud RW, et al., editors. Superalloys 1992. Warrendale (PA): TMS; 1992. p. 297–306.
- Walston S, Cetel A, MacKay R, et al. Joint development of a fourth generation single crystal superalloy. In: Green K, Harada H, Pollock TM, editors. Superalloys 2004. Warrendale (PA): TMS; 2004. p. 15–24.
- Gilman JJ. Microdynamics of plastic flow at constant stress. J Appl Phys. 1965;36(9):2772–2777. doi: 10.1063/1.1714577
- Reed RC, Matan N, Cox D, et al. Creep of CMSX-4 superalloy single crystals: effects of rafting at high temperature. Acta Mater. 1999;47(12):3367–3381. doi: 10.1016/S1359-6454(99)00217-7
- Matan N, Cox DC, Carter P, et al. Creep of CMSX-4 superalloy single crystals: effects of misorientation and temperature. Acta Mater. 1999;47(5):1549–1563. doi: 10.1016/S1359-6454(99)00029-4
- Preußner J, Rudnik Y, Brehm H, et al. A dislocation density based material model to simulate the anisotropic creep behavior of single-phase and two-phase single crystals. Int J Plasticity. 2009;25(5):973–994. doi: 10.1016/j.ijplas.2008.04.006
- Gibbon TB, HendersonBrown M. Dislocation densities in Ni-Cr-base alloys. Scripta Metallurgica. 1975;9(1):15–16. doi: 10.1016/0036-9748(75)90138-6
- Lifshitz IM, Slyozov VV. The kinetics of precipitation from supersaturated solid solutions. J Phys Chem Solids. 1961;19(1–2):35–50. doi: 10.1016/0022-3697(61)90054-3
- Wagner C. Theorie der Alterung von Niederschlägen durch Umlösen (Ostwald–Reifung). Zeitschrift für Elektrochemie, Berichte der Bunsengesellschaft für physikalische Chemie. 1961;65(7–8):581–591.
- Baldan A. Review Progress in Ostwald ripening theories and their applications to the -precipitates in nickel-base superalloys: part II nickel-base superalloys. J Mater Sci. 2002;37(12):2379–2405. doi: 10.1023/A:1015408116016
- Baldan A. Review progress in Ostwald ripening theories and their applications to nickel-base superalloys: part I: Ostwald ripening theories. J Mater Sci. 2002;37(11):2171–2202. doi: 10.1023/A:1015388912729
- McLean D. Predicting growth of γ′ in nickel alloys. Metal Sci. 1984;18(5):249–256. doi: 10.1179/030634584790420113
- Ardell AJ. An application of the theory of particle coarsening: the precipitate in Ni-Al alloys. Acta Metallurgica. 1968;16(4):511–516. doi: 10.1016/0001-6160(68)90125-9
- Ardell A. The effect of volume fraction on particle coarsening: theoretical considerations. Acta Metallurgica. 1972;20(1):61–71. doi: 10.1016/0001-6160(72)90114-9
- Chellman D, Ardell A. The coarsening of γ′ precipitates at large volume fractions. Acta Metallurgica. 1974;22(5):577–588. doi: 10.1016/0001-6160(74)90155-2
- Davies C, Nash P, Stevens RN. The effect of volume fraction of precipitate on Ostwald ripening. Acta Metallurgica. 1980;28(2):179–189. doi: 10.1016/0001-6160(80)90067-X
- Brailsford A, Wynblatt P. The dependence of Ostwald ripening kinetics on particle volume fraction. Acta Metallurgica. 1979;27(3):489–497. doi: 10.1016/0001-6160(79)90041-5
- Li X, Saunders N, Miodownik AP. The coarsening kinetics of particles in nickel-based alloys. Metallurgical Mater Trans A. 2002;33(11):3367–3373. doi: 10.1007/s11661-002-0325-9
- Ai C, Zhao X, Zhou J, et al. Application of a modified Ostwald ripening theory in coarsening of phases in Ni based single crystal superalloys. J Alloys Compd. 2015;632:558–562. doi: 10.1016/j.jallcom.2015.01.215
- Ges AM, Fornaro O, Palacio HA. Coarsening behaviour of a Ni-base superalloy under different heat treatment conditions. Mater Sci Eng. 2007;458(1–2):96–100. doi: 10.1016/j.msea.2006.12.107
- Acharya M, Fuchs G. The effect of long-term thermal exposures on the microstructure and properties of CMSX-10 single crystal Ni-base superalloys. Mater Sci Eng. 2004;381(1–2):143–153. doi: 10.1016/j.msea.2004.04.001
- Yoon KE, Noebe RD, Seidman DN. Effects of rhenium addition on the temporal evolution of the nanostructure and chemistry of a model Ni–Cr–Al superalloy. I: experimental observations. Acta Mater. 2007;55(4):1145–1157. doi: 10.1016/j.actamat.2006.08.027
- Yoon KE, Noebe RD, Seidman DN. Effects of rhenium addition on the temporal evolution of the nanostructure and chemistry of a model Ni–Cr–Al superalloy. II: analysis of the coarsening behavior. Acta Mater. 2007;55(4):1159–1169. doi: 10.1016/j.actamat.2006.08.024
- Matan N, Cox DC, Rae C, et al. On the kinetics of rafting in CMSX-4 superalloy single crystals. Acta Mater. 1999;47(7):2031–2045. doi: 10.1016/S1359-6454(99)00093-2
- Ashby MF, Abel CA, Goulette MJ. Materials selection to resist creep [and discussion]. Philos Trans R Soc A. 1995;351(1697):451–468.
- Kocks UF, Argon AS, Ashby MF. Thermodynamics and kinetics of slip. (Progress in materials science; Vol. 19). S.l.: Pergamon Press, Oxford, UK; 1970.
- Argon AS. Internal stresses arising from the interaction of mobile dislocations. Scripta Metallurgica. 1970;4(12):1001–1004. doi: 10.1016/0036-9748(70)90048-7
- Murakumo T, Koizumi Y, Kobayashi K, et al. Creep strength of Ni-base single-crystal superalloys on the tie-line. In: Green K, Harada H, Pollock TM, editors. Superalloys 2004. Warrendale (PA): TMS; 2004. p. 155–162.
- Murakumo T, Kobayashi T, Koizumi Y, et al. Creep behaviour of Ni-base single-crystal superalloys with various volume fraction. Acta Mater. 2004;52(12):3737–3744. doi: 10.1016/j.actamat.2004.04.028
- Maier HJ, Niendorf T, Bürgel R. Handbuch Hochtemperatur-Werkstofftechnik: Grundlagen, Werkstoffbeanspruchungen, Hochtemperaturlegierungen und -beschichtungen. 5th ed. Wiesbaden: Springer Vieweg; 2015.
- MacKay RA, Gabb TP, Smialek JL, et al. A new approach of designing superalloys for low density. JOM. 2010;62(1):48–54. doi: 10.1007/s11837-010-0011-0
- MacKay RA, Gabb TP, Garg A, et al. Influence of composition on microstructural parameters of single crystal nickel-base superalloys. Mater Charact. 2012;70:83–100. doi: 10.1016/j.matchar.2012.05.001
- MacKay RA, Gabb TP, Nathal MV. Microstructure-sensitive creep models for nickel-base superalloy single crystals. Mater Sci Eng. 2013;582:397–408. doi: 10.1016/j.msea.2013.04.072
- Roth HA, Davis CL, Thomson RC. Modeling solid solution strengthening in nickel alloys. Metallurgical Mater Trans A. 1997;28(6):1329–1335. doi: 10.1007/s11661-997-0268-2
- Crudden DJ, Mottura A, Warnken N, et al. Modelling of the influence of alloy composition on flow stress in high-strength nickel-based superalloys. Acta Mater. 2014;75:356–370. doi: 10.1016/j.actamat.2014.04.075
- Shah DM, Cetel A. Evaluation of PWA1483 for large single crystal IGT blade applications. In: Pollock TM, Green K, Kissinger R, editors. Superalloys 2000. Warrendale (PA): TMS; 2000. p. 295–304.
- Morinaga M, Yukawa N, Adachi H, New Phacomp and its applications to alloy design. In: Gell M, Kortovich CS, Bricknell RH, editors. Superalloys 1984. Warrendale (PA): TMS; 1984. p. 523–532.
- Matsugi K, Murata Y, Morinaga M, Realistic advancement for nickel-based single crystal superalloys by the d-electrons concept. In: MacKay RA, Antolovich SD, Stusrud RW, et al., editors. Superalloys 1992. Warrendale (PA): TMS; 1992. p. 307–316.
- Seiser B, Drautz R, Pettifor DG. TCP phase predictions in Ni-based superalloys: structure maps revisited. Acta Mater. 2011;59(2):749–763. doi: 10.1016/j.actamat.2010.10.013