
Abstract
Recent years have seen the resurgence of private-rental housing as both a place to live, and a site of capital investment. Individual landlordism is a key feature of this resurgence. This paper aims to understand the networked geographies of private landlordism. Drawing on Dutch register data, containing geocoded information on the full population and housing stock, this paper is able to uniquely link private-rental units to their (landlord) owners. By linking landlords’ places of residence and investment, flows of capital across space are visualized. Empirically, these findings show that, despite the liquidity of capital and the typical focus on transnational investments, most landlords invest locally or regionally, resulting in urban-regional networks of landlordism. These patterns pertain to landlord spatial strategies as well as the functioning of urban systems. Conceptually, findings demonstrate that property-based class relations between tenants and landlords are spatial relations as well, linking places of accumulation with places of extraction and reproducing spatial patterns of (dis)advantage.
Introduction
Across countries of Europe and North America, recent years have seen the resurgence of private-rental housing as both a place to live and a site of capital accumulation. The increase in private renting coincides with the decreasing affordability and accessibility of homeownership and the erosion of social-rental alternatives. Reinvestment in the tenure is driven by global corporate players as well as small-scale landlords. In fact, collectively, the latter group dominates the private-rental sectors of countries including the UK (Kemp, Citation2015), US (Fields, Citation2018), France, Germany (Wijburg, Citation2018) and the Netherlands (Aalbers et al., Citation2021). For these individuals, landlordism is part of broader strategies of property-based welfare (Ronald et al., Citation2017) as rental property combines a continuous income stream with the promise, or hope, of asset-price inflation. Housing, then, functions as an asset class.
Multiple property ownership has thus become more important in enabling wealth accumulation (Kadi et al., Citation2020). After the global financial crisis house prices have increased at such a rate that in many (especially urban) places they have eclipsed income from labour, making the statement that homes now earn more than jobs ring true (Ryan-Collins & Murray, Citation2021). This observation has led several scholars to re-engage with the decades-old concept of housing classes (Rex & Moore, Citation1967; Saunders, Citation1984), arguing for again more seriously considering the centrality of (multiple) property ownership in socio-economic stratification and class demarcation. At the top of their housing-based class schemes, these authors place groups such as housing-rich investors (Adkins et al., Citation2021), accumulating families (Forrest & Hirayama, Citation2018) or landlord elites (Hochstenbach, Citation2022a). From a more relational perspective, multiple property ownership constructs classes of rentiers and renters, with these groups inherently linked through practices of accumulation and extraction (also Harvey, Citation1974).
While these patterns are inherently spatial, few studies have paid in-depth attention to the geographies of landlordism. Those studies that do employ a spatial lens, almost exclusively focus on those places where landlords extract their rents from. These typically completely disregard geographies of accumulation and the ways in which areas of accumulation and extraction are intertwined (an exception being Shelton, Citation2018). This paper addresses this key gap by developing a more relational spatial perspective, highlighting how spaces of accumulation and extraction are linked through flows of capital. In other words, this paper presents an investigation into the networked geographies of landlordism.
The paper contributes to the literatures on housing and geography in various ways. Empirically, it gives key insights into the spatial behaviour of landlords. At least two scenarios are plausible. A first scenario would be that landlords conceive of the Dutch housing market as a single entity, leading them to identify and capitalize on rent and value at a national scale. Nationally, capital flows would then be directed towards the same locations. A second scenario would see landlords operating on a regional or even local basis, which would suggest the existence of multiple geographical sub-markets that can be mapped and delineated.
The paper therefore maps wealth accumulation and rent extraction through housing across space. With increasing attention to housing as a marker of class position and source of social stratification, this paper adds that these class relations are spatial relations as well (see Harvey, Citation1974). That is, just like the class positions of landlords and tenants inherently intertwined through rent payments, so are areas of wealth accumulation and rent extraction functionally connected through capital flows. Such a spatially relational conceptualization helps understand how landlordism are continuously implicated in the reproduction of both concentrated affluence and concentrated poverty (also Shelton, Citation2018).
From a geographical perspective, studying the spatial relations of landlordism informs the study of spatial networks, or urban systems. Instead of following flows of people – such as commuters – this approach follows flows of capital – such as rent payments – from areas where landlords own property to areas where they reside themselves. Such capital flows not only help to delineate functional urban systems, but can also give insight into the degree to which these systems are interconnected with each other (also Poorthuis & Van Meeteren, Citation2021).
The empirical focus of this paper is the Netherlands where landlordism has been on the rise post-GFC after decades of decline. Dutch register data for the entire population and housing stock make it possible to directly link private landlords to the property they own. In a previous study, I used these data to unravel landlords’ (typically highly privileged) class position (Hochstenbach, Citation2022a). In this paper, I link landlords’ places of residence to their places of investment, illuminating their geographies of accumulation and extraction. While the empirical findings in this paper are unique to the Netherlands – which represents a specific geography, built-up form, housing system and institutional context – findings about landlord geographies are likely to have wider relevance.
Literature
Landlordism, wealth and rent
Many countries of Europe and North America have seen socio-economic disparities grow over the last couple of decades. Piketty (Citation2014) has influentially argued these inequalities are increasingly wealth based rather than income based. This results from the fact that returns on wealth increasingly outperform those on labour. While wealth begets more wealth, labour captures a decreasing share of added value. This is not a natural or economic law though, but rather facilitated through political and institutional frameworks that, for example, support a particularly lax taxation of wealth and assets (Fernandez & Aalbers, Citation2017).
Private homeownership plays a central role in this dynamic as for many households, particularly those in the middle and upper-middle class, it is the most important source of wealth. This has spurred models of asset-based or property-based welfare in which housing wealth replaces or augments collective welfare provisions such as social safety nets and pensions (Ronald et al., Citation2017). Individuals and households are then encouraged to strategically invest on the housing market to maximize accumulation prospects (Langley, Citation2006; Christophers, Citation2021). These households are typically highly leveraged, taking on large mortgage debts to climb the housing ladder. This is often considered part of housing financialization in which housing’s investment function gains prominence over its consumption function, and local real estate is integrated in highly viscous flows of capital and debt (Newman, Citation2009; Fernandez & Aalbers, Citation2016).
Especially after the global financial crisis (GFC), but already starting before, many countries experienced a turn towards more explicit regimes of “property-led financial accumulation” (Fields, Citation2018). While asset-based welfare models centered around owner occupancy, private-rental housing has (again) become more integrated into contemporary accumulation and welfare strategies (Soaita et al., Citation2017). Rental housing’s appeal as an asset class has increased as it combines a steady stream of rental revenue with prospective asset-price inflation (Adkins et al., Citation2021). The property rich can thus mobilize rental units to generate rental incomes while also facilitating housing-wealth accumulation. In the Dutch context, policy facilitates both forms of accumulation: rental incomes are left largely untaxed, with properties only subject to a wealth tax over the assessed value minus outstanding mortgage debts. These wealth taxes are substantially lower than income taxes (Belastingdienst, n.d.). At the same time, fiscal policies promoting and subsidizing homeownership have pushed up house prices, e.g. through a generous mortgage-interest tax deductibility scheme as well as extensive mortgage lending, thus translating into housing-wealth accumulation among owners (Aalbers et al., Citation2021). Furthermore, recent policy reforms have liberalized the rental market and strengthened landlord power, among other things by reducing rent controls and rolling out short-term tenancies on a large scale. Investment appeal has been further enhanced by economic developments such as low interest rates and the ample availability of capital seeking investment opportunities, as well as growing demand from squeezed populations that are unable to buy or acquire social-rental housing (Aalbers et al., Citation2021).
In the wake of these transformations, affluent individuals have bought up increasing numbers of properties with the purpose to rent these out, typically referred to as buy-to-let. As alluded to in the paper’s introduction, small private landlords are dominant in many national contexts (Kemp, Citation2015; Fields, Citation2018; Wijburg, Citation2018), including the Netherlands, although simultaneous trends of property concentration and landlord professionalization have been identified in various countries as well (Hochstenbach et al., Citation2021; Pawson & Martin, Citation2021; Aalbers et al., Citation2021). Following the GFC, large corporate players have entered the housing markets of many countries, rapidly and often aggressively expanding their portfolios (Beswick et al., Citation2016; García-Lamarca, Citation2021; Christophers, Citation2022). There is not only considerable diversity in landlord profiles and portfolios, but also in terms of their investment strategies. They may operate locally or internationally, employ a short-term focus or prioritize long-term “patient” investments, and privilege investments in certain areas over others. While these different types of landlords can be captured under the common denominator of “multiple property ownership” (Kadi et al., Citation2020) it is crucial to unbox this broad diversity.
It has been argued that financial accumulation through housing is emblematic of a rentierization of the economy (Christophers, Citation2020). This rentier model is based on the ability to generate rents, a passive income, from the possession of scarce assets. Such rent-generating investments may go at the expense of more productive investments and growth elsewhere in the economy (also Ryan-Collins & Murray, Citation2021).
In the Dutch context, landlords are typically less leveraged than ‘regular’ buyers, i.e. those seeking owner-occupancy. This is evidenced by relatively low loan-to-value ratios (Kadaster, Citation2022) and many landlords even acquiring property without taking on a mortgage debt at all (Van der Harst & De Vries, Citation2017). This stands in contrast to other contexts such as the UK and Australia where buy-to-let purchases have been fueled by specific mortgage products (Kemp, Citation2015; Yanotti & Wright, Citation2021). The post-GFC increase in buy-to-let purchases in the Netherlands should therefore be considered part of broader housing-market transformations: during the 1990s and early 2000s, the Dutch market – as was also the case elsewhere – was first and foremost stimulated by allowing households to take on ever larger debts to buy a house. The injection of mortgage debt fueled multiple rounds of price increases. In the post-GFC environment, as lending has been somewhat restricted, the investment of private wealth has become more important in driving price increases (Hochstenbach & Aalbers, Citation2023). These changing dynamics further exacerbate inequalities between the asset-rich and asset-poor.
Landlordism and class
Growing cleavages between the asset-rich and asset-poor – or, more specifically, the housing-asset-rich and housing-asset-poor – have revived some interest in the concept of housing classes. The central idea being here that housing position is not only an outcome, but also constitutive of class (Rex & Moore, Citation1967; Dunleavy, Citation1979). Of course, housing may endow its residents with symbolic status, e.g. when it has fashionable architecture or is in a coveted location, but the concept of housing classes posits that housing also figures in the economic dimension of class. Yet, the concept of housing classes mostly disappeared off the radar since the 1980s as Marxian and Weberian schematizations of class focused on labour and production relations while dismissing the relevance of housing for class formation. Housing was supposed to be mostly the outcome rather than the cause of class disparities (Saunders, Citation1984).
But things have changed. As labour wages have stagnated and employment is increasingly insecure and precarious, accumulation through housing gains prominence. Asset ownership, then, becomes “a key distributor and driver of life chances” (Adkins et al., Citation2021, p. 564; also Zavisca & Gerber, Citation2016; Desmond, Citation2018), urging us to incorporate it in broader class schemes. In this vein, Adkins and colleagues propose a class scheme distinguishing between groups with housing assets and those without. They place housing-rich investors on top of the former group, which also includes regular owner-occupiers. Forrest & Hirayama (Citation2018) further highlight important intergenerational dynamics involved, proposing a class distinction between accumulating families – those that successfully accumulate wealth and pass this down to subsequent generations – and dissipating families. An important feature of these property-based class schemes is that they emphasize the importance of both wealth and income – i.e. stock and flow measures of economic position – for the multiple property owners at the very top. Owner occupants typically only benefit in terms of the latter, further depending on the timing, location and conditions of purchase. In the bottom half of these class schemes are renters that can’t generate income or wealth, as well as growing numbers of people that don’t meet basic housing needs – such as people experiencing homelessness or residential precarity.
Next to class dimensions, landlordism is associated with important generational markers. Some scholars propose the concept “generation landlord” (Ronald & Kadi, Citation2018; Pawson & Martin, Citation2021). While this frame comes with quite some overstatement, it highlights that the contemporary increase in landlordism is tied to historical housing conditions and trajectories. Those that bought at lower prices decades ago, subsequently benefited as insiders from long-term price booms facilitated by policies stimulating and subsidizing private ownership. This translated into the accumulation of housing wealth that could subsequently be reinvested through the acquisition of extra (rental) properties. The result is that, today, “the typical investor is a middle-aged man” (Yanotti & Wright, Citation2021, p. 3), also in the Netherlands (Hochstenbach, Citation2022a).
In the case of landlordism, class dynamics are evidently relational in which a privileged class of rentiers extracts rents from a class of renters. Social relations and power asymmetries are then central. Essentially, this entails a struggle over rent and the right to housing (Teresa & Howell, Citation2021; Risager, Citation2021). Harvey (Citation1974, p. 242) saw landlords as a class-interest group, exercising its power over renters in order to maximize rates of return. He already noted that landlords did so by operating in specific geographical submarkets. A relational perspective on rentiers and renters is therefore by definition also a spatial one.
Landlordism and space
The spatial dimensions of landlordism receive relatively scant attention. Most studies that do address the issue, focus on localized effects in the places where landlords acquire property. One local effect may be buy-to-let gentrification, as was for example found in the UK (Paccoud, Citation2017), as landlords buy up owner-occupied units and convert these into rental. Landlords may raise rents substantially to market levels (García-Lamarca, Citation2021) contributing to residential change, evictions, dispossession and residential exclusion. Others have shown how landlordism may contribute to price increases but at the same time reproduce concentrated poverty, simply extracting higher rents from the same disadvantaged populations (Hulse & Reynolds, Citation2018). In the US, for example, investors have been active in buying up foreclosed single-family units in distressed neighbourhoods (Immergluck & Law, Citation2014; Fields, Citation2022). Increased landlord activity may also impact neighbourhood experience and belonging. Overcrowding, residential instability and community erosion may exacerbate as landlords subdivide dwellings into small units and opt for short term rentals (Leyshon & French, Citation2009; Smith & Hubbard, Citation2014).
More broadly, housing markets have become increasingly polarized at multiple spatial scales (Hochstenbach & Arundel, Citation2020). This polarization has been linked to the increasing prevalence of market forces that tends to privilege winner areas over struggling ones. Urban and regional policies have been realigned to support further growth in these successful areas (Brenner, Citation2004). The same logic may apply to landlordism. Landlord activity is not spread evenly across space, but concentrates in specific geographical submarkets (Harvey, Citation1974). These areas are then exposed to extra regional, nationwide and transnational capital flows (Aalbers, Citation2019; Janoschka et al., Citation2020) which can push up house prices and exacerbate uneven development (Smith, Citation1982). Such housing dynamics may trigger spatial spillovers. Saturation of local markets may push demand to other, often nearby or well-connected areas. Such a spatial trend was found for Amsterdam and its surrounding regions (Teye et al., Citation2018). This may also be the case for buy-to-let demand, with landlords seeking to jump on and subsequently close new rent or value gaps (also Paccoud, Citation2017; Christophers, Citation2022). Some studies have further zoomed in on landlord spatial strategies. Crook and colleagues (Citation2012) for example show that landlords in Scotland generally stick to buying property in areas close to where they live and in areas they are familiar with. Local knowledge helps them to manage and mitigate risks in an otherwise difficult to navigate market, while geographical proximity helps them to “keep an eye” on the property. These were predominantly small-scale players. Particularly more professionalized investors may acquire property over longer distances as their strategies prioritize maximizing capital gains and rent revenue. These strategies focus more on identifying the widest rent or value gaps, while being less concerned about managing risks through local knowledge (Yanotti & Wright, Citation2021; Pawson & Martin, Citation2021). The management of diverse rental portfolios scattered across space has been further facilitated by digital advances and automation (Mills et al., Citation2019; Fields, Citation2022). From these studies, a picture emerges that landlord geographies differ between types of landlords and the portfolios they manage. In the case of landlordism, class and geography may thus be intertwined in important ways.
Geographical enquiries into landlord geographies typically focus on those areas where landlordism and its effects materialize in (urban) space, i.e. the areas where they hold property. Alternatively, some studies focus on landlord management strategies, essentially conceiving of geography as a “tool” to manage property portfolios. With this study, I want to broaden this geographical enquiry. If landlordism is conceived of as an essentially relational dynamic between landlord and tenant, it implies a spatially relational dynamic as well. Just like commuter flows connect places of residence and work, so does landlordism connect places through capital flows. The established relationship is bi-directional at least. The initial buy-to-let purchase represents the mobilization of capital by a landlord to invest in certain destinations (a mortgage may further link the purchase to international capital markets). The subsequent transfer of rent from tenant to landlord establishes a continuous capital flow across space. This leads Shelton (Citation2018, p. 1070) to conclude that concentrated affluence and poverty “are fundamentally interconnected and co-produced through property ownership, where the extraction of rents from areas of concentrated poverty works to simultaneously produce areas of concentrated affluence elsewhere in the city.”
To be sure, landlordism does not only link areas of concentrated affluence and poverty. Landlords may also operate in specific housing submarkets where they can rent out property at a premium to more affluent populations that are not willing or not able to buy (yet). This may include groups such as expats looking for short-term accommodation, young adults in a transitory life phase or unstable work situation, and middle-income households excluded from homeownership. The key point here is, though, that such a relational perspective does not consider neighbourhoods as isolated containers, but rather as units that are functionally connected to each other through, in this case, capital flows. It illuminates how patterns of accumulation and extraction are fundamentally intertwined across space.
Context: the Dutch private-rental sector
From the Second World War up to the early 2000s, the Dutch private-rental sector was in almost continuous decline. In 1947, private-rental housing made up around 60% of total stock, but this figure dropped to 26% in 1980 and 11% in the early 2000s. Up until the GFC this share remained rather stable, but has since increased. By early 2022, 14% of housing units was private rental (Musterd, Citation2014; Aalbers et al., Citation2021; Statistics Netherlands, Citation2022).
While a growth from 11% to 14% may at first sight seem modest, it is notable in at least three ways. First, this growth comes after decades of continuous decline, thus representing a notable reversal of trends. Second, overall housing-market transformation tends to take time, obscuring more substantial housing dynamics. Zooming in on these, we can see that the total Dutch housing stock grew by 659,000 units between 2012 and 2022. The private-rental sector increased by 282,000 units over the same period (Statistics Netherlands, Citation2022). In other words, even if the private-rental sector represents only 14% of the total housing stock, it accounted for almost 43% of total stock growth over the last decade. Third, major cities have historically more pronounced private-rental sectors and seen stronger recent growth. In Amsterdam, for example, the private-rental share grew from 25% in 2012 to 31% in 2022 (Statistics Netherlands, Citation2022).
Private-rental growth has mainly been achieved either through new developments (“build-to-rent”) or through the purchase and conversion of existing housing units (“buy-to-let”). While the former is mostly associated with larger (institutional) investors who have access to sufficient capital to finance larger developments, the latter is associated with both small landlords and large firms (Aalbers et al., Citation2021). Both build-to-rent and buy-to-let have shown a sharp increase in recent years. While the rate of private-rental construction stood at less than 2,000 new units per annum for the 2008–2013 period, it subsequently rapidly increased with the figure being around 17,000 new units in 2018 (Conijn, Citation2019; also Aalbers et al., Citation2021). Buy-to-let purchases meanwhile constituted 10% of all house purchases in 2009, before gradually increasing to over 15% in 2019Footnote1 (see Hochstenbach & Aalbers, Citation2023).
The recent revival of private renting is deeply intertwined with a restructuring of the tenure. Historically, the Dutch private-rental sector disproportionally consisted of cheap units occupied by low-income households. In the post-GFC era, however, landlords have shifted focus to more expensive housing for middle and high-income residents. In 2012, landlords still rented out around 70% of their units in the rent-regulated sector, where rents are kept below a maximum of 752 euros (2021 figure, inflation corrected). In 2021, this was the case for only 40% of their units.Footnote2 In other words, not only has the private-rental sector grown in size overall, but particularly the more costly liberalized segment has grown at the expense of cheaper options.
The recent growth of private renting has multiple explanations and is not unique to the Netherlands, as the literature section already clarified. International economic trends, for example pertaining to low interest rates and ample capital availability in the post-GFC decade, have enhanced rental housing’s reputation as an appealing asset class. Demand from squeezed groups unable to buy or rent in the social sector has rapidly increased. These include growing swaths of middle-income households, the insecurely employed, and the young. Dutch housing policies furthermore promoted private-rental growth, as discussed above. These policies enabled landlords to demand higher rents, introduced short-term tenancies (whereas indefinite ones used to be the norm) and severely restricted housing associations in providing alternative housing (Van Gent & Hochstenbach, Citation2020).
While beyond the empirical scope of the paper – which draws on 2019 data (see below) – recent years have seen the Dutch government introduce various measures to limit landlordism again. Since 2021, national government has increased the stamp duty for landlords, has allowed municipalities to completely ban buy-to-let from parts of their housing stock, and has announced new measures to regulate rents more. This U-turn from promoting to restricting private landlordism, was borne out of increasing public and political concerns about how landlords may outcompete first-time buyers on the housing market, and subsequently charge rents unaffordable to the middle classes as well. In combination with economic instability, high inflation and increasing interest rates, this is likely to substantially reduce buy-to-let activity.
Data and methods
This paper investigates the networked geographies of private landlordism. Methodologically, it is first necessary to identify private-rental units and their owners and subsequently locate them – where these dwellings are located and where their owners live. The final step is to draw the direct geographical linkages between these locations of landlord residence and ownership.
To do so, this paper draws on data from the System of Social-statistical Datasets (SSD) from Statistics Netherlands (CBS). The SSD contains register data for the full population registered in the Netherlands as well as for the full housing stock. Uniquely, these data make it possible to link private-rental units to their landlord owner. This is, however, only the case for rental units owned directly by private individuals. Private-rental units owned by companies, trusts, institutions and other entities cannot be linked to their owner. Previous research has shown that around half of all private-rental units in the Netherlands is owned by a private individual (Hochstenbach, Citation2022a).
Through aggregation, it is also possible to establish how many rental units a landlord owns (portfolio size). Landlords owning 1 or 2 rental units were classified as small-scale, 3 to 9 as medium-scale and 10 or more as larger-scale. This classification was chosen for the practical purpose of this analysis, allowing for sufficiently large numbers per group to conduct spatial analyses.
While there is a notable difference between owning ten properties or multiple hundreds, in a previous study employing the same data I have shown that both overwhelmingly belong to the most privileged in terms of wealth and income (ibid.).
This paper draws on data from 2019. At the time of analysis, this was the most recent data available. Furthermore, this data is not influenced by (temporary) distortions caused by the Covid-19 pandemic. As landlord data have only recently been added to the SSD, longitudinal micro-level data are not yet sufficiently available to track changes over noteworthy time periods. Using aggregate data, previous studies on the Netherlands have shown a steep increase in private renting and buy-to-let purchases in the post-GFC environment (Aalbers et al., Citation2021).
Individual and dwelling-level data are aggregated to spatial units. This is possible as all data are geocoded. This paper focuses on municipalities as the main spatial unit. In 2019, there were a total of 355 municipalities in the Netherlands. From this, it follows that there are a possible number of 126,025 (=355*355) combinations of where landlords live and where they own property. To comply with privacy requirements of Statistics Netherlands, combinations – or, flows – with less than ten observations (i.e. rental properties) are removed from the dataset. All flows are furthermore rounded to fives, again to comply with privacy requirements. Doing so, removes the vast majority of possible pairs, indicating the concentrated nature of landlord investment geographies. Each observation, or landlord residence-ownership pair, thus represents a minimum of ten rental properties although some pairs involve many more properties, as is explored below. These properties may, however, be in the hands of one (large-scale) landlord or distributed among multiple smaller-scale ones. The final dataset contains a total of 3,315 observations involving a total number of 365,200 rental units. These include 167,600 properties owned by small-scale landlords, 92,400 properties owned by medium-scale landlords, and 87,300 units owned by larger-scale landlords.Footnote3
To be sure, this is not the total size of the Dutch private-rental stock. As already mentioned, private-rental units owned by companies, trusts and the like are not included. Furthermore, privacy requirements meant the removal of other observations from the final dataset. To give an indication: in 2019 the total size of the Dutch housing stock was some 7.56 million units, of which around 900,000 were private rental. A total of 447,300 private-rental units could subsequently be linked to their owner and 365,200 observations met the privacy requirements for this paper.
All rental units have a tenant registered at the address. This allows for a clear delineation of the private-rental sector, excluding other forms of multiple property ownership such as holiday rentals (e.g. Airbnb), pieds-a-terre or property that is purposefully left vacant and used as “safe deposit box” (Fernandez et al., Citation2016). The dataset does include private-rental units that are only rented out temporarily as no information is available on tenancy agreement. Furthermore, no information is available about how landlords acquired the property.
presents a sample of the data structure. It shows the most common resident-ownership pairs – or, flows – based on landlords’ place of residence and where they own property. As the most common pairs are typically intra-municipal, the bottom sample shows the most common inter-municipal flows.
Table 1. Data sample of the top 10 most common municipal relations based on landlord place of residence and their place of rental property ownership.
The aggregated data of residence-ownership pairs are subsequently analyzed and visualized using ArcGIS. These spatial analyses are enriched with some descriptive information on the dwellings as well as some socio-economic information on the municipalities where landlords own and live. These aggregated data are derived from the 2019 dataset Core Figures Boroughs and Neighbouhoods publicly available from Statistics Netherlands.
Results
Separate geographies of landlord residence and ownership
Before moving to a networked analysis of private landlordism, this section first sets the scene through a brief analysis of the separate geographies of where landlords live and where they own property.
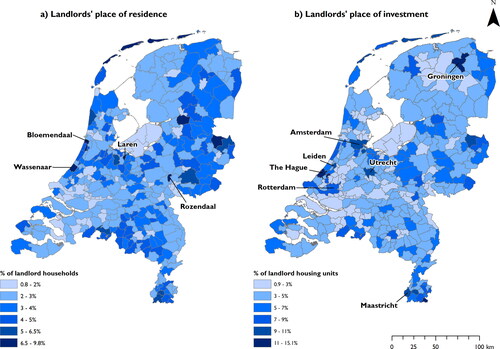
In terms of residence, landlords are highly overrepresented in municipalities such as Bloemendaal, Wassenaar, Laren and Rozendaal (, panel a). These leafy suburbs belong to the most affluent, expensive and coveted places in the country. Especially in the public mind, these municipalities have a reputation of being home to the Dutch elite. In these municipalities, some 7 to almost 10 percent of households can be classified as landlords (i.e. owning rental property). Their residential geography is rather different from where these landlords own and rent out property (, panel b). Although landlord geographies are variegated, their ownership shares are highest in the major cities – Amsterdam, Rotterdam, The Hague and Utrecht – as well as in medium-sized university cities such as Leiden, Groningen and Maastricht. These cities attract many students generating continuous demand for private-rental housing.
Figure 1. The geographies of landlordism: where landlords live (panel a) and where they own property (b). Source: Adapted from (Hochstenbach, 2022a), SSD data.
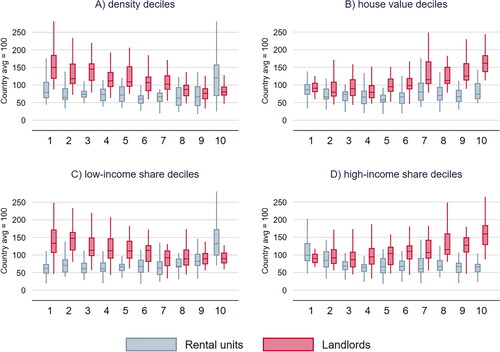
Geographies of landlord residence and ownership are further explored in , which shows the over or underrepresentation of landlords or their property relative to the national average. While acknowledging diversity, landlords are typically more likely to live in low-density environments while their ownership is especially concentrated in the highest density municipalities – i.e. the major cities or university cities. In terms of house values, it confirms that landlord residences are highly overrepresented in the most expensive areas. Their rental properties, however, are rather evenly spread out among both cheaper and more expensive municipalities. From this it logically follows that landlords live in municipalities with rather low shares of low-income households and high shares of high-income households. Their properties, again, are more evenly distributed – even concentrating in municipalities with relatively many low-income households and few high-income ones.
Figure 2. Box plots of where landlords live and own housing units. Municipalities are grouped by deciles from lowest (1st) to highest (10th) in terms of density (A), house values (B), the share of low-income households (C) and the share of high-income households (D).
It is important to emphasize important overlaps as well. In fact, around half of all private-rental units in the analysis are owned by a landlord living in the same municipality (this is echoed in , showing that the most common residence-ownership pairs are intra-municipal). The other half is owned by a landlord living elsewhere in the country. Nevertheless, geographies of landlord residence and ownership show clear differences. These serve as the basis for the networked analyses that follow.
Networked geographies of private landlords
presents a relational geography of where investors own property and where they live themselves. It highlights the most frequent relations. As discussed before, the visualized flows can be considered to represent both the investment into the housing stock of certain areas and the subsequent extraction of rents from these areas – or more precisely, the populations living there.
Figure 3. The networked geographies of private landlordism in the Netherlands. Most important flows between landlords’ place of residence and ownership highlighted.
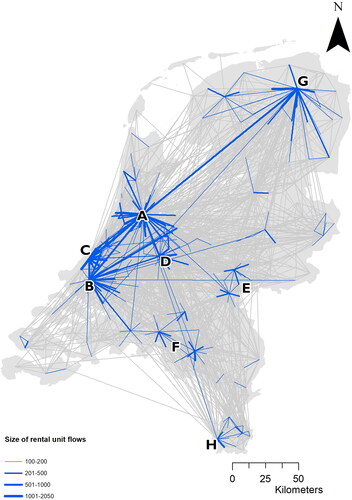
If private landlords would make investment decisions completely detached from regional contexts, the resulting map would show a random pattern of flows across the country. This is not what the data show, however. There is a clear geography, implying that landlord behaviour is informed by distinct spatial strategies, leading to the formation of distinct geographical sub-markets.
At this point, it is important to underscore here that these patterns are not necessarily indicative of a more or less desirable form of landlordism, even if public debate tends to be more sympathetic toward small-scale and locally operating “mum and dad” investors (see Hulse et al., Citation2020), also in the Dutch context (Hochstenbach, Citation2022b). These data do not indicate whether locally operating landlords are indeed better or worse than those operating nationally or internationally, nor whether this is the case for small-scale or larger-scale ones.
The map shows a dense network of landlord relations in the Randstad region, the major conurbation in the west of the country. Here, a lot of landlord activity concentrates around the major cities. Amsterdam (A), Rotterdam (B), The Hague (C) and Utrecht (D) function as important nodes – which in this case means places of landlord investment. Firstly, these nodes are linked to neighbouring municipalities, in many cases the affluent suburbs where landlords concentrate. For example, over 2000 rental units in The Hague are owned by landlords living in affluent Wassenaar, while almost 1800 rental units in Amsterdam are owned by landlords living in neighbouring Amstelveen (also see ). Secondly, these nodes show strong interlinkages among each other. One example is that almost 800 rental units in Rotterdam are owned by landlords living in Amsterdam (while the opposite is true for almost 300 units). Third, there are outward linkages to more regional centers in the periphery. Amsterdam-based landlords own almost 600 units in the city of Groningen (conversely, over 100 rental units in Amsterdam are owned by landlords in Groningen).
Apart from the Randstad region, the map shows some regional networks and centers. It for example highlights smaller-scale concentrations of intense activity in the Arnhem-Nijmegen region (E) and the cities Eindhoven, Breda and Tilburg (F). It also show university cities Groningen (G) and Maastricht (H) functioning as important regional nodes – or sites of investment – in the country’s northern and southern peripheries.
These spatial patterns show noticeable similarities with the structure and geographies of daily urban systems in the Netherlands, as for example analyzed through commuting and patterns (Poorthuis & Van Meeteren, Citation2021). It underscores that landlords’ financial geographies are not detached from, but crucially build on functional urban systems.
Subsequently, I zoom in on the geographies of landlordism and capital flows in the four major cities. visualizes landlord investment in, and rent extraction from the four major cities. In other words, it shows where landlords owning in these cities live themselves. The width of the flow line indicates the strength of the spatial relationship (with wider lines indicating more rental units involved). The colour of the flow line indicates which type of landlord is most involved: a light pink colour indicates a dominance of small landlords, bright red of medium-sized landlords, and dark red of larger landlords.
Figure 4. The networked geography of private landlordism in the four large cities in the Netherlands. Note. This concerns rental properties owned in these cities, with flows connecting to landlords’ places of residence.
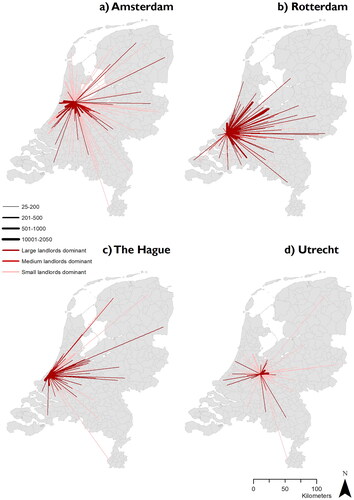
A side-by-side comparison of the four major cities yields some striking patterns, in terms of similarities as well as differences. First, these maps further underscore that landlordism – also when zooming in on the major cities – primarily generates regional capital flows. Take for example Amsterdam: 47 percent of rental units are owned by landlords living in the city and a further 23 percent are owned by landlords living within a 20 kilometer radius.
Second, however, landlordism is not limited to the direct region. All four cities reveal capital flows over longer distances. Looking at Amsterdam, again, 12 percent of analyzed units are owned by landlords living more than 50 kilometer away from the city (with no municipality in the country being more than 215 kilometers away). While this may seem a relatively modest share, it concerns more than 5,000 individual units in our dataset. Taking the average rent in the city’s private-rental sector − 1057 euros per monthFootnote4 – as a rough proxy, this implies continuous capital flows of more than 60 million euros per annum.
Third, interestingly, particularly Amsterdam – and to a lesser extent Utrecht – shows longer distance capital flows where small-scale landlords dominate. For Rotterdam and The Hague, larger-scale landlords dominate such flows. One plausible explanation may be that house prices in Amsterdam and Utrecht have increased at a much faster rate than in Rotterdam and The Hague. The former two cities are home to a stronger services industry and relatively more students and knowledge workers (see Musterd et al., Citation2020). These facts may increase appetite from small-scale investors.
demonstrates patterns for selected university cities. In terms of population Eindhoven, Groningen and Tilburg are the fifth, sixth and seventh largest city of the country respectively. Maastricht, however, ranks only 23rd. The reason for inclusion is that it is home to a large university, which is also the only Dutch university where students from abroad outnumber their domestic peers. The city furthermore ranks ninth in terms of the absolute size of the private-rental stock.
Figure 5. The networked geography of private landlordism in selected university cities in the Netherlands. Note. This concerns rental properties owned in these cities, with flows connecting to landlords’ places of residence.
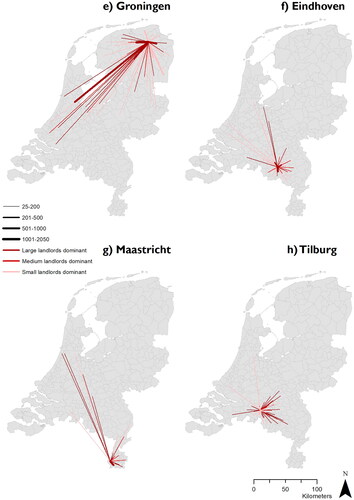
What is immediately noticeable is that, in comparison to the four major cities, landlord capital flows are even more regionally bound. This is particularly the case for Eindhoven and Tilburg. Landlord geographies remain mostly limited to the direct region around these municipalities, excepting some relatively weak ties with mostly larger cities in the western Randstad.
Landlord geographies for Groningen, on the other hand, are much more widespread. The city is clearly a site for investment for those living elsewhere as well. A previous study of the city’s housing stock has illuminated that these mostly concern small or shared housing units rented out to (group of) students (Hochstenbach et al., Citation2021). In the text above it was already highlighted that some 600 rental units in Groningen are in the hands of Amsterdam-based landlords. Nevertheless, here too the majority of landlords live in the direct region: some 1300 rental units are owned by landlords in Westerkwartier, 1100 in Noordenveld and almost 1000 in Tynaarlo. These are relatively small neighbouring municipalities.Footnote5 The overall picture is one of a strong regional network with some ties – or, capital flows – to further out localities.
Maastricht also shows some longer distance ties, mostly to the Randstad region, although dominant flows remain highly regional in the urbanized area of South Limburg. As Maastricht directly borders Belgium, and is also in close proximity to the German border, a particular limitation here is that these data exclusively concern domestic relations. Available data don’t allow for the analysis of international ties.
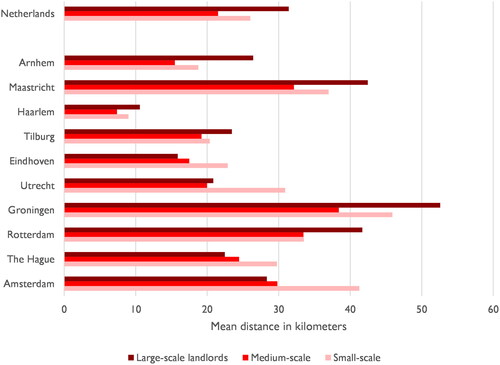
Additional analysis reveals that, across the country, larger-scale landlords on average own property over larger distances than small-scale ones (). Yet, these differences are relatively small with most larger-scale landlords also operating on a regional or even local scale.
Figure 6. The average distance (in kilometers, as the crow flies) of property ownership by landlord type. Top 10 cities in terms of investor share. Note. This includes landlords owning and living in the same municipality (in which case distance equals 0).
Finally, the data allow us to say something about the values of the property landlords own and rent out. (top panel) shows that landlords typically own housing units that are valued substantially below average. This is especially the case for larger-scale investors. Nationally, small-scale investors own property that is only slightly cheaper than the national average (€246,000 vs €248,000), the property owned by medium-scale investors is some 13 percent cheaper (€215,000) and that by large-scale ones is 25 percent cheaper (€185,000). Similar patterns apply for most municipalities in these analyses. The clear exception here is Amsterdam, where landlords in fact own property that is valued above average.
Figure 7. House values of investor property, relative to municipal average (panel a) and district-level prices relative to municipal average (panel b). Split by landlord portfolio size.
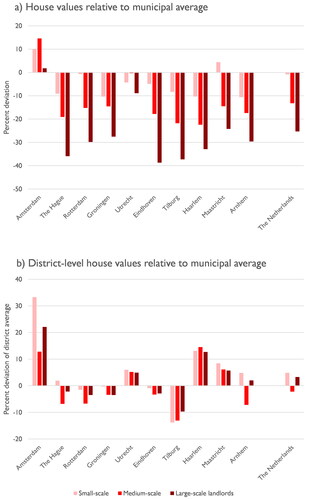
There may be various explanations as to why landlords’ properties are lower valued. The units may be of lower quality, smaller in size, or located in neighbourhoods that are less in demand. Unfortunately, the analyzed data do not include direct information on dwelling quality and size. However, it does allow us to look at geography. Rather than dwelling-level real estate values, (bottom panel) takes average real estate values at the level of the district (wijken). This gives a sense of the type of areas they invest in. A rather different and more variegated pattern then emerges.
It is shown that, at the national level, small-scale landlords own property in districts with real-estate values some five percent above the national average, while this is two percent below average for medium-scale landlords and three percent above average for large-scale landlords. At the urban level, variegated patterns exist. In The Hague, Rotterdam, Groningen, Eindhoven and Tilburg, landlords typically own property in slightly cheaper districts. In Utrecht, Maastricht, Haarlem and – particularly – Amsterdam they hold property in relatively expensive areas. In Amsterdam, small-scale landlords own property in areas where real-estate values are a third more expensive than average. Across cities, private landlords typically own most property in nineteenth century neighbourhoods. Here, they own relatively small units (explaining the below average house values in ) but in cities like Amsterdam and Utrecht these districts have been going through waves of gentrification for prolonged periods (explaining the above average district-level values in ). Simply put: landlords – small, medium and large – typically own relatively small and therefore cheaper units in older neighbourhoods that are experiencing gentrification – either mature (as in Amsterdam or Utrecht) or early (as in Rotterdam).
Discussion and conclusion
This paper has mapped the networked geographies of private landlordism across the Netherlands. In other words, it has unraveled landlords’ places of residence, their places of investment and the spatial interdependencies between the two. From the paper, several broader contributions to the literatures on private landlordism, housing inequality and the political economy of housing can be distilled.
First, conceptually, this paper argues for a spatially relational perspective on private landlordism. This is important as most studies look for landlordism in those places – whether they are regions, cities or neighbourhoods – where private-rental units can be found. This is too simplistic and tells only part of the story. Landlordism, essentially, involves the extraction of rents from tenant to landlord (Hochstenbach, Citation2022a; Adkins et al., Citation2021; Forrest & Hirayama, Citation2018). Landlords’ wealth accumulation potential goes at the direct expense of the income tenants have at their disposal after paying the rent, making it inherently relational (Harvey, Citation1974). Then, the (typically) monthly transfer of rent from tenant to landlord also signifies an inherently spatial relationship. While commuter flows connect places of residence and work, so does landlordism connect places of rent extraction to places of wealth accumulation through rent flows.
It is important to understand these spatially relational geographies of landlordism, as they help us understand that areas of immense wealth accumulation and areas of extreme rent extraction do not exist in isolation. They are functionally connected, or even mutually constitutive. One does not exist without the other (Shelton, Citation2018).These findings imply that landlordism plays a role in exacerbating the stark wealth disparities found in contemporary societies, while also reproducing socio-spatial inequalities. Renewed scholarly interest in housing classes – where housing position is constitutive of class – should therefore also acknowledge the spatial relations and dependencies in the formation of housing classes. Continuing down this line of enquiry, promises to advance debates on the (segregated) geographies of affluence and poverty, spatially uneven development, and the spatial polarization of housing markets It forwards our understanding how landlord-tenant relations reproduce such spatial divides.
Second, empirically, this paper has shown the networked geographies of landlordism to be predominantly regional. Landlordism decouples housing’s function as a unit of consumption (that is, a place to live and be at home) from its function as a unit of production (a wealth and rent generating asset). This decoupling is also spatial with consumption and production taking place in different locations. However, this decoupling is not complete and absolute, it is partial at best. Most private landlords own property in the same region where they live. This is especially the case for small-scale landlords, but also applies to larger-scale ones.
The alternative scenario that landlords view the Dutch housing market as a single functional market, identifying the most profitable rent or value gaps for investment at the national level, overall does not appear to be the case. Findings also stand in stark contrast to public and political debate on landlordism, where focus is typically on foreign investors snapping up housing. This certainly happens, with large multinational corporate players like Blackstone, LaSalle and Patrizia buying up portfolios of previously affordable social rental housing (Hochstenbach, Citation2022b; Aalbers et al., Citation2017).
To be sure, landlords having a local or regional orientation are not necessarily more or less problematic – or desirable for that matter – than landlords operating on a national or even international basis. While beyond the scope of this paper, it could be hypothesized that local landlords may reinvest their rental income and capital gains in the local economy, but it could simultaneously be argued these are more likely to be “amateur” landlords with possible repercussions for property management and maintenance. The effects on house prices, rent levels, exclusion and residential patterns may ultimately be highly similar though. In fact, the patterns found here point to rent revenues flowing from relatively poor areas to relatively rich ones. This effectively represents a regressive spatial redistribution.
Important regional variations exist though. Amsterdam, the country’s hottest property market, is shown to have landlord ties across much of the country. Also other major cities like Rotterdam and The Hague and the popular university city Groningen have expansive landlord geographies. Nevertheless, even these areas have a strong base of locally or regionally operating landlords.
These important spatial dimensions need to be acknowledged in property-based class schemes. Spatial patterns are an outcome of class stratification, but also constitutive of it. The results presented here highlight that class relations – between tenant and landlord – also represent spatial relations between co-dependent sites of accumulation and extraction. These spatial relations typically take shape at the local or regional level, although notable differences between landlords and across space exist. These findings suggest that, to understand property-based class schemes, we must move beyond archetypes of footloose or foreign elites buying up property (to leave empty) but must instead focus on the micro-geographies of property-class stratification: while the property-rich and property-poor may be worlds apart in terms of wealth position, geographical divides – while deep – take on a much more fine-grained, localized form.
Third, and relatedly, these very regionally oriented landlord geographies urge us to think through landlord investment practices. The Dutch housing system is subject to roughly the same rules of the game at the national level. In principle, landlords are not regionally restricted but could easily invest in property across the entire country. They could channel their capital into those areas where rent gaps or value gaps are largest, maximizing direct and indirect yields. The spatial analyses in this paper show this not to be the case, given the regional nature of most landlord geographies. It suggests regional knowledge and regional ties to be important in shaping investment geographies. Landlords buy up property in areas that are already familiar or where they have previous investment experience (Crook et al., Citation2012). This is similar to analyses of residential mobility, as most residential moves take place over relatively short distances to areas residents are already acquainted with.
From these patterns it follows that despite landlord capital flows – i.e. the investment in property and the extraction of rents – being very liquid, they are typically still rooted in regional and rather fixed geographies. These follow or are at least very similar to daily urban systems and other functional regional geographies. These patterns may also grow “accidentally” over time. This may relate to knowledge landlords have of the regional housing market, previous experiences and useful social networks. Furthermore, physical proximity facilitates property management. Keep-to-let is a clear case in point where a household holds on to property to rent out after moving to a new house. Their landlordism is dependent upon previous residential behaviour, and therefore very much rooted in everyday geographies. It shows that landlords do not simply invest based on de-contextualized and de-spatialized spreadsheet knowledge of rental yields, but are to a notable extent guided by local-regional geographies.
To grasp ascendant landlordism, it is key to understand their micro geographies – taking into account both geographies of accumulation and extraction, as well as the functional ties between these areas. This is more complicated than simply mapping where private-rental units can be found, but gives crucial insight into both their spatial practices and the spatial effects. Future research could continue down this line, for example through more qualitative enquiries into the spatial practices of landlords or quantitative studies into the spatial effects of these dynamics of extraction and accumulation.
Acknowledgements
The author thanks the editor and reviewers for their helpful feedback and suggestions.
Disclosure statement
No potential conflict of interest was reported by the authors.
Data availability statement
This paper draws on author calculations of non-public micro-data from the Systems of Social-statistical datasets (SSD) from Statistics Netherlands (CBS). Derived data supporting the findings of this study are available from the author on request.
Additional information
Funding
Notes
1 This share even increased to 18% in 2020, but this was at least partly caused by the introduction of an extra stamp duty on buy-to-let purchases from 2021 onwards, causing a rush among investors to buy property before this measure came into effect.
2 This percentage is based on new tenancies, excluding long-term tenants on ‘old’ contracts. Figures are derived from the Netherlands Housing Survey (WoON). 2012 and 2021 waves.
3 Rounded to the nearest hundred. The sum of properties owned by small, medium and larger-scale landlords does not add up to the total number of rental units because of the privacy requirement to exclude rows with less than ten observations. This was, logically, more often the case for the smaller sub-categories than for the larger total.
4 Based on data from the 2021 Living in Amsterdam survey. This amount concerns all tenants in the private-rental sector, both long-term renters who typically pay substantially lower rents (as they benefit from rent protection) and new entrants paying substantially more. For those that moved within the last three years, average monthly rents in the sector stood substantially higher at more than 1250 euros.
5 In 2019, Westerkwartier had a population of around 65000 inhabitants, Noorderveld 31000 and Tynaarlo 34000.
References
- Aalbers, M. B. (2019) Introduction to the forum: From third to fifth‐wave gentrification, Tijdschrift Voor Economische En Sociale Geografie, 110, pp. 1–11.
- Aalbers, M. B., Hochstenbach, C., Bosma, J. & Fernandez, R. (2021) The death and life of private landlordism: How financialized homeownership gave birth to the buy-to-let market, Housing, Theory and Society, 38, pp. 541–563.
- Aalbers, M. B., Van Loon, J. & Fernandez, R. (2017) The financialization of a social housing provider, International Journal of Urban and Regional Research, 41, pp. 572–587.
- Adkins, L., Cooper, M. & Konings, M. (2021) Class in the 21st century: Asset inflation and the new logic of inequality, Environment and Planning A: Economy and Space, 53, pp. 548–572.
- Belastingdienst. (n.d.) Ik verhuur mijn vakantiehuis of andere 2e woning. Den Haag: Belastingdienst. (accessed 21 December 2022).
- Beswick, J., Alexandri, G., Byrne, M., Vives-Miró, S., Fields, D., Hodkinson, S. & Janoschka, M. (2016) Speculating on London’s housing future: The rise of global corporate landlords in ‘post-crisis’ urban landscapes. City, 20, pp. 321–341.
- Brenner, N. (2004) Urban governance and the production of new state spaces in Western Europe, 1960–2000, Review of International Political Economy, 11, pp. 447–488.
- Christophers, B. (2020) Rentier capitalism: Who owns the economy, and who pays for it? (London: Verso Books).
- Christophers, B. (2021) A tale of two inequalities: Housing-wealth inequality and tenure inequality, Environment and Planning A: Economy and Space, 53, pp. 573–594.
- Christophers, B. (2022) Mind the rent gap: Blackstone, housing investment and the reordering of urban rent surfaces, Urban Studies, 59, pp. 698–716.
- Conijn, J. (2019) Kennis is als een fata morgana. Hervorming van de woningmarkt: resultaten en lessen voor de toekomst (Amsterdam: Amsterdam School of Real Estate).
- Crook, A. D. H., Ferrari, E. & Kemp, P. A. (2012) Knowing the area: The management of market and business risks by private landlords in Scotland, Urban Studies, 49, pp. 3347–3363.
- Desmond, M. (2018) Heavy is the house: Rent burden among the American urban poor, International Journal of Urban and Regional Research, 42, pp. 160–170.
- Dunleavy, P. (1979) The urban basis of political alignment: Social class, domestic property ownership, and state intervention in consumption processes, British Journal of Political Science, 9, pp. 409–443.
- Fernandez, R. & Aalbers, M. B. (2016) Financialization and housing: Between globalization and varieties of capitalism, Competition & Change, 20, pp. 71–88.
- Fernandez, R. & Aalbers, M. B. (2017) Housing and capital in the twenty-first century: Realigning housing studies and political economy, Housing, Theory and Society, 34, pp. 151–158.
- Fernandez, R., Hofman, A. & Aalbers, M. B. (2016) London and New York as a safe deposit box for the transnational wealth elite. Environment and Planning A: Economy and Space, 48, pp. 2443–2461.
- Fields, D. (2018) Constructing a new asset class: Property-led financial accumulation after the crisis, Economic Geography, 94, pp. 118–140.
- Fields, D. (2022) Automated landlord: Digital technologies and post-crisis financial accumulation, Environment and Planning A: Economy and Space, 54, pp. 160–181.
- Forrest, R. & Hirayama, Y. (2018) Late home ownership and social re-stratification, Economy and Society, 47, pp. 257–279.
- García-Lamarca, M. (2021) Real estate crisis resolution regimes and residential REITs: Emerging socio-spatial impacts in Barcelona, Housing Studies, 36, pp. 1407–1426.
- Harvey, D. (1974) Class-monopoly rent, finance capital and the urban revolution, Regional Studies, 8, pp. 239–255.
- Hochstenbach, C. (2022a) Landlord elites on the Dutch housing market: Private landlordism, class, and social inequality, Economic Geography, 98, pp. 327–354.
- Hochstenbach, C. (2022b) Uitgewoond: Waarom het hoog tijd is voor een nieuwe woonpolitiek (Amsterdam: Das Mag).
- Hochstenbach, C. & Aalbers, M. B. (2023) The uncoupling of house prices and mortgage debt: Towards wealth-driven housing market dynamics, International Journal of Housing Policy. doi: 10.1080/19491247.2023.2170542
- Hochstenbach, C., & Arundel, R. (2020) Spatial housing market polarisation: National and urban dynamics of diverging house values. Transactions of the Institute of British Geographers, 45, pp. 464–482.
- Hochstenbach, C., Wind, B. & Arundel, R. (2021) Resurgent landlordism in a student city: Urban dynamics of private rental growth, Urban Geography, 42, pp. 769–791.
- Hulse, K. & Reynolds, M. (2018) Investification: Financialisation of housing markets and persistence of suburban socio-economic disadvantage, Urban Studies, 55, pp. 1655–1671.
- Hulse, K., Reynolds, M. & Martin, C. (2020) The Everyman archetype: Discursive reframing of private landlords in the financialization of rental housing, Housing Studies, 35, pp. 981–1003.
- Immergluck, D. & Law, J. (2014) Investing in crisis: The methods, strategies, and expectations of investors in single-family foreclosed homes in distressed neighborhoods, Housing Policy Debate, 24, pp. 568–593.
- Janoschka, M., Alexandri, G., Ramos, H. O. & Vives-Miró, S. (2020) Tracing the socio-spatial logics of transnational landlords’ real estate investment: Blackstone in Madrid, European Urban and Regional Studies, 27, pp. 125–141.
- Kadaster. (2022) De Nederlandse hypotheekmarkt in beeld. Een rapport over woninghypotheken, loan-to-values en de rol van investeerders (Amsterdam: Kadaster).
- Kadi, J., Hochstenbach, C. & Lennartz, C. (2020) Multiple property ownership in times of late homeownership: A new conceptual vocabulary, International Journal of Housing Policy, 20, pp. 6–24.
- Kemp, P. A. (2015) Private renting after the global financial crisis, Housing Studies, 30, pp. 601–620.
- Langley, P. (2006) The making of investor subjects in Anglo-American pensions, Environment and Planning D: Society and Space, 24, pp. 919–934.
- Leyshon, A. & French, S. (2009) ‘We all live in a Robbie Fowler house’: The geographies of the buy to let market in the UK, The British Journal of Politics and International Relations, 11, pp. 438–460.
- Mills, J., Molloy, R. & Zarutskie, R. (2019) Large‐scale buy‐to‐rent investors in the single‐family housing market: The emergence of a new asset class, Real Estate Economics, 47, pp. 399–430.
- Musterd, S. (2014) Public housing for whom? Experiences in an era of mature neo-liberalism: The Netherlands and Amsterdam, Housing Studies, 29, pp. 467–484.
- Musterd, S., Hochstenbach, C. & Boterman, W. (2020) Ripples of structural economic transformation: The changing social geographies of Dutch metropolitan regions, Applied Geography, 116, pp. 102151.
- Newman, K. (2009) Post‐industrial widgets: Capital flows and the production of the urban, International Journal of Urban and Regional Research, 33, pp. 314–331.
- Paccoud, A. (2017) Buy-to-let gentrification: Extending social change through tenure shifts, Environment and Planning A: Economy and Space, 49, pp. 839–856.
- Pawson, H. & Martin, C. (2021) Rental property investment in disadvantaged areas: The means and motivations of Western Sydney’s new landlords, Housing Studies, 36, pp. 621–643.
- Piketty, T. (2014) Capital in the 21st century (Cambridge, MA: Harvard University Press).
- Poorthuis, A. & Van Meeteren, M. (2021) Containment and connectivity in Dutch urban systems: A network‐analytical operationalisation of the three‐systems model, Tijdschrift voor Economische en Sociale Geografie, 112, pp. 387–403.
- Rex, J. & Moore, R. S. (1967) Race, community and conflict: A study of Sparkbrook (London: Oxford University Press).
- Risager, B. S. (2021) Financialized gentrification and class composition in the post‐industrial city: A rent strike Against a real estate investment trust in Hamilton, Ontario, International Journal of Urban and Regional Research, 45, pp. 282–302.
- Ronald, R., & Kadi, J. (2018) The revival of private landlords in Britain’s post-homeownership society. New Political Economy, 23, pp. 786–803.
- Ronald, R., Lennartz, C. & Kadi, J. (2017) What ever happened to asset-based welfare? Shifting approaches to housing wealth and welfare security, Policy & Politics, 45, pp. 173–193.
- Ryan-Collins, J. & Murray, C. (2021) When homes earn more than jobs: The rentierization of the Australian housing market, Housing Studies, pp. 1–30. doi: 10.1080/02673037.2021.2004091
- Saunders, P. (1984) Beyond housing classes: The sociological significance of private property rights in means of consumption, International Journal of Urban and Regional Research, 8, pp. 202–227.
- Shelton, T. (2018) Mapping dispossession: Eviction, foreclosure and the multiple geographies of housing instability in Lexington, Kentucky, Geoforum, 97, pp. 281–291.
- Smith, N. (1982) Gentrification and uneven development, Economic Geography, 58, pp. 139–155.
- Smith, D. P. & Hubbard, P. (2014) The segregation of educated youth and dynamic geographies of studentification, Area, 46, pp. 92–100.
- Soaita, A. M., Searle, B. A., McKee, K. & Moore, T. (2017) Becoming a landlord: Strategies of property-based welfare in the private rental sector in Great Britain, Housing Studies, 32, pp. 613–637.
- Statistics Netherlands. (2022) Voorraad woningen; eigendom, type verhuurder, bewoning, regio (Den Haag: Centraal Bureau voor de Statistiek).
- Teresa, B. F. & Howell, K. L. (2021) Eviction and segmented housing markets in Richmond, Virginia, Housing Policy Debate, 31, pp. 627–646.
- Teye, A. L., de Haan, J. & Elsinga, M. G. (2018) Risks and interrelationships of subdistrict house prices: The case of Amsterdam, Journal of Housing and the Built Environment, 33, pp. 209–226.
- Van der Harst, F. & De Vries, P. (2017) Wie kopen er hypotheekloos? (Amsterdam: Kadaster).
- Van Gent, W. & Hochstenbach, C. (2020) The neo-liberal politics and socio-spatial implications of Dutch post-crisis social housing policies, International Journal of Housing Policy, 20, pp. 156–172.
- Wijburg, G. (2018) The differential impact of real estate financialization on the political economies of Germany and France. PhD diss., KU Leuven.
- Yanotti, M. B. & Wright, D. (2021) Residential property in Australia: Mismatched investment and rental demand, Housing Studies, pp. 1–22. doi: 10.1080/02673037.2021.1929858
- Zavisca, J. R. & Gerber, T. P. (2016) The socioeconomic, demographic, and political effects of housing in comparative perspective, Annual Review of Sociology, 42, pp. 347–367.