
 ?Mathematical formulae have been encoded as MathML and are displayed in this HTML version using MathJax in order to improve their display. Uncheck the box to turn MathJax off. This feature requires Javascript. Click on a formula to zoom.
Abstract
The past decade has seen the growth of Short-Term Lets (STLs) through Airbnb and other platforms. Measuring the scale of this activity is challenging as platforms appear unwilling to share data. Most research on Airbnb uses data from commercial sources but this raises issues of equity in access and transparency. Open data exist, but geographic and temporal coverage is limited. We consider whether these open data can be used to study the STLs sector, using a city in Scotland. Using 2017 data to construct: (i) property-level estimates of income; and (ii) through comparisons with rents in the long-term rental market, an area-level vulnerability index to identify neighbourhoods at greatest risk of properties switching from long-term to short-term renting. This index is strongly associated with the growth of Airbnb listings over two years. We conclude that open data can provide a valuable basis for research and policy. We discuss strategies for improving knowledge about this sector including through new data collection.
Introduction
In 2008, an online platform was launched which allowed people to easily let a spare room or other space. In the years since, that platform, Airbnb, has had over a billion guest arrivals while other companies have joined this rapidly expanding market. Airbnb can be considered part of the sharing or platform economy, where peer-to-peer activity provides access to goods or services, enabled by an intermediary on-line platform (Schlagwein et al., Citation2020). The sharing economy has impacted on diverse markets including the market for goods (e.g. Amazon), mobility (e.g. Uber) and labour (e.g. TaskRabbit) as well as accommodation (Grabher & König, Citation2020). For the last of these, Airbnb dominates the short-term lets (STLs) market (Sadowski, Citation2020).
A number of authors have discussed the possible impacts of this activity on traditional forms of tourist accommodation like hotels (Dogru et al., Citation2020; et al., 2020) but most of the criticism of Airbnb has been focussed on the impact it has on neighbourhoods and the housing system (Barron, Kung, & Proserpio, Citation2018; Gurran & Phibbs, Citation2017; Lee, Citation2016). As Crommelin et al. (Citation2018) note, the application of the sharing economy to accommodation through STLs may be particularly problematic as it diverts housing supply from the long-term rental market and, unlike other forms of economic activity, this supply is not easily replaced (Crommelin et al., Citation2018). The result can be displacement of the pre-existing community directly through loss of supply and indirectly through rising prices – a form of tourism-led gentrification (Wachsmuth & Weisler, Citation2018).
The challenge with any analysis in this area is the lack of official data to assess STL activity and hence the potential risk to different neighbourhoods. Airbnb does not make the data available that would allow a proper evaluation. Indeed, some of the changes made to their website over time seem designed to obscure levels of activity and hinder such evaluation (Crommelin et al., Citation2018). The resulting data gap has been filled by a number of actors who have used data scraped directly from Airbnb’s public booking website. The way data are collected and the level of detail provided impact on data quality, yet there has been little discussion of these in the majority of academic papers.
Access to scraped data is largely through proprietary providers. For example, those sources underpin all the papers which have sought to identify the neighbourhoods most at risk of seeing accommodation switch from long-term lets (LTLs) to STLs using rent gap theory (Amore et al., Citation2020; Grisdale, Citation2021; Robertson et al., Citation2020; Wachsmuth & Weisler, Citation2018; Yrigoy, Citation2019). By comparing the estimated income from STLs to that from long-term rental in the private rented sector, the papers identify the neighbourhoods at greatest risk of loss of housing supply and hence tourism-led gentrification. There are two disadvantages with such sources. First, there is usually a charge for access to the data, creating the risk of inequalities in who can perform research on the sector. Second, there is little transparency about crucial methodological details around how the data were collected and cleaned, and summary measures produced. General information is provided but important details are kept private to protect commercial interests. Both issues are characteristic of research with new forms of data (boyd & Crawford, Citation2012; Lazer et al., Citation2009).
The aim of this paper is to assess whether the only open version of these data, from InsideAirbnb, can accomplish the same or similar tasks. As well as being free to use, these data are provided with full details (open code) on data processing. The potential downside is that the data are relatively sparse, covering selected cities or locations and with only thin temporal detail. This paper explores in detail the issues and considerable assumptions required when using the InsideAirbnb dataset to estimate activity levels and hence rental income. By applying the method to our case study, Edinburgh, we demonstrate that estimates of the absolute rent gap for a neighbourhood may vary widely depending on the method and assumptions used. Nevertheless, we show that it is still possible to identify the neighbourhoods most vulnerable to an expansion in STL activity by focussing on relative positions. The paper therefore has three specific objectives:
to make estimates of rental income from STLs using open data, and explore how these depend on assumptions made;
to construct a vulnerability index to identify neighbourhoods where income from STL use appears greatest relative to that from LTL, and explore the geography of vulnerability in our case study city; and
to test whether this vulnerability index can identify the neighbourhoods which would be subject to the greatest expansion in STLs in the subsequent period.
Background
As noted above, Airbnb can be considered part of the sharing economy. Though initially dominated by individuals using spare capacity in their own homes or second homes to generate income, the nature of Airbnb has become more complex over time. The site increasingly has whole properties advertised and is now used by commercial STL companies to manage portfolios of properties. The size of the industry, and the associated income generated for hosts, has led to an increasing professionalisation of the platform (Deboosere et al., Citation2019). Stulberg (Citation2016) estimated that about a third of overall Airbnb revenues came from commercial users with multiple units. Using data from 167 countries, Adamiak (Citation2022) found that the vast majority of listings involved the rental of an entire property with 41.5% from this multiple-units group. Increasing concerns have been raised that the scale and nature of activity on Airbnb and related platforms represents not a ‘sharing economy’ but a digital real estate market (Shaw, Citation2020).
Opinion is divided as to the value of this rapid growth in STL, with some suggesting that this empowers ordinary people by providing a new source of income and offering a boost to city economies through tourism (Schor, Citation2016). Opponents point to the unregulated nature of this peer-to-peer model, noting that other parts of the hospitality industry and the LTL sector both have strict regulations which are avoided by providers operating through platforms (Wachsmuth & Weisler, Citation2018). The issues with STLs tend to be concentrated in areas that have a significant tourist industry and where there is potential unmet tourist demand (Oskam, Citation2020). The academic response has largely concentrated on the impact of the growth of Airbnb on the traditional hospitality industry (Dogru et al., Citation2020; Citation2020) and on housing and neighbourhoods (Barron et al., Citation2021; Deboosere et al., Citation2019; Wachsmuth & Weisler, Citation2018). It is the latter that this paper focuses on.
Housing, the sharing economy and gentrification
The changes brought about by the increases in STL should be seen in terms of the predominate narrative of urban renaissance in many cities in the developed world (Livingston & Clark, Citation2019), the increasing evidence of gentrification in many inner urban areas and the consequent suburbanisation of poverty (Bailey & Minton, Citation2018). High returns gained from listing properties on Airbnb bring extra pressure on the housing stock (Schäfer & Braun, Citation2016). Many cities have concerns over platforms’ impacts on the property market and the LTL market in particular, with some cities implementing local regulations to curb the worst of these (Scottish Government, Citation2019).
The field is still rapidly evolving but already evidence is emerging that, as the number of Airbnb listings in an area increases, house prices and LTL rents also increase (Barron et al., Citation2018; Garcia-López et al., Citation2020). As Crommelin et al. (Citation2018) argue, LTL landlords may find that STLs are more profitable, driving a shift in use. Increasing middle-class entrepreneurial rental activities have been observed on Airbnb, resembling earlier educational, financial and social attributes in the past gentrification waves (Semi & Tonetta, Citation2021). Expanding their business territories in response to the tourist rental demand, Airbnb has actively facilitated tourism-led gentrification (Gant, Citation2016; Gotham, Citation2005). Investors who team up with property managers enjoy not only the advantages of higher profit renting to tourists but also the easier, more flexible rental format and greater liquidity (Cocola-Gant & Gago, Citation2019; Katsinas, Citation2021). This contributes to the direct and indirect displacement of residents through a number of different factors including increased rents, increased ‘anti-social’ behaviour, and reduced neighbourhood quality for long-term residents (Rozena & Lees, Citation2021).
Using the rent gap to understand impact of STL growth
The spatial concentration of STLs has created concerns for the welfare of inner city and tourist-centred neighbourhoods in particular (Oskam, Citation2020; Rae, Citation2017). Many researchers measure the extent to which Airbnb impacts on a city’s long-term rental stock by calculating the potential change to STLs (Bao & Shah, Citation2020; DiNatale et al., Citation2018). They do this by estimating which properties could not be used as LTLs due to the long period they are listed on STL market. Others use the rent gap concept to identify which neighbourhoods are most vulnerable by looking at the difference between the potential rent achievable through LTLs compared with STLs (Amore et al., Citation2020; Grisdale, Citation2021; Robertson et al., Citation2020; Wachsmuth et al., Citation2018; Wachsmuth & Weisler, Citation2018). The concept has potential in helping to predict the changing rental landscape and provides valuable evidence for policy.
Researchers (Wachsmuth & Weisler, Citation2018; Yrigoy, Citation2019) argue that online platforms provide the opportunity to create a rent gap not through ‘capital depreciation’ but through a potential rise in rental income from renting to tourists who pay more for short stays, even allowing for the more intensive management required. The higher the ratio between potential rents from STL compared to LTL, the higher the open rent gap and the higher the financial incentive to switch. Increasing evidence has been gathered in many cities, such as Athens, Lisbon and Milan (Amore et al., Citation2020), New Orleans, USA (Robertson et al., Citation2020), and Toronto (Grisdale, Citation2021) which reveals the power of the platform to create opportunities for commercial hosts to capture increased value (Sadowski, Citation2020). The act of maximising rental income through the switch to STL can exacerbate pressures on housing, displacing long-term residents, making neighbourhoods vulnerable to distressing social and economic change (Yrigoy, Citation2019).
There is currently a substantial global debate about how the sector ought to be regulated (Gurran & Phibbs, Citation2017; Kaplan & Nadler, Citation2015; Leshinsky & Schatz, Citation2018; Wegmann & Jiao, Citation2017). One major barrier to effective regulation is the lack of data (Ferreri & Sanyal, Citation2018; Quattrone et al., Citation2016). Even when regulations are in place, this lack of data makes it difficult to enforce these regulations on STLs. Airbnb do not publish detailed information about the utilisation of properties. Some city authorities have had to go through legal channels to obtain Airbnb transaction data for regulation purposes (Hoffman & Heisler, Citation2020). Airbnb has agreed with ten EU cities to share data (Wray, Citation2020) but it is beyond the ability of small- to medium-sized local authorities to secure the same arrangement. This means that decision makers must rely on alternative sources.
Data on short term lets and Airbnb activity
To identify the rent gap, one must first measure the potential revenue from STL activity. This is non-trivial because it requires an accurate estimation of listings’ occupancy levels. Airbnb made this more difficult after 2014 when it implemented changes to its website. Before then, the website distinguished days when properties were booked from those when they were available or otherwise unavailable. After this time, the site merged booked days into the unavailable category (Crommelin et al., Citation2018). The credibility of implementing the rent gap theory therefore depends on the underlying data sources supporting such estimation. Here, there are three main choices: purchasing a licence for data from a commercial site, AirDNA; scraping data directly from the Airbnb web site oneself; or using an open dataset from InsideAirbnb.
On the first, AirDNA is a fintech company which monitors the Airbnb website, scraping data and processing it primarily to provide a commercial service to potential investors. This is the main source used by researchers applying the rent gap theory (Amore et al., Citation2020; Grisdale, Citation2021; Robertson et al., Citation2020; Wachsmuth & Weisler, Citation2018; Yrigoy, Citation2019). For example, Wachsmuth and Weisler (Citation2018) use AirDNA data along with available indicators of long-term rentals, such as American Community Survey (ACS) and real-estate websites, to estimate the rent gap in different cities. There are some specific limitations with this approach. Notably, AirDNA do not publish their methodology, which they presumably see as commercially sensitive, leading to a lack of transparency around how the data are gathered and processed. According to Crommelin et al. (Citation2018), AirDNA’s approach to estimating occupancy is to use data from before the 2014 change to the website to predict the likely split between booked days and other unavailable days for later listings, but no details are available. With a high cost for access, the use of AirDNA is therefore limited and hard to replicate for the wider researcher community and policy makers.
Second, it is possible for researchers or policy makers to set up their own process to scrape the Airbnb website but this process is complex and requires significant programming skills as well as time and computing resources. While the information is the copyright of Airbnb (or of the hosts who created the listings), there are exemptions in many countries which permit scraping for academic research purposes, regardless of website terms and conditions, although the law in this area is subject to some uncertainties (Burrow, Citation2021). Scraping directly provides control over data collection and processing, letting researchers control geographic coverage and frequency of collection, and the level of detail retained on property and host characteristics. Even so, it is still not possible to distinguish true bookings from days properties are otherwise unavailable. As noted in Crommelin et al. (Citation2018), the estimation of occupancy can be improved in various ways but the level of accuracy is still to be fully understood. The Urban Big Data Centre has provided a framework for researchers looking to undertake this themselvesFootnote1.
Third, data can be obtained free of charge from the non-commercial website, InsideAirbnb. This campaigning organisation provides data for a large but still limited number of cities. In contrast to AirDNA, InsideAirbnb has its roots in community activism on gentrification in New York.Footnote2 By making data openly available, they seek to quantify the impact of STLs on the housing market and residential communities, and empower activists and policy makers to develop effective regulatory responses to the growth of this sector.Footnote3 Their methods and code are open and available for others to replicate. For example, they estimate occupancy through the simple assumption that 50 per cent of bookings lead to a review.Footnote4 On the other hand, the voluntary nature of their efforts are reflected in the resources available which leads not only to partial geographic coverage but also limited frequency of data collection. Hence, our aim in this paper is to explore the strengths and weaknesses of this open data in providing an evidence base for research and policy. Specifically, we seek something analogous to a measure of the rent gap between STL and LTL uses to identify the vulnerability of different locations to the loss of housing to tourism uses.
Methods and Data
Case study: the city of Edinburgh
Edinburgh is a major tourist destination in the UK, host to one of the largest international arts festivals in the world and has a particularly active Airbnb market. The city is the capital of Scotland with a population of 518,500 in 2018Footnote5. In 2017, it received over two million international visitors, generating over 10 million bed nights and a spend of £1 billion. The city also received 2.6 million domestic visitors, generating 7 million bed nights and a spend of £829 million (VisitScotland, Citation2018). This volume of tourism activity has put the city under considerable pressure, particularly at a time when the population of Edinburgh is expanding. The situation has received extensive media coverage and has led policy makers to discuss potential remedies such as a tourist tax. Airbnb has featured heavily in the debate, with fears that the city is being ‘hollowed out’ as STLs displace residential use (Rae, Citation2017), eroding communities due to the consequent lack of LTL accommodation (Amos, Citation2018). A recent report suggested that Airbnb accounted for 16.7% of dwellings in Edinburgh city centre (Evans et al., Citation2019).
STL (Airbnb) data
As discussed, our data on Airbnb come from the InsideAirbnb website. The site’s creator scrapes Airbnb’s website up to monthly for different cities around the world. For the main analysis, we focus on data for 2017 for which we have nine scrapes carried out between January and September. For our robustness check, we use additional data for January to June 2019 to capture growth over the subsequent two years. Each scrape gives a snapshot of the Airbnb site at that point in time. Data are provided at the listing level and contain a variety of characteristics of the property including price, structural attributes, location (obfuscated coordinates), number of reviews, average review rating, availability, and landlord/host information (but not personal identifiers).
Our initial dataset for 2017 contains 73,390 listings with 95 variables. We wish to extract listings for accommodation which could conceivably be placed in the LTL sector. We therefore restrict the dataset to whole property lets, rather than rooms or beds in a shared property. The dataset contains information on property type, with 26 categories. We extract properties classified as: apartment, condominium, loft, bungalow, townhouse, house, villa, or castle. Properties with no reviews are removed on the basis that they are unlikely to be active. We remove properties with a price of £0 and those with prices over £1,000 per night. We include only properties which show availability for at least 60 nights per year. Properties available for fewer than 60 nights are assumed to be used primarily for other purposes (e.g. a private residence) and hence not otherwise available as LTLs. We exclude properties where the number of bedrooms is missing as we use the number of bedrooms to normalise the rent. Finally, we exclude duplicates where the price, month of scrape and property identifier are the same. This leaves a total of 23,138 listings, covering 4304 properties. A flowchart showing the workflow is included in Appendix A (supplementary material).
Occupancy
To estimate the earnings of a property, we need to know the number of nights sold (occupancy) and the price. Unfortunately, occupancy cannot be directly observed due to the changes Airbnb made to its website (discussed above) and must therefore be inferred. To do this, we need information on the number of stays and the duration of those stays. The method is similar to (San Francisco, B. o. S, Citation2016). For the first, we make use of the number of reviews per month (an important part of InsideAirbnb’s own estimation of occupancy). It will likely be an underestimate because not all guests leave reviews. For the second, we do not observe the length of each stay but we do know the minimum number of nights which must be made per booking. This gives the first (and most conservative) method of estimating occupancy:
(1)
(1)
Where reviews is the number of reviews per month and minstay is the minimum number of nights required per booking (both present in the scraped data). Each property is denoted with the subscript i with t representing the month in which the scrape was taken.
This is certainly an underestimate because it assumes that everyone leaves a review and that everyone stays only the minimum number of nights. One adjustment which can be made is to inflate the number of reviews to account for the fact that not everyone leaves a review; previous research (Georgie Cosh, Citation2020) and InsideAirbnb both assume 50% of guests leave a review. This gives the second method of occupancy estimation.
(2)
(2)
where reviewrate is the review rate, which we take as 50% for the purposes of the current analysis.
A third approach is to keep the number of reviews as the guide to number of lets but replace the minimum number of nights per stay from Equation(1)(1)
(1) with an estimate of the average length of stay. InsideAirbnb suggest an average stay of three nights per booking in Edinburgh though the basis for this figure is unclear. We therefore assume that people stay either for three nights or for the minimum number of nights where the minimum exceeds three nights. Making this adjustment to Equation(1)
(1)
(1) gives:
(3)
(3)
where avestay is the estimate of the average length of stay for Edinburgh, equal to three nights.
A final estimator is to adjust both the number of reviews and the length of stay which gives the fourth method:
(4)
(4)
Method 1 (M1) will give the most conservative estimate while Method 4 (M4) should give the highest estimate. One further adjustment to all methods is required. No property can be let out for more than seven days per week although nothing in our proposed methods captures this. We therefore place a cap on the number of nights per month. We know that most accommodation does not run at 100% occupancy and that there are likely to be gaps between stays. We assume that, on average, just over two nights per week would be unoccupied. We therefore cap the number of nights per month at 21.
shows the distribution of occupancy levels according to the four calculation methods. As can be seen, there is substantial variation in the estimates of the number of nights sold depending on the assumptions made. As expected, M1 gives the most conservative estimate, with the majority of properties expected to be occupied for less than 5 nights per month. Very few properties are affected by the assumed cap of 21 nights in this case. M4 gives the highest estimates of occupancy with more properties achieving the assumed maximum number of 21 nights per month than with the other methods.
Figure 1. Distribution of occupancy according to method of calculation.
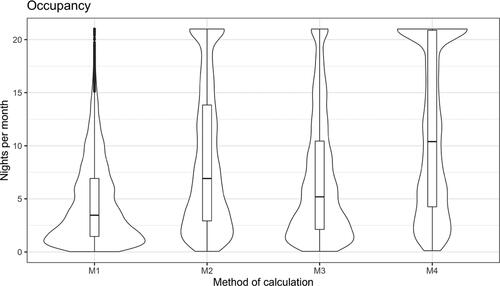
Without additional data, there is no way to tell which of these methods is closest to the true picture of occupancy. For this reason, we suggest that the results we present should be interpreted as relative rather than absolute measures of occupancy and income. Interpreting the results as relative measure reduces the influence of some of the parameters of the model on our results. For instance, the review rate primarily affects the overall level of estimated occupancy for all properties although there is some effect on the distribution because of the maximum occupancy cap. For the rest of the paper, we will proceed with method M4 as this method makes an attempt to adjust both for the fact that not everyone leaves a review and for the fact that some people will stay longer than the minimum required stay. The important point is that, whichever measure we use, we treat it as a relative not an absolute measure of occupancy.
Price
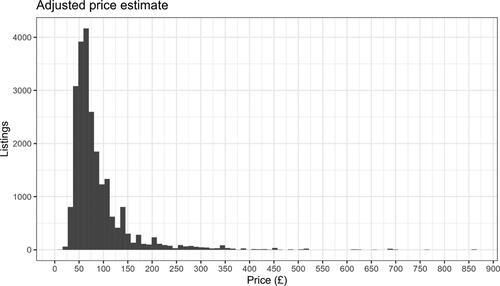
The nightly price on Airbnb is observed in the dataset. We make two adjustments. First, the price from InsideAirbnb is recorded in US Dollars. We convert this to Sterling using the Purchasing Power Parity (PPP) rate for 2017 according to the OECD. Second, we incorporate the cleaning fee charged by Airbnb into the nightly price. The cleaning fee is charged per stay. In some cases, no fee is charged whereas in others the fee can be equal to the nightly price. One hypothesis is that some prices are made to look more attractive by hiding part of the cost in the cleaning fee. To avoid this, we convert the cleaning fee into an estimated nightly rate based on the assumed length of stay appropriate to the method, i.e. for M4, the greater of the minimum stay and the average stay (assumed to be 3 nights). A discussion of cleaning fees is included in Appendix B (supplementary material). shows the distribution of adjusted nightly prices from M4 with the cleaning fee incorporated.
Figure 2. Distribution of adjusted nightly price per Airbnb listing for M4 method.
There are a few remaining caveats regarding the price. Firstly, our prices are based on observations between January and September in 2017. Ideally, we would want to observe the properties over the whole year to understand how their income varies between seasons and hence how it compares with standard monthly rents in the LTL sector. This does not seem to be a large problem because prices do not seem to vary much over the course of the year, and our data spans the majority of the year (including winter and summer months). The problem would be more severe if we had to work with data from a single scrape.
Another potential issue is that some properties offer discounts for bookings of a certain length e.g. a weekly or monthly price. While we have data on this, to properly apply it we would have to make additional assumptions about the length of stays. To avoid introducing additional complexity, we assume all nights sold at each property are sold for the nightly price. This would give an upper bound of the estimated income from a given number of nights sold.
Estimated monthly STL income
The last step is to estimate how much income each property would make in the month in which we observe it. To do this, we multiply the adjusted price by the estimated number of nights sold. As our aim is to compare the potential income from Airbnb to potential income from LTLs, we divide the monthly income by the number of bedrooms. Where the number of bedrooms is recorded as zero, representing studio flats, we assume one bedroom.
Spatial aggregation
To facilitate the examination of spatial patterns of revenue and to link this to deprivation data, we aggregate the Airbnb data into areal units. For this purpose, we choose to use Intermediate Zones. These are a Census-based geography with between 2,500 and 6,000 residents per zone, developed by the Scottish Government as a basis for reporting a range of small area statistics. There are 111 Intermediate Zones in Edinburgh. To assign Airbnb listings to an Intermediate Zone, we use the latitude and longitude information in the listings. These coordinates are perturbed by Airbnb to protect the privacy of hosts. The location given is within 150 m of the address. Using Intermediate Zones will reduce the number of misallocated properties compared to working with smaller geographies. Any misallocation should be random and hence represent noise rather than bias. Coordinates were matched to Intermediate Zone boundaries using R (R Core Team, Citation2018) in conjunction with the rgeos (Bivand & Rundel, Citation2019) package. The median revenue per bedroom was then calculated for each Zone, minimising the impact of outliers.
LTL (Zoopla) data
Public data are not readily available on rents in the LTL sector. In order to have up-to-date estimates at a sufficiently disaggregated level, we use data from the property listings website, Zoopla Plc. Listings were retrieved from Zoopla’s API by the Urban Big Data Centre under a licence arrangement which permits onward sharing with UK-based academics for non-commercial research. The UBDC database contains a number of fields. Of particular interest to us are whether the listing was rental or sale, the weekly rent, the date when the listing first appeared on the site, the postcode, the county, and the number of bedrooms.
We extract rental listings which appear in Edinburgh, which gives 15,150 properties after removal of duplicates. Weekly rents below £75 were removed. These listings included some properties with a rent of £0 and others which are for garages or rooms within a shared property. A small number of listings for more than £1500 per week were also excluded; all but one was described as a short-term or holiday let. Large properties with more than 10 bedrooms were removed (two listings). Listings include two dates: when the listing first appeared and when it ended. We excluded observations where the dates were missing, or where the end date was earlier than the start date, leaving a sample of 14,333 listings.
The data cover the years 2011 to 2018. (Livingston et al., Citation2021) note that data prior to 2012 tends to be less reliable and has more missing values. We use data for 2013-17. Ideally, we would use only data from 2017 i.e. the same year as our Airbnb data. However, to increase the sample size we use data for this four-year period, leaving a total of 13,116 listings. Since we are interested in the spatial distribution or relative prices between areas, we adjust all rents so that the mean rent in each year is equal to that for 2017, removing the effects of rental price inflation. shows the rent distribution with weekly figures converted to monthly for comparison with the Airbnb estimates.
Figure 3. Distribution of monthly rent.
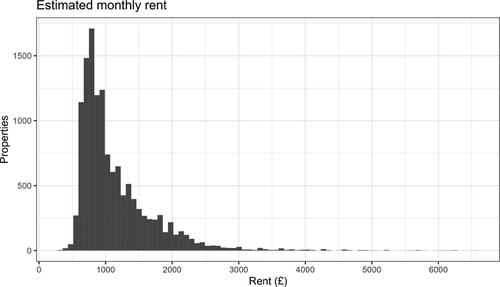
As with the Airbnb data, we divide the monthly rent by the number of bedrooms, assuming one bedroom where there are zero bedrooms recorded. We use the postcode to match listings to Intermediate Zones using the postcode directory from May 2017, provided by the UK Data Service (UKDS). The median rent per bedroom was then calculated for each Zone.
Vulnerability and deprivation
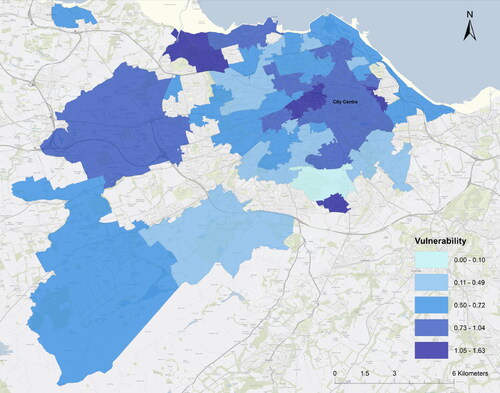
We are interested in identifying the Zones which are most vulnerable to seeing properties shift from LTL to STL markets. We capture this through our vulnerability index, calculated by dividing the median estimated Airbnb income by the median rent in the LTLs sector (both expressed per bedroom). We remove Zones where the index is based on fewer than five observations for either the numerator or denominator to reduce noise. A high value on this index suggests that the income from STL activity is large compared with that from LTL. For reasons noted above, this is not measuring whether income from STL is higher in absolute terms but indicating which locations within the city have relatively higher incomes from STL compared with LTL.
To explore variations across the city, we use maps but also two measures of neighbourhood characteristics. The first is distance (crow-flies or Euclidean) from the city centre, reduced to quartiles. The second is deprivation, based on the Scottish Government’s official measure, the Scottish Index of Multiple Deprivation (SIMD). In particular, we use the percentage of the population in an Intermediate Zone classed as ‘income deprived’ i.e. in receipt of a low-income benefit and with incomes below a given threshold (Scottish Goverment, Citation2020). This is also reduced to quartiles.
Results
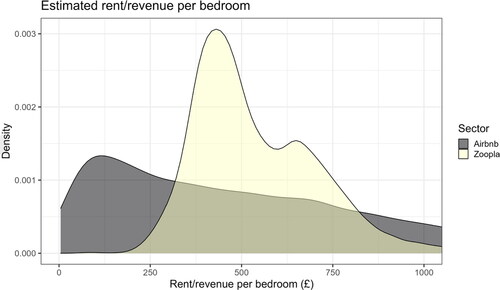
We begin by comparing the distribution of estimated monthly income from Airbnb with monthly LTL rents. Density plots for both distributions are shown in . Airbnb income is more widely distributed than rental income. There is a peak in the distribution at around £125 per month, suggesting that many properties are let out for only a small proportion of time. There are, however, a substantial number of listings with much higher earnings. Rents for LTLs follow a more expected distribution with a clear peak and longer tails.
Figure 4. Distribution of rent/income per bedroom.
The geographic distribution of the vulnerability index is shown in . As might be expected, the index suggests that core of the city centre would be a particularly attractive location. This is the region where the great majority of Airbnb listings tend to be found already. Some locations outside the centre are also highlighted as being more vulnerable. For instance, the zone to the north-west with a high value on the index is located between the city centre and the airport, providing easy access to both and to a nearby beach. Note that many of the Intermediate Zones further out from the city centre have missing data due, mainly due to a lack of Airbnb properties.
Figure 5. Spatial distribution of Vulnerability index in Edinburgh.
In , we consider how vulnerability relates to income deprivation and distance from the city centre. We split the zones into quartiles based on the percentage of people who are income deprived (‘4’ is most deprived) and distance to centre (‘4’ is furthest from the centre). We calculate the mean vulnerability index for each of the 16 possible combinations of these groups (shown in table). Darker colours represent lower values of the index. The broad pattern is that vulnerability appears highest for neighbourhoods closer to the centre and with greater deprivation. The highest value (i.e. the places with strongest incentive to convert from LTL to STL) is for areas close to the centre with the second-highest level of deprivation, closely followed by the most deprived Zones in the same part of the city. STL rents are at their highest relative to LTLs in these areas.
Figure 6. Income deprivation, distance to the city centre and vulnerability to Airbnb.
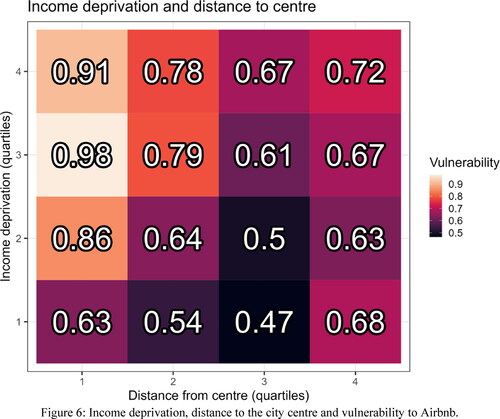
Our results therefore suggest that the rise in the popularity of STLs could well result in a process of tourism-led gentrification, whereby poorer people are crowded out by wealthier visitors. This could contribute to the suburbanisation of poverty which has been observed in several UK cities (Bailey & Minton, Citation2018). These trends are problematic in themselves, as they represent a disruption of existing community and social ties rather than voluntary or chosen moves. There is also evidence that poor households relocating to suburban areas in the UK tend to benefit less from suburban amenities such as better quality schools than middle-class households traditionally associated with these areas (Bailey et al., Citation2019).
Robustness check
Unfortunately, there is no ground truth measure of STL occupancy or income to compare our data with. One approach to check robustness is to investigate whether areas with a higher level of vulnerability experienced a higher growth in Airbnb in the subsequent years. To do this, we utilise data from InsideAirbnb for 2019, covering January-June. The data were cleaned using the same rules as for 2017. To make the 2017 data comparable at this stage, we restrict this part of the analysis to listings for January-June in that year as well. We hypothesise that areas with higher vulnerability will have seen more growth in the number of homes listed on Airbnb. shows change in the number of Airbnb properties in each Intermediate Zone 2017-19 (vertical axis) against the vulnerability index in 2017 (horizontal axis). Each point represents an Intermediate Zone, with the size of the points representing the number of Airbnb properties in 2017.
Figure 7. Growth in Airbnb properties from 2017-2019 versus vulnerability in 2017.
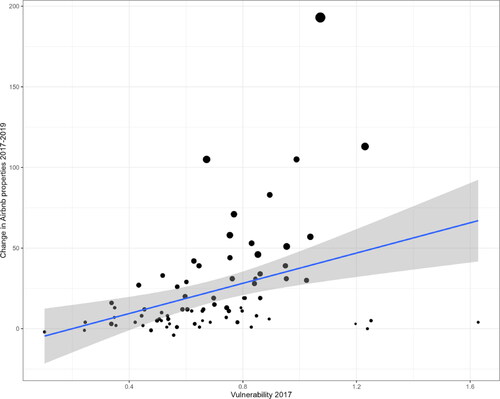
Overall, shows the expected pattern: Intermediate Zones with a higher value for the vulnerability index tended to see a larger increase in the number of Airbnb properties. The second feature in the data is that zones with a larger presence of Airbnb in 2017 (large points) also tended to see a larger increase in the absolute number of Airbnb properties. The correlation between the index and growth is 0.38 (p = 0.001) but this is partly a reflection of the small number of zones with high vulnerability and low growth. All are on the fringes of the city boundaries, far from the centre and all had very few listings in 2017. The measure of vulnerability here is therefore liable to more error but there may also be other factors restricting the growth of STLs in these locations. Omitting these four, the correlation is 0.59. We include a sensitivity analysis in Appendix C (supplementary material) using all four methods of estimating occupancy and hence vulnerability. All show strong positive correlations with listing growth.
Conclusions and limitations
Many cities, like Edinburgh, face rising pressure from tourism-led gentrification facilitated by ‘sharing’ platforms like Airbnb. The increase in STLs raises concerns that this growth is significantly impacting the welfare of residents, in particular by reducing the supply of LTL stock so driving up rents, with the effects concentrated into specific neighbourhoods most attractive to short-term visitors (Barron et al., Citation2021; Gant, Citation2016; Garcia-López et al., Citation2020; Grisdale, Citation2021). The lack of data on the sector, however, hinders research efforts (Hoffman & Heisler, Citation2020), which in turn makes it more difficult to argue for effective regulation. Platforms such as Airbnb seemingly take steps to ensure access to data is restricted. Some research has been conducted using proprietary datasets acquired under (paid for) licences, notably from AirDNA data (Grisdale, Citation2021; Wachsmuth & Weisler, Citation2018; Yrigoy, Citation2019). Studies have shown that these data can identify neighbourhoods most vulnerable to STL expansion but access to the data is restricted by costs and methodological details are opaque.
This paper explored the possibility of employing open data from InsideAirbnb to define a measure of neighbourhood vulnerability to growth in STL. While these data are limited in the temporal detail, we show that they can be used to estimate incomes from STL activity and, through comparison with LTL rents, to produce a vulnerability index. In our application to Edinburgh, we show that this index predicts subsequent growth in STL activity. Given the relative sparsity of the data and the restrictions within the Airbnb site, we need to make a number of significant assumptions about occupancy rates and length of stay. While these have a major impact on absolute estimates of income, they do not alter the relative picture.
From a substantive point of view, our analysis of the Edinburgh market showed that the areas most vulnerable to the growth in STLs were more deprived locations close to the city centre. A trend of low-income groups being driven out of inner areas has already been observed in many UK cities (Bailey & Minton, Citation2018) and it is likely that STLS have become a further factor in this process. Many governments and local authorities are considering legislation or have begun to legislate to control the growth of this activity. This analysis of the geography of vulnerability and growth may help policymakers to understand which neighbourhoods need the most protection or enforcement action and to help formulate effective policies.
While we demonstrate the value of existing open data for research and policy, there remain limitations with this source. This is not to denigrate the achievements of InsideAirbnb. They have undoubtedly made an enormous contribution to opening up debate about this otherwise ‘hidden’ activity. However, due to the number of assumptions which go into our measures, we should be careful in claims made about absolute levels of activity based on these data even if we still have confidence in using them as a guide to where pressures are likely to be greatest.
Better data are clearly required. The best solution would be for platforms to be required to publish full details of activity levels, including details on occupancy rates in particular. Some countries and cities require individuals with STLs to register, including Ireland, Amsterdam and, Barcelona and Scotland (Scottish Government, Citation2019). Such registration schemes might be a further source of valuable data but only provided that access to data for statistical and research purposes (suitably anonymised) is properly embedded in the regulations, although it is unclear if this would ever provide access to information on rents or occupancy levels to enable proper estimates of income.
The remaining option is for researchers to scrape their own data from Airbnb and other platforms. This would allow more control over the location and frequency of scrapes, reducing the number of assumptions we need to make, yielding better estimates of occupancy and income. Platforms may still obscure information on bookings but higher scraping frequency and longer periods of observation provide a means to improve income estimation. Such an approach appears to comply with legal provisions in relation to copyright law provided data collection is for research purposes (Burrow Citation2021) and would greatly improve transparency in methods compared with the proprietary data. It is less clear that the law supports wider sharing of these data or their use directly by policy makers, and there remain significant technical and resource challenges in setting up and maintaining such scraping. The reliance on open data is therefore likely to persist for some time so it is important we learn how best to exploit these to understand the development of STL activity.
Supplemental Material
Download PDF (493.3 KB)Supplemental Material
Download PDF (451.8 KB)Supplemental Material
Download PDF (626.3 KB)Disclosure statement
No potential conflict of interest was reported by the authors.
Additional information
Funding
Notes
References
- Adamiak, C. (2022) Current state and development of Airbnb accommodation offer in 167 countries, Current Issues in Tourism, 25, pp. 3131–3149.
- Amore, A., de Bernardi, C. & Arvanitis, P. (2020) The impacts of Airbnb in Athens, Lisbon and Milan: A rent gap theory perspective, Current Issues in Tourism, 25, pp. 1–14.
- Amos, I. (2018) Edinburgh’s ‘rampant’ Airbnb growth ‘hollowing out’ city. The Scotsman (accessed December 28 2018).
- Bailey, N. & Minton, J. (2018) The suburbanisation of poverty in British cities, 2004–16: Extent, processes and nature, Urban Geography, 39, pp. 892–915.
- Bailey, N., Stewart, J. L. & Minton, J. (2019) The welfare consequences of the suburbanisation of poverty in UK cities: Air pollution and school quality, Urban Development Issues, 61, pp. 15–32.
- Bao, H. X. & Shah, S. (2020) The impact of home sharing on residential real estate markets, Journal of Risk and Financial Management, 13, pp. 161.
- Barron, K., Kung, E. & Proserpio, D. (2018) The Sharing Economy and Housing Affordability: Evidence from Airbnb. Paper presented at the EC.
- Barron, K., Kung, E. & Proserpio, D. (2021) The effect of home-sharing on house prices and rents: Evidence from Airbnb, Marketing Science, 40, pp. 23–47.
- Bivand, R. & Rundel, C. (2019) rgeos: Interface to geometry engine - Open Source (‘GEOS’) (Version 0.5-2). Available at https://CRAN.R-project.org/package=rgeos (accessed 6 February 2023).
- Boyd, D. & Crawford, K. (2012) Critical questions for big data: Provocations for a cultural, technological, and scholarly phenomenon, Information, Communication & Society, 15, pp. 662–679.
- Burrow, S. (2021) The Law of Data Scraping: A review of UK law on text and data mining. REATe Working Paper 2021/2, Zenodo.
- Cocola-Gant, A. & Gago, A. (2019) Airbnb, buy-to-let investment and tourism-driven displacement: A case study in Lisbon, Environment and Planning A: Economy and Space, 53(7), pp. 1671–1688.
- Core Team, R. (2018) R: A Language and Environment for Statistical Computing (Version 3.5.2 “Eggshell Igloo”). Vienna, Austria. Available at https://www.R-project.org/ (accessed 7 February 2023).
- Crommelin, L., Troy, L., Martin, C. & Pettit, C. (2018) Is Airbnb a sharing economy superstar? Evidence from five global cities, Urban Policy and Research, 36, pp. 429–444.
- Deboosere, R., Kerrigan, D. J., Wachsmuth, D. & El-Geneidy, A. (2019) Location, location and professionalization: A multilevel hedonic analysis of Airbnb listing prices and revenue, Regional Studies, Regional Science, 6, pp. 143–156.
- DiNatale, S., Lewis, R. & Parker, R. (2018) Short-term rentals in small cities in Oregon: Impacts and regulations, Land Use Policy, 79, pp. 407–423.
- Dogru, T., Hanks, L., Mody, M., Suess, C. & Sirakaya-Turk, E. (2020) The effects of Airbnb on hotel performance: Evidence from cities beyond the United States, Tourism Management, 79, pp. 104090.
- Dogru, T., Mody, M., Line, N., Suess, C., Hanks, L. & Bonn, M. (2020) Investigating the whole picture: Comparing the effects of Airbnb supply and hotel supply on hotel performance across the United States, Tourism Management, 79, pp. 104094.
- Evans, A., Graham, E., Rae, A., Robertson, D. & Serpa, R. (2019) Research into the impact of short-term lets on communities across Scotland.
- Ferreri, M. & Sanyal, R. (2018) Platform economies and urban planning: Airbnb and regulated deregulation in London, Urban Studies, 55, pp. 3353–3368.
- Gant, A. C. (2016) Holiday rentals: The new gentrification battlefront, Sociological Research Online, 21, pp. 112–120.
- Garcia-López, M.-À., Jofre-Monseny, J., Martínez-Mazza, R. & Segú, M. (2020) Do short-term rental platforms affect housing markets? Evidence from Airbnb in Barcelona, Journal of Urban Economics, 119, pp. 103278.
- Georgie Cosh, G. L. A. (2020) Short-term and holiday letting in London. Available at GLA Housing and Land: https://www.london.gov.uk/sites/default/files/housing_research_note_4-_short-term_and_holiday_letting_in_london.pdf
- Gotham, K. F. (2005) Tourism gentrification: The case of New Orleans’ vieux carre (French Quarter), Urban Studies, 42, pp. 1099–1121.
- Goverment, S. (2020) SIMD 2020 technical notes. Available at https://www.gov.scot/binaries/content/documents/govscot/publications/statistics/2020/09/simd-2020-technical-notes/documents/simd-2020-technical-notes/simd-2020-technical-notes/govscot%3Adocument/SIMD%2B2020%2Btechnical%2Bnotes.pdf (accessed 8 February 2023).
- Grabher, G. & König, J. (2020) Disruption, embedded. A Polanyian framing of the platform economy. Sociologica, 14, pp. 95–118.
- Grisdale, S. (2021) Displacement by disruption: Short-term rentals and the political economy of “belonging anywhere” in Toronto, Urban Geography, 42, pp. 654–680.
- Gurran, N. & Phibbs, P. (2017) When tourists move in: How should urban planners respond to Airbnb?, Journal of the American Planning Association, 83, pp. 80–92.
- Hoffman, L. M. & Heisler, B. S. (2020) Airbnb, Short-Term Rentals and the Future of Housing (London: Routledge).
- Kaplan, R. A. & Nadler, M. L. (2015) Airbnb: A case study in occupancy regulation and taxation, The University of Chicago Law Review, 82, pp. 103.
- Katsinas, P. (2021) Professionalisation of short-term rentals and emergent tourism gentrification in post-crisis Thessaloniki, Environment and Planning A: Economy and Space, 53, pp. 1652–1670.
- Lazer, D., Pentland, A., Adamic, L., Aral, S., Barabási, A.-L., Brewer, D., Christakis, N., Contractor, N., Fowler, J., Gutmann, M., Jebara, T., King, G., Macy, M., Roy, D. & Van Alstyne, M. (2009) Life in the network: The coming age of computational social, Science, 323, pp. 721–723.
- Lee, D. (2016) How Airbnb short-term rentals exacerbate Los Angeles’s affordable housing crisis: Analysis and policy recommendations, Harvard Law & Policy Review, 10, pp. 229.
- Leshinsky, R. & Schatz, L. (2018) “I don’t think my landlord will find out:” Airbnb and the challenges of enforcement, Urban Policy and Research, 36, pp. 417–428.
- Livingston, M. & Clark, J. (2019) Living in the urban renaissance? Opportunity and challenge for 21st-century Glasgow, in: K. Kintrea & R. Madgin (Eds) Transforming Glasgow: Beyond the Post-Industrial City, p. 101 (Bristol: Policy Press).
- Livingston, M., Pannullo, F., Bowman, A., Scott, M. & Bailey, N. (2021) Exploiting new forms of data to study the private rented sector: Strengths and limitations of a database of rental listings, Journal of the Royal Statistical Society: Series A (Statistics in Society), 184, pp. 663–682.
- Oskam, J. A. (2020) Eiffel Tower and Big Ben, or’off the beaten track’? Centripetal demand in Airbnb, Hospitality & Society, 10, pp. 127–155.
- Quattrone, G., Proserpio, D., Quercia, D., Capra, L. & Musolesi, M. (2016) Who benefits from the “Sharing” economy of Airbnb? Paper presented at the Proceedings of the 25th international Conference on World Wide Web.
- Rae, A. (2017) Analysis of short-term lets data for Edinburgh. Available at https://greens.scot/sites/default/files/AnalysisShortTermLetsDataforEdinburgh_AlasdairRae_PDF-FINAL_2.pdf (accessed 7 February 2023).
- Robertson, D., Oliver, C. & Nost, E. (2020) Short-term rentals as digitally-mediated tourism gentrification: Impacts on housing in New Orleans, Tourism Geographies, 24(6–7), pp. 1–24.
- Rozena, S. & Lees, L. (2021) The everyday lived experiences of Airbnbification in London, Social & Cultural Geography, 24(2), pp. 1–21.
- Sadowski, J. (2020) “The Internet of Landlords: Digital Platforms and New Mechanisms of Rentier Capitalism.” Antipode, 52(2), pp. 562–580.
- San Francisco, B. o. S. (2016) Short Term Rentals 2016 Update. Available at Budget and Legislative Analyst: https://sfbos.org/sites/default/files/FileCenter/Documents/55575-BLA.ShortTermRentals%20040716.pdf (accessed 8 February 2023).
- Schäfer, P. & Braun, N. (2016) Misuse through short-term rentals on the Berlin housing market, International Journal of Housing Markets and Analysis, 9, pp. 287–311.
- Schlagwein, D., Schoder, D. & Spindeldreher, K. (2020) Consolidated, systemic conceptualization, and definition of the “sharing economy”, Journal of the Association for Information Science and Technology, 71, pp. 817–838.
- Schor, J. (2016) Debating the sharing economy, Journal of Self-Governance and Management Economics, 4, pp. 7–22.
- Scottish Government. (2019) Short-term lets: Consultation. Available at https://www.gov.scot/publications/short-term-lets-consultation-regulatory-framework-scotland/pages/1/ (accessed 8 February 2023).
- Semi, G. & Tonetta, M. (2021) Marginal hosts: Short-term rental suppliers in Turin, Italy, Environment and Planning A: Economy and Space, 53, pp. 1630–1651.
- Shaw, J. (2020) Platform real estate: Theory and practice of new urban real estate markets, Urban Geography, 41, pp. 1037–1064.
- Stulberg, A. (2016) Airbnb probably isn’t driving rents up much, at least not yet. FiveThirtyEight.com. Available at https://fivethirtyeight.com/features/airbnb-probably-isnt-driving-rents-upmuch-at-least-not-yet/ (accessed 6 March 2017).
- VisitScotland. (2018). Insight Department: Visitors to Edinburgh & the Lothians . Edinburgh, Scotland.
- Wachsmuth, D., Chaney, D., Kerrigan, D., Shillolo, A. & Basalaev-Binder, R. (2018) The high cost of short-term rentals in New York City. McGill University. Available at https://www.mcgill.ca/newsroom/files/newsroom/channels/attach/airbnb-report.pdf (accessed 8 February 2023).
- Wachsmuth, D. & Weisler, A. (2018) Airbnb and the rent gap: Gentrification through the sharing economy, Environment and Planning A: Economy and Space, 50, pp. 1147–1170.
- Wegmann, J. & Jiao, J. (2017) Taming Airbnb: Toward guiding principles for local regulation of urban vacation rentals based on empirical results from five US cities, Land Use Policy, 69, pp. 494–501.
- Wray, S. (2020) Airbnb could be forced to share data with European cities. Available at https://cities-today.com/airbnb-could-be-forced-to-share-data-with-european-cities/ (accessed 8 February 2023).
- Yrigoy, I. (2019) Rent gap reloaded: Airbnb and the shift from residential to touristic rental housing in the Palma Old Quarter in Mallorca, Spain, Urban Studies, 56, pp. 2709–2726.