?Mathematical formulae have been encoded as MathML and are displayed in this HTML version using MathJax in order to improve their display. Uncheck the box to turn MathJax off. This feature requires Javascript. Click on a formula to zoom.
Abstract
The suburbanization of poverty has been noted in many advanced industrial nations including the UK. Theory focuses on economic and labour market restructuring combined with processes of market- and/or state-led housing change. This paper examines the contributions of housing and welfare reforms. In the UK, housing policy has driven low-income households increasingly to find accommodation in the private rental sector at the same time that welfare reforms have constrained the rents these households can afford. This paper traces the spatial consequence of these reforms, drawing on a novel combination of Government data and a database of private rental adverts. Up to 2011, the shift from social to private renting for low-income households was relatively neutral in its impacts on suburbanization. Since then, low-income households in private renting have been increasingly pushed to less central locations as rents in more central areas have risen faster. The role played by housing and welfare policy in the suburbanization of poverty needs wider consideration.
Introduction
The suburbanization of poverty is an international phenomenon which has been documented in many of the major cities of the US (Cooke & Denton, Citation2015; Kneebone & Berube, Citation2014), Canada (Hulchanski et al., Citation2007), Australia (Pawson et al., Citation2015; Randolph & Tice, Citation2017), the UK (Bailey & Minton, Citation2018; Kavanagh et al., Citation2016; Zhang & Pryce, Citation2020) and the Netherlands (Hochstenbach & Musterd, Citation2018, Citation2021). In these countries, it represents an historic inversion of the urban form for most cities, long characterized by a concentration of poverty into older, inner urban areas. Although debate continues about the consequences for the welfare of low-income households, most researchers have seen the process in negative terms. It represents the disruption of established working-class communities and the movement of low-income groups to locations with worse access to employment as well as worse access to key public or voluntary sector services, including public transport, and other important amenities (Bailey et al., Citation2019; Kneebone & Berube, Citation2014; Pawson et al., Citation2015; Zhang & Pryce, Citation2020).
Theoretical explanations for this historic shift have focussed on market restructuring processes: in urban labour markets, the weakening economic position of less educated or less skilled groups, and in urban housing markets, the rising demand for inner city locations from higher-income groups (Hochstenbach & Musterd, Citation2018). The aim of this paper, however, is to examine the role played by public policy, and specifically by housing and welfare reforms. In doing so, it picks up on the long-standing debates about the role of such policies in shaping the spatial structure of cities (Musterd & Ostendorf, Citation1998) and echoes the focus in the gentrification literature on the active role of the state in those processes (Lees et al., Citation2016; Smith, Citation2002). Others have begun to highlight the role of housing and welfare policies in poverty suburbanization, notably in German cities (Weck et al., Citation2023). By focussing on the UK case, we also provide additional evidence on the consequence of the re-growth of the PRS in this country for the welfare of low-income households (Bailey, Citation2020).
The paper identifies separately: (i) how housing policy changes which pushed low-income households from social to private renting (decommodified to commodified) impacted on the spatial distribution of these households; and (ii) how welfare reforms which restricted personal housing allowances for low income households then further impacted on the spatial distribution of those in private renting. The paper is particularly novel in exploiting a wide range of data sources to address these questions, including data from a large database of online rental property listings. In addition, it makes methodological contributions to the measurement of ‘centrality’, extending the approach developed by Zhang and Pryce (Citation2020), while empirically it updates evidence on suburbanization trends in the UK from Bailey and Minton (Citation2018) study.
The structure of the rest of the paper is as follows. In the next section, after reviewing research on why the suburbanization of poverty matters for welfare, we summarize existing theories on the drivers of suburbanization before examining the contribution of housing and welfare reforms to urban structure, introducing the particular case of recent reforms in the UK. This generates the specific research questions which this paper addresses. In the third section, we introduce our data sources and methods. The fourth describes the results while the last provides conclusions and discussion.
Background
Why the suburbanization of poverty matters
The possible consequences of poverty suburbanization are widely discussed although less commonly assessed to date. On one hand, the shift can be viewed as potentially positive. The ‘suburbs’ have long been seen as aspirational residential locations, particularly for families, representing safety, security and status in comparison with older inner-city neighbourhoods (Kneebone & Berube, Citation2014). Since jobs have been decentralizing for many years, more suburban locations may offer better access to employment. Environmental quality, notably air quality, tends to be better in lower density, less central locations (Bailey & Minton, Citation2018) and we might expect a range of publicly-provided services to be better in more affluent suburban locations due to a variety of mechanisms which influence relative levels of provision, from differences in tax bases to the social capital of the ‘sharp-elbowed’ middle classes which tends to skew such public expenditures in their favour (Hastings et al., Citation2014).
More commonly, however, the literature emphasizes the downsides of suburbanization for low-income groups. On the one hand, there is a consideration of what is lost through gentrification as established working class communities are disrupted and displaced, physically and culturally (Paton, Citation2009). On the other, questions are raised about whether suburban locations offer the same opportunities for low-income groups as they do for more affluent ones. Services designed to meet the needs of low-income groups may be relatively under-developed in more suburban locations (Kneebone & Berube, Citation2014) while access to general services and other opportunities can be greatly reduced if households do not have access to private cars. Low-income households may be forced to divert scarce resources to running a car to cope with suburban living, creating other welfare problems as a result (Mattioli, Citation2017).
Few studies have attempted to assess the impacts of suburbanization directly. Some provide indirect evidence that low-income groups are likely to realize few of the supposed benefits of suburban living. They note that the kinds of areas which low-income households are moving to are likely to be the lower-quality older, inner suburbs (Cooke & Denton, Citation2015) or those with higher densities (Bailey & Minton, Citation2018). One study for UK cities examined air quality and quality of schools, comparing suburban location where poverty was rising with inner urban locations where poverty was falling (Bailey et al., Citation2019). This found a mixed picture with more improvements in relation to the physical environment than in public services. Another UK study shows that the suburbanization of low-income households is associated with a clear loss in access to employment and to a range of amenities (Zhang & Pryce, Citation2020).
Drivers of the suburbanization of poverty
The major forces driving the suburbanization of poverty are the linked restructuring processes underway in urban labour and housing markets. Labour markets are becoming increasingly polarized under the effects of globalization and skill-biased technological change (Autor et al., Citation2003; Goos et al., Citation2009). Earnings and income polarization then shape the ability of different groups to compete for housing in the market with richer groups increasingly able to outbid poorer (Hulchanski et al., Citation2007; Randolph & Tice, Citation2017). The Global Financial Crisis (GFC) compounded the situation by reducing access to mortgage finance for lower-income groups in particular (Forrest & Hirayama, Citation2015). As detailed in the gentrification literature, the growing affluence at the upper end combines with the demand for urban living to drive the restructuring of urban housing markets, notably through reinvestment in many inner urban areas and hence their gentrification, pricing out lower income groups (Smith, Citation2002; Van Gent, Citation2013). The state may also play an important role in encouraging and facilitating this process in the name of ‘urban regeneration’ (Lees et al., Citation2016; Smith, Citation2002). Initial state investment and master planning may be designed to pave the way for larger-scale private sector-funded investments and so transform locations not by improving conditions for existing residents but by driving a change in the population (Bailey & Robertson, Citation1997; Lees et al., Citation2016).
Other explanations focus more directly on the role of the state, specifically through the impact of reforms of housing and welfare policy on urban restructuring. There is of course a longer literature exploring the links between housing and welfare regimes, and urban structure (Musterd & Ostendorf, Citation1998), although the more recent literature on ‘austerity urbanism’ (Hastings et al., Citation2017; Peck, Citation2012) has paid rather less attention to the spatial implications of these processes. These policies are key to understanding differences between European and US cities, in particular. In Europe, greater state intervention to limit income inequalities and greater provision of ‘income-in-kind’ through public services or social housing provision both serve to limit spatial inequalities.
The housing and welfare policy changes witnessed in recent decades are therefore likely to have contributed to a widening of spatial inequalities. Policies adopted across a number of countries have seen the recommodification of housing combined with reductions in welfare support (Hick & Stephens, Citation2023; Kadi & Ronald, Citation2014; Musterd et al., Citation2017). Measures include reductions in social housing through privatization along with reductions in rent controls for the private sector through deregulation. Low-income groups have become more exposed to private markets as a result with likely consequences for suburbanization. The changes are perhaps especially start in the UK context which we explore in the following two sections.
Housing policy and suburbanization in the UK
On the housing side, the scale of recommodification in rental housing is particularly significant here. Historically, the UK was quite unusual in its combination of housing and welfare policies. When classified in terms of its approach to labour market protections, for example, the UK sits clearly in the ‘Anglo’ group of countries as an example of a ‘liberal’ welfare regime (Esping-Andersen, Citation1999) with rather minimal levels of state provision, heavily reliant on means-testing, and high-income inequality as a result. From other perspectives, notably housing (but also health), the UK appears rather different. Other countries in the Anglo group such as the US, Australia, Canada or New Zealand have a SRS which is never more than 5 per cent of the total, and often much less (Hulse, Citation2003). In the UK, by contrast, the SRS was home to one-in-three households at its peak around 1981. While it has declined steadily since, driven by heavily-discounted sales to sitting tenants, the UK SRS still houses more than one-in-six households.Footnote1
By the 1980s, the private rented sector (PRS) had been pushed into a very marginal role in the housing system, reflecting regulation of the sector which discouraged investment and fiscal support for alternatives, both home ownership and social renting, which reduced demand (Kemp, Citation2015). In 1991, the PRS accounted for just 9 per cent of households. The scale and pace of the re-growth of private renting has therefore been particularly significant in the UK (Lennartz et al., Citation2016). By 2017, it had rebounded to 19 per cent (Bailey, Citation2020). Housing policy was a significant factor here, with successive governments instigating policies to encourage investment through deregulation (i.e. the reduction of tenants’ rights) and support for mortgage lending to landlords. Wider forces also account for a significant part of the change, notably the relatively poor returns available on other forms of investment available to small investors in this period (Bailey, Citation2020; Kemp, Citation2015). Of critical importance for this paper, the expanded PRS has come to play a much greater role in housing low-income households in a way that policy never envisaged (Bailey, Citation2020). This partly reflects the declining availability of social housing and partly the reductions in access to home ownership following the GFC. By 2017/18, 42 per cent of poor adults under 40 lived in private renting, double the proportion of 20 years earlier (Bailey, Citation2020).
The shift from social to private renting has implications for the suburbanization of poverty due to the very different rent structures in the two systems. In the UK SRS, rent levels are generally quite undifferentiated, despite reforms in the early 2000s, reflecting basic property characteristics such as type, size or age but paying relatively little attention to other qualities, especially location (Mullins & Murie, Citation2006). In the PRS, by contrast, rents reflect the full range of attributes through market pricing. This does not necessarily mean that more central locations are more expensive. While central land prices will be higher, properties there may still be cheaper if they are older, smaller and in worse condition. Nevertheless, over the period examined here, we would expect prices in more central areas to rise faster, reflecting the growing demand for inner urban locations in the housing system and the resulting reinvestment and gentrification of these locations.
Welfare policy and suburbanization in the UK
The growing exposure of low-income households to the market rental sector might be expected to have consequences for where these groups could afford to live but the situation has been compounded by parallel reforms to welfare benefits. The UK chose a particularly aggressive form of ‘austerity’ in the wake of the GFC, placing the vast majority of the burden of meeting the fiscal deficit on reducing expenditures, particularly on welfare benefits, rather than raising taxes (Bailey et al., Citation2015). The cuts to benefits have included substantial reductions in housing allowances (Beatty & Fothergill, Citation2014).
The UK has long supported low-income households through means-tested housing allowances, termed Housing Benefit (HB) since 1982.Footnote2 From the 1980s, successive governments moved support away from capital (‘bricks-and-mortar’) subsidies to the SRS and towards more targeted individual support (Kemp, Citation1994), a move seen widely across developed countries from the 1970s (Sanderson & Wilson, Citation2017). This shift, combined with the increasing proportions accommodated in the more expensive PRS, drove up total expenditures for these allowances (Clair, Citation2022).
In 2008, the Labour Government initiated major changes for PRS tenants (Sanderson & Wilson, Citation2017). Dividing the country into zones termed Broad Rental Market Areas (BRMAs), the amount of HB which could be claimed was limited to the median rent for the given size of property in that area, up to a maximum of five bedrooms. Government agencies in different parts of the UK were charged with surveying markets to determine limits. The use of BRMAs rather than a single national rate is critical since it enables low-income households to continue to secure accommodation (in theory, at least) in any area of the country despite wide variations in regional rents. BRMA boundaries have a basis in functional geographies, being described as reflecting ‘areas in which people live and access services’ (Beatty et al., Citation2014, p. 10), although they bear little relationship to other functional geographies such as Travel-to-Work Areas (TTWAs) derived from commuting flows. In some cases, most notably London, one city-region may be covered by multiple BRMAs meaning that households are able (in theory) to secure accommodation across a wide range of locations.
The Conservative-Liberal Democrat Coalition Government which took office in 2010 accelerated the reductions in HB entitlements (Beatty et al., Citation2014; Clair, Citation2022; Kleynhans & Weekes, Citation2019). From April 2011, maximum eligible rents were reduced from the median to the 30th percentile for each BRMA and the maximum size reduced to four bedrooms. From 2012 through to 2019, annual increases in eligible rents were constrained so that, in most BRMAs, they fell progressively below the 30th percentile. Although there was some room for local variation, the rates were: frozen at the level for the previous year in 2012; increased by a maximum of the Consumer Price Index in 2013; increased by a maximum of 1% in 2014 and 2015; and frozen from 2016 for four years. While PRS rents increased by 14 per cent between 2012 and 2019, the eligible rent for a two-bedroom property rose by just 6 per cent (Kleynhans & Weekes, Citation2019).
In 2014, the UK Government introduced a major change in means-tested welfare benefits with a new benefit, Universal Credit (UC), replacing six previous benefits (Hardie, Citation2021). Claims for HB were included as part of UC. While HB entitlements did not change and the same limits by BRMA continued to apply, other aspects of UC were seen as contributing to greater housing insecurity and potentially reducing access to the PRS. These included a five-week waiting period for initial payments and the payment of HB to the tenant monthly rather than direct to the landlord fortnightly. For all renters, UC has been shown to have caused an increase in rent arrears and eviction actions by landlords (Hardie, Citation2021, Citation2022).
Summary and research questions
Housing and welfare policies in the UK since 2011 have combined to push low-income households from the SRS to the PRS while simultaneously limiting eligibility for housing allowances in the latter. The implication of these changes for the suburbanization of poverty is not necessarily straightforward. If there is a negative rent gradient (i.e. PRS rents fall with distance from urban centres), reductions in HB entitlements will tend to push low-income households out of more central locations. However, two factors complicate matters. First, as discussed above, negative gradients in house prices or rents cannot be taken for granted. Second, city-regions may be divided into multiple BRMAs and this acts as a major bulwark, ensuring (in theory) that low-income groups continue to be able to access a wide variety of locations. The aim of this paper is therefore to examine the impact of these changes on where low-income households live within UK cities, focussing on centrality. We do this by addressing three related research questions on the structure of PRS markets, the location of PRS listings affordable to low-income households, and the distribution of low-income PRS households respectively:
RQ1: Do UK cities exhibit negative rent gradients in the PRS and have these steepened over the period examined here?
RQ2: Have new lets in the PRS affordable to those on HB tended to become more decentralized over this period?
RQ3: Has the distribution of PRS households on HB moved outwards in this period, relative to those in the SRS?
Data and methods
Geographical units
Following previous UK research (Bailey & Minton, Citation2018; Zhang & Pryce, Citation2020), we define city-regions in terms of official TTWAs, based on 2011 commuting flows (ONS, Citation2015). These are broad enough to capture the relationships between core city, suburb and rural fringes, including surrounding commuter belts. Narrower definitions such as physical city limits or administrative city boundaries would mean we miss these parts of the process. We restrict analysis to TTWAs with a 2020 population greater than 100,000 (N = 137) to remove places which are likely to lack any sizeable urban centre. Within each TTWA, we use small area geographies termed Lower Super Output Areas (LSOAs) in England/Wales or Datazones (DZs) in Scotland. Current units are based on populations at the 2011 Census (N = 38,847 in our set of TTWAs) with LSOAs in the range 1000-2000 and DZs 500-1000. For simplicity, we refer to all as LSOAs.
Households on HB, 2011–19
We use receipt of HB to identify low-income households in rental accommodation. HB is a means-tested benefit with additional eligibility rules including savings limits. There is some underclaiming of HB, with DWP (Citation2020) estimating take-up in 2018/19 at 81 per cent of eligible households, down slightly from 83 per cent in 2012/13. Rates of claiming are higher for social than for private renting (88 and 69 per cent respectively, difference 19 per cent), the gap having widened from 2012/13 (87 and 78 per cent respectively, difference 9 per cent). On the other hand, the non-claiming households appear less poor since the proportion of eligible HB claimed is higher in both tenures (92 and 80 per cent respectively in 2018/19). In itself, underclaiming does not impact on our analysis since we are concerned with changes within TTWAs over time. Changes in underclaiming would potentially matter but only if they were not evenly distributed over the TTWAs. Overall, therefore, we do not believe this affects the results presented here.
Data on HB claims at LSOA level are obtained through DWP’s StatXplore website. Counts are taken for April of each year. HB claims before 2018 are provided for an earlier version of LSOAs (based on 2001 Census geographies). We convert these to 2011 geographies (detail in code on Github – see below) to give a consistent set of small area units. From 2017, households began to transition to a new welfare benefit (Universal Credit or UC) which includes HB within the overall payment. UC claims with a HB element are included in the data here. In 2011, there were 1.54 m PRS HB claims and 3.30 m SRS HB claims, covering 37 and 71 per cent of each tenure respectively. By 2019, HB numbers (including UC) had fallen marginally to 1.47 m and 3.20 m respectively.
Households and population
The Census provides a detailed picture of the spatial distribution of all household in 2011, for PRS and SRS separately (ONS/NRS/NISRA, Citation2017). The PRS is defined here to exclude tied accommodation (provided with a job) and accommodation provided ‘rent free’ by family or friends since none of this is available on the open market. There were 4.12 m PRS households in 2011, compared with 4.67 m in the SRS. For LSOA population in later years, we use annual Small Area Population Estimates produced by UK and Scottish Governments.
PRS listings, 2012/13–19/20
We use a database of listings for PRS accommodation accessed under an end-user licence from the Urban Big Data Centre (UBDC) which in turn licensed them from the property listings company, Zoopla Plc (Zoopla Limited & Economic and Social Research Council (Zoopla/ESRC), Citation2023). The database comprises UK rental listings for 2012/13–19/20 (Livingston et al., Citation2021). Key fields include property location (address/postcode), size (number of bedrooms) and asking rent; we remove adverts with rents below £40pw or above £2000pw (0.3% of cases). We use postcode to allocate listings to LSOAs, TTWAs and BRMAs.
Unlike other sources used here, the Zoopla data do not constitute national statistics. The company is only one provider of rental listings, albeit a major player in the UK market. A range of efforts have been made to assess the representativeness of these data through comparisons with external sources (Livingston et al., Citation2021). These conclude that the database does appear to be a reliable guide to the spatial distribution of PRS properties at any point in time and that it can be used as a reliable source of estimates of median market rents. We do not have specific evidence of coverage of the lower end of the market although, for the analysis here, what matters more is consistency in coverage over time. Coverage of single rooms in shared properties however is weaker and the market for larger properties is generally thin so we limit the analysis here to properties with 1–4 bedrooms although this covers the great majority of listings.
We restrict this part of the analysis to (N = 74) TTWAs with a population above 250,000 and with a minimum of 8000 listings over the eight years, i.e. on average, at least 1000 adverts in each year to produce reasonably robust evidence. There are 2.89 m records in the final dataset.
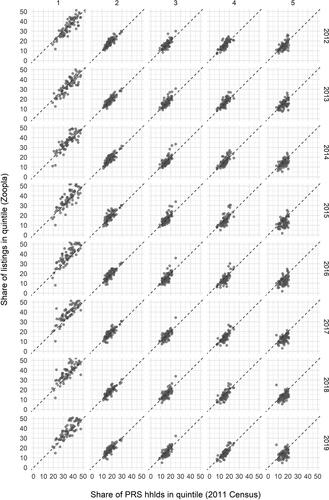
As an additional check on the spatial coverage of the PRS by the rental listings data, we compared the proportion of listings in each TTWA in each quintile (most central to least central) with the proportion of PRS households in that TTWA in each quintile, taken from the Census ( in the Appendix). The figure shows a very strong relationship between the spatial distribution of Zoopla rental listings and the spatial distribution of PRS households. It also shows the relatively high concentration of the PRS market into the most central two deciles (Quintile 1) in most TTWAs.
HB eligible rents, 2012/13–19/20
We use UK Government tables on the maximum rent eligible for HB claims for each size of PRS property in each BRMA. These are updated in April each year so we use financial years for this part of the analysis. Households on HB can choose to rent more expensive accommodation but must make up any difference which is difficult in practice. By attaching the relevant HB rate to the Zoopla data (matching on size, year and BRMA), we identify whether the Zoopla asking rent is at or below the HB rate, or above It.
Measuring centrality
Measures of suburbanization which rely on distance from a single central point run into difficulties in places with complex, polycentric urban forms where movement away from the main centre may not equate to movement towards lower-density, more suburban locations. In these cities, low-income households may also face pressures to move away from significant sub-centres, at times moving towards (but not into) the main centre. In previous work, Bailey and Minton (Citation2018) examined trends in relation to both distance from the main centre and density to try to overcome this. Density has some limitations of its own, however, as the denominator is affected by the inclusion of non-residential land uses such as transport infrastructure, parks and so on.
Zhang and Pryce (Citation2020) propose an elegant refinement, developing an algorithm to identify all the significant sub-centres within each TTWA, and measuring centrality by distance to the nearest centre or sub-centre: see their paper for details. One limitation of that approach is that distance from a sub-centre is treated the same as distance from the main centre although it is likely that the latter, being larger, will exert a greater pressure on low-income households in terms of housing costs. We therefore adopt a variation on this method by combining distance from the main centre with distance from the nearest sub-centre. Using the dataset produced by Zhang and Pryce, we take each LSOA’s rank order within the TTWA for distance from main centre and for distance from nearest sub-centre (which will also be the main centre in some cases). We then order LSOAs by the sum of these two ranks, in effect giving distance to the main centre greater weight.
Measuring centralization
The Relative Centralization Index (RCI) measures the extent to which one group tends to live closer to or further away from more centralized locations. In Massey and Denton (Citation1988) formulation, centrality was relative to a single urban core. Here, as noted above, centrality is by reference to a combination of distance to the main urban core and to the nearest secondary sub-centres. RCI is bounded [-1:+1], with a positive figure indicating that the reference group tends to be found in more central locations than the comparator group.
LSOAs in a TTWA (k) are ordered by centrality (1 to n). Xk is the cumulative proportion of the reference group in neighbourhoods 1 to k, and Yk similarly for the comparator group.
Modelling rents
To examine rent gradients, we model (log) rent as a function of centrality (linear term in deciles), property size (dummies for 2, 3 and 4 bedrooms), and year (linear term with 2012–13 equal zero). An interaction term between centrality and year captures change in the rent gradient over time. A separate model is estimated for each of the 74 TTWAs. We do not include controls for any other aspects of property quality as we are solely interested in identifying the relative costs of PRS properties at different locations since this is what determines where low-income households can afford to live. Underlying land values may therefore have a very different distribution.
The use of linear terms for relationships with distance and year are obvious simplifications but helpful in providing a broad overview of relationships across a large number of TTWAs. The use of deciles for distance puts the relative position within each TTWA on the same scale so coefficients can be directly compared. As a check, we also compute models using dummies for decile (but maintaining a linear interaction between decile and year) but this makes almost no difference to the results; the correlation for the estimates for the interaction term between this and the original model was 0.97.
Software, transparency and reproducibility
Analysis is conducted using the R software (R Core Team, Citation2013), with particular use of the ‘Tidyverse’ suite of packages (Wickham et al., Citation2019). All the code to produce the results reported here is available through GitHub (https://github.com/nick-bailey/Suburbanisation_of_poverty_UK). All data with the exception of the Zoopla Plc listings are available under Open Government Licence or equivalent so can be freely accessed. Zoopla data were accessed under an end-user licence from UBDC which supports non-commercial research by UK-based academics. Other UK-based researchers can apply direct to UBDC for access on the same terms.
Findings
RQ1: rent gradients in PRS markets
We use the Zoopla listings data to look at rent gradients (the extent to which PRS properties in more central locations tend to be more or less expensive), and how these are changing. Model specification is summarized in the methods section. shows the coefficient for decile of distance from the centre, with negative values indicating a decline in rents with distance (i.e. a negative gradient), plotted against (log) TTWA population. The picture for rent gradients in 2012/13 is perhaps surprisingly mixed, particularly for the smaller TTWAs. The models produce positive and negative coefficients for centrality across most of the TTWA size range. There is, however, a trend towards more negative gradients as TTWA population becomes larger. London is the extreme case but not the sole explanation for this. Although not shown here, the coefficients for ‘year’ were positive in all TTWAs bar one, reflecting the rise in rents in cash terms over time; the exception was Aberdeen which had unique local economic circumstances due to the dominance of the oil and gas industry there.
Figure 1. Coefficients for decile of distance by TTWA population.
Notes: Data is Zoopla Property Group PLC, © 2018, processed by UBDC, University of Glasgow. Points are (N = 74) TTWAs. Line is smoother (loess). Error bars show 95% confidence interval.
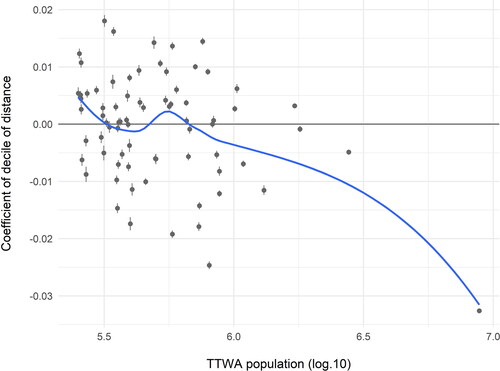
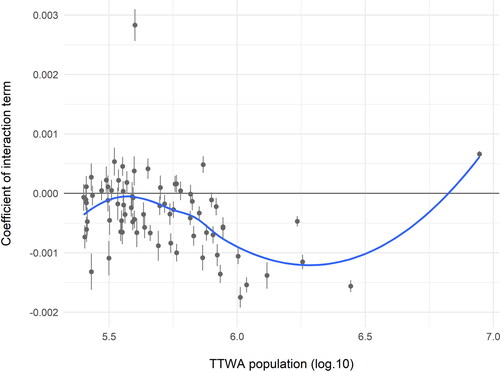
We examine change over time by looking at the coefficients for the interaction term between centrality and year. A negative coefficient indicates that properties in more central locations were becoming more expensive relative to those further out over time (e.g. a negative rent gradient would become steeper). This would be consistent with housing market changes such as the gentrification of more inner urban locations. This is indeed what we see in the great majority of TTWAs (). In general, therefore, changes in PRS rents would tend to have contributed to the suburbanization of poverty in this period. London is again something of an exception, with a modest positive change but, as showed, it started from a much more negative gradient than any other TTWA in Britain. Otherwise, larger TTWAs show a stronger negative shift.
Figure 2. Coefficients for distance-year interaction term by TTWA population.
Notes: Data is Zoopla Property Group PLC, © 2018, processed by UBDC, University of Glasgow. Points are (N = 74) TTWAs. Line is smoother (loess). Error bars show 95% confidence interval.
RQ2: centrality of PRS listings affordable to low-income households
We use the Zoopla data to look at the spatial distribution of new PRS listings affordable to low-income households using two measures of affordability: (a) listings with rents at or below the relevant HB rate for that BRMA in that year; and (b) listings with rents at or below the 20th centile for the TTWA in that year. As discussed above, HB rates had been set at the 30th percentile for the BRMA in 2012/13 so we might expect approximately 30 per cent of listings to be at or below the HB rate that year. As subsequent increases in HB were restricted to below-inflation levels, we would expect this proportion to fall over time. In practice, the proportion of Zoopla listings at or below the HB reference rent appears relatively low, starting at 19.7 per cent in 2012/13 and falls to just 9.3 per cent in 2019/20. The use of the 20th centile rent is therefore designed to give a more stable benchmark.
Three explanations can be made for the low proportion of adverts below the HB limit. First, Zoopla listings may under-represent the bottom end of the market. Previous validation efforts suggest, reassuringly, that Zoopla listings produce very similar estimates of median rents to the regulators’ estimates (Livingston et al., Citation2021) although this does not guarantee equal coverage of the top and bottom end. Second, it may arise because of differences between the flow of new lets (Zoopla data) and the stock of let PRS properties (the regulator’s basis for HB rates). If landlords use turnover as an opportunity to raise rents, new let’s will tend to be more expensive than existing. Third, there is a significant time gap between the period for gathering evidence to set HB rates (the 12 months to September in one year) and the period to which they apply (the 12 months from April in the following year).Footnote3 On average, lets will be advertised 18 months after evidence on market rates was collected. In a rising market such as the UK has had in recent years, that can have a significant impact.
We use the RCI measure to summarize the relative centrality of listings at or below each threshold (the HB rate and the 20th centile rent). shows RCI for each TTWA in the first two years compared with the last two. The dashed line indicates no change over time. Points above the line therefore indicate that the affordable listings have become relatively more centralized over time. Looking at changes in RCI using the HB rate (panel a), we see more increases than decreases, i.e. HB-affordable listings were becoming more centralized over time. This includes London, the one large city where rent gradients actually became less negative over time ( above). Excluding London, other large metropolitan centres saw no change or slightly negative shifts.
Figure 3. Change in RCI, 2012–14 to 2018–20.
Notes: Data is Zoopla Property Group PLC, © 2018, processed by UBDC, University of Glasgow. N = 74 TTWAs. Points are (N = 74) TTWAs.
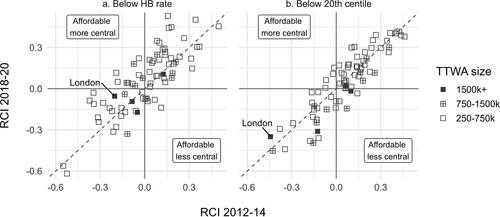
Looking at change using the 20th centile threshold (panel b), we see broadly equal numbers of TTWAs above and below the dashed line but the TTWAs above the line (affordable housing becoming more centralized) were almost entirely from the smallest group. For the large cities, London is again something of an exception. Other TTWAS in the larger groups showed either no change or a decentralization of affordable listings.
RQ3: centrality of low-income households in the PRS
From looking at rental markets, we move on to examine the distribution of low-income households. We start by examining the impacts of the shift from SRS to PRS for low-income households. We do this by measuring the distribution of low-income households in the PRS in 2011 relative to those in the SRS. This is shaped by two factors: where the housing stock in each tenure is located, and which parts of that stock are accessible to low-income households. For PRS and SRS separately, shows three measures: the relative centralization (RCI) for each tenure compared with all households in the TTWA (first row); the relative centralization of HB households in a tenure compared with all households in that tenure (second row); and the relative centralization of HB households in a tenure compared with all households in the TTWA (third row). RCI (y-axis) is plotted against (log) population for the TTWA with a simple smoother to summarize the relationship.
Figure 4. RCI for PRS and SRS households and HB claims, 2011.
Notes: Household numbers from Census 2011. HB households from StatXplore. All measured at LSOA level. Points are (N = 137) TTWAs. Line is smoother (loess).
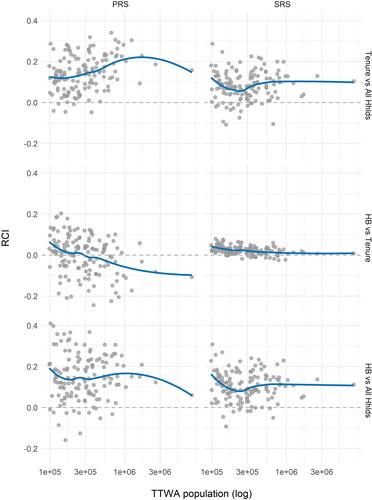
In 2011, both PRS and SRS tended to be found in more centralized locations than households as a whole (, first row). Less central locations tend to be dominated by owner occupied housing, as expected. This was true on average and in the great majority of individual TTWAs, with little variation by size of TTWA. The PRS was somewhat more centralized than the SRS, especially in the larger cities.
We expect HB households within the SRS to have a similar distribution to the sector as a whole since there is little variation in rents over space to drive sorting. We see this clearly in (second row, right-hand panel) where the RCI for SRS HB households compared with SRS non-HB households was close to zero in almost every TTWA. For the PRS, by contrast, the HB households tend to be found in the less central parts of the PRS stock, at least in TTWAs with a population above about 300,000.
Combining the two, we can look at the relative centralization of HB households in each tenure compared with all households in the TTWA (, third row). In both cases, HB households are still more centralized than households as a whole but the differences between PRS and SRS have been reduced. The greater centralization of the PRS stock (first row) is offset by the relative decentralization of HB households within that stock (second row). In the case of London, low-income households in the PRS are less centralized than those in the SRS, presumably reflecting the extremely high rents in the most central locations of that city. Overall, therefore, the shifting of low-income households from SRS to PRS would not seem to produce a strong tendency to decentralization on its own, at least in 2011.
To look at subsequent changes, we rely on comparisons between HB households in each tenure and the population as a whole as we lack more up-to-date estimates of household numbers at small-area level. shows changes in RCI for each TTWA, relative to 2011, with TTWAs grouped by population size; each line represents the RCI for one TTWA relative to levels in 2011. The first row compares HB households in the PRS to those in the SRS directly. The second and third rows compare HB households in the PRS and SRS respectively to the total population. The fourth row captures population change by comparing the distribution in a given year with that for 2011.
Figure 5. Change in RCI for SRS and PRS HB households and population, 2011–19.
Notes: HB households in LSOAs from StatXplore. Population data from UK/Scottish Government small area population estimates. Thin lines are (N = 137) TTWAs. Thick line is smoother (loess).
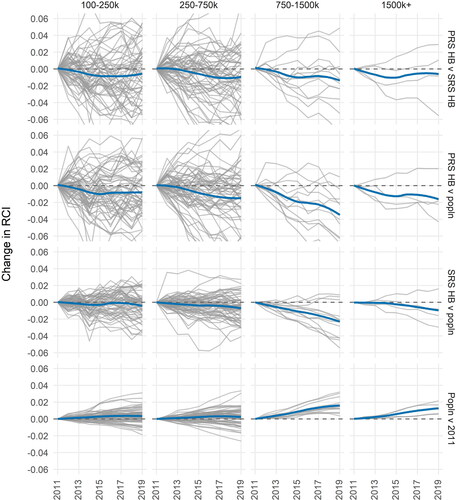
In the period 2011–19, HB households in the PRS do tend to become more de-centralized relative to those in the SRS on average across all sizes of TTWAs (, first row). There was significant variation between TTWAs with quite a number showing relative centralization of HB households in the PRS but the overall trend is as expected. The growing reliance of low-income households in the UK on the PRS rather than the SRS is therefore contributing to the decentralization of poverty.
Over this period, the population as a whole became slightly more centralized compared with 2011 (, fourth row). Areas closer to centres and sub-centres saw faster population growth than those further away, and this was particularly true for the larger cities. Variations between TTWAs were more modest reflecting the relatively slow pace of change through new housing construction, demolitions and conversions. Although many factors are at work here, this centralization of population is certainly in line with planning policies to promote urban intensification through the re-use of brownfield land and to limit developments in areas surrounding cities designated as greenbelt.
In both tenures, HB households tended to decentralize relative to the population as a whole. With the SRS (third row), decentralization more or less mirrors population centralization, judging by the magnitudes of the trends in each case. In other words, the change happens because non-SRS households became more centralized rather than SRS households decentralizing. For the PRS (second row), decentralization moved at a greater pace so population movements are only part of the story. This is consistent with the idea that growing restrictions in housing allowances restricted the access of low-income households in the PRS to more central locations.
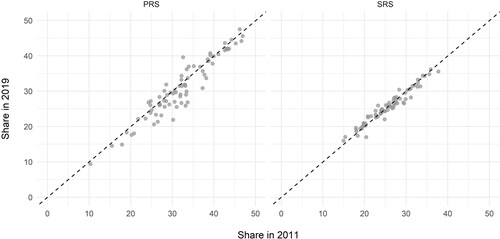
RCI is a very abstract way of summarizing changes. Although it has the advantage of capturing change across the full set of LSOAs in each TTWA, it serves to obscure the absolute level of these changes. One way to illustrate the latter is to look at the proportion of HB claims in each TTWA in the most central quintile of LSOAs in 2019 compared with 2011. shows this for the PRS and SRS separately. For the SRS (right-hand pane), there is very little change over time. For the PRS (left-hand pane), the majority of TTWAs had a lower share of HB claims in the most central quintile although there is some variation, as was apparent in . In most cases, the share of HB claims in the most central quintile has fallen by less than five percentage points. HB claims in the PRS therefore continue to be over-represented in more central locations.
Figure 6. Share of PRS and SRS HB households in most central quintile (20 per cent) of LSOAs, 2011 versus 2019.
Notes: HB households in LSOAs from StatXplore. Population data from UK/Scottish Government small area population estimates. Points are (N = 137) TTWAs.
Conclusions and discussion
This paper shows how housing and welfare reforms may act as drivers of the suburbanization of poverty, reinforcing the impacts of more market-driven processes of labour market restructuring and gentrification. The nature of policy change in these areas will vary greatly between countries but this work highlights how theories of the suburbanization of poverty need to take into account the role of such social policies, as Weck et al. (Citation2023) have argued. As such, we are extending the long-standing arguments about the influence of welfare policy on urban structure from Musterd and Ostendorf (Citation1998) and bringing a spatial focus to debates about the urban impacts of ‘austerity’ from Hastings et al. (Citation2017). In the UK context, we show that the reforms contributed directly to the suburbanization of poverty first by shifting low-income groups from social to private renting where they were exposed to market rent structures and second by the simultaneous reduction in entitlements to housing allowances. Low-income households in the PRS decentralized relative to the population as a whole and relative to those in the SRS in the decade studied here. In part, this is the consequence of changes in the structure of PRS markets, with rents for PRS listings tending to rise faster in more central locations. There are certainly variations between the cities we examined, with London a particular exception, but the overall direction of change is clear.
Echoing the findings from Weck et al. (Citation2023), however, it is also worth emphasizing how much these social policies continue to do to enable low-income households to occupy a range of locations across our urban areas, at least in countries with some combination of (sub-market) social housing provision and means-tested housing allowances. In the UK, these social protections may have been greatly weakened over the period we examine but they continue to ensure more balanced, socially-mixed cities than would otherwise be the case. We also need to pay attention to the specifics of the policies and reforms in a given context. In our case, for example, social housing provision enables access to more central locations for low-income households because of the flat rent structures in that sector in the UK but this may be rather different in other contexts. And while housing allowances in the private sector have been eroded in the UK, the system still does much to shelter low-income households from the impacts of the market, in part because of the use of a large number of regions (BRMAs) for determining entitlements.
Empirically, the paper contributes new insights into the suburbanization of poverty across the UK, with a particular focus on the PRS and on variations between urban areas although we also show that there are some regional differences which require further exploration. Methodologically, the paper makes an important contribution to the measurement of ‘centrality’, extending the innovation from Zhang and Pryce (Citation2020). The paper also demonstrates the value of new forms of data from commercial operations such as Zoopla Plc, particularly when used in combination with Census and administrative data sources.
Further research is needed to deepen our understanding of the relationships between social policies and the spatial structure of urban areas in diverse national contexts. In relation to the focus of this paper, more work is needed to understand the relationship between particular changes and the suburbanization of poverty, how this has unfolded in different contexts and whether there is a tendency towards convergence in spatial structures in different nations and regions. In addition, we need further research to explore the consequences for social welfare: on how suburbanization impacts on access to opportunities, services or amenities; on living conditions and the kinds of community being built by low-income households in the new locations where poverty is growing; and on the response of local public or voluntary services.
Acknowledgements
Census data are Crown copyright. Private rental listings data are copyright Zoopla Property Group PLC, processed by and accessed through the Urban Big Data Centre (UBDC), University of Glasgow. The authors are grateful for the support provided by UBDC staff for data licensing, acquisition and processing. We are very grateful to Owen Boswarva for access to the Broad Rental Market Area boundary data, and to Dr Meng Le Zhang and Professor Gwilym Pryce of Sheffield University for access to their data on urban centres and sub-centres for Travel-to-Work Areas. None of the above are responsible for the analysis or conclusions presented here.
Disclosure statement
No potential conflict of interest was reported by the author(s).
Additional information
Notes on contributors
Nick Bailey
Nick Bailey is Professor of Urban Studies and Director of the Urban Big Data Centre, University of Glasgow. His research covers multiple aspects of social, housing and urban policy, as well as the strengths and limitations of new forms of data for social research.
Mark Livingston
Mark Livingston is a Senior Lecturer in Urban Studies and Co-Investigator in the Urban Big Data Centre, University of Glasgow. His research interests are in neighbourhood analysis and neighbourhood dynamics, the changing role of the private rented sector, and the role of new forms of data for housing and urban research.
Bin Chi
Bin Chi is a Research Data Scientist at the Consumer Data Research Centre, UCL and formerly at the Urban Big Data Centre, University of Glasgow. Dr Chi specialises in the study of spatial analysis and modelling, with a particular focus on urban environments.
Notes
1 England: Housing Live Tables 104 from https://www.gov.uk/government/statistical-data-sets/live-tables-on-dwelling-stock-including-vacants. Scotland: https://www.gov.scot/publications/housing-statistics-scotland-2019-key-trends-summary/. Wales: "https://statswales.gov.wales/Catalogue/Housing/Dwelling-Stock-Estimates/DwellingStockEstimatesPercentages-by-Year-Tenure". Northern Ireland: https://www.communities-ni.gov.uk/publications/northern-ireland-housing-statistics-2020-21.
2 HB was introduced in 1982 (Sanderson & Wilson, Citation2017). From 2008, the benefit paid to those in the PRS was termed Local Housing Allowance (Sanderson & Wilson, Citation2017). From 2015, a new means-tested benefit called Universal Credit began to be phased in, replacing a number of existing benefits and tax credits for low-income households. Housing allowances were subsumed into that payment. In this paper, for simplicity, all are referred to as HB.
3 https://www.gov.uk/government/collections/local-housing-allowance-lha-rates [Accessed 16 Sept 2023]
References
- Autor, D. H., Levy, F. & Murnane, R. J. (2003) The skill content of recent technological change: An empirical exploration, The Quarterly Journal of Economics, 118, pp. 1279–1333.
- Bailey, N. (2020) Poverty and the re-growth of private renting in the UK, 1994-2018, PloS One, 15, pp. e0228273.
- Bailey, N., Bramley, G. & Hastings, A. (2015) Local responses to ‘Austerity’, Local Government Studies, 41, pp. 571–581.
- Bailey, N. & Minton, J. (2018) The suburbanisation of poverty in british cities, 2004-16: Extent, processes and nature, Urban Geography, 39, pp. 892–915.
- Bailey, N. & Robertson, D. (1997) Housing renewal, urban policy and gentrification, Urban Studies, 34, pp. 561–578.
- Bailey, N., Stewart, J. & Minton, J. (2019) The welfare consequences of the suburbanisation of poverty in UK cities: Air pollution and school quality, Urban Development Issues, 61, pp. 15–32.
- Beatty, C., Cole, I., Powell, R., Kemp, P., Brewer, M., Browne, J., Emmerson, C., Hood, A., & J., R. (2014) The impact of recent reforms to Local Housing Allowances: summary of key findings. Research Report 874. London: DWP.
- Beatty, C. & Fothergill, S. (2014) The local and regional impact of the UK’s welfare reforms, Cambridge Journal of Regions, Economy and Society, 7, pp. 63–79. http://cjres.oxfordjournals.org/content/7/1/63.abstract
- Clair, A. (2022) The effect of local housing allowance reductions on overcrowding in the private rented sector in England, International Journal of Housing Policy, 22, pp. 119–137.
- Cooke, T. J. & Denton, C. (2015) The suburbanization of poverty? An alternative perspective, Urban Geography, 36, pp. 300–313.
- Department for Work and Pensions (DWP) (2020) Income-Related Benefits: Estimates of Take-Up, Financial Year 2018 to 2019 (London: DWP).
- Esping-Andersen, G. (1999) The Three Worlds of Welfare Capitalism (Princeton: Princeton UP).
- Forrest, R. & Hirayama, Y. (2015) The financialisation of the social project: embedded liberalism, neoliberalism and home ownership, Urban Studies, 52, pp. 233–244.
- Goos, M., Manning, A. & Salomons, A. (2009) Job polarization in Europe, American Economic Review, 99, pp. 58–63.
- Hardie, I. (2021) The impact of universal credit rollout on housing security: An analysis of landlord repossession rates in english local authorities, Journal of Social Policy, 50, pp. 225–246.
- Hardie, I. (2022) Welfare reform and housing insecurity: the impact of universal credit rollout on demand for rent arrears and homelessness advice from citizens advice in England, Social Policy and Society, pp. 1–24.
- Hastings, A., Bailey, N., Bramley, G., Croudace, R. & Watkins, D. (2014) ‘Managing’ the middle-classes: Urban managers, public services and the response to middle-class capture, Local Government Studies, 40, pp. 203–223.
- Hastings, A., Bailey, N., Bramley, G. & Gannon, M. (2017) Austerity urbanism in the UK: The regressive redistribution of local government services, and the impact on the poor and marginalised in english cities, Environment and Planning A: Economy and Space, 49, pp. 2007–2024.
- Hick, R. & Stephens, M. (2023) Housing, the welfare state and poverty: on the financialization of housing and the dependent variable problem, Housing, Theory and Society, 40, pp. 78–95.
- Hochstenbach, C. & Musterd, S. (2018) Gentrification and the suburbanization of poverty: Changing urban geographies through boom and bust periods, Urban Geography, 39, pp. 26–53.
- Hochstenbach, C. & Musterd, S. (2021) A regional geography of gentrification, displacement, and the suburbanisation of poverty: Towards an extended research agenda, Area, 53, pp. 481–491.
- Hulchanski, J. D., Bourne, L. S., Egan, R., Fair, M., Maaranen, R., Murdie, R. & Walks, A. (2007) The Three Cities Within Toronto: Income Polarization Among Toronto’s Neighbourhoods, 1970-2005 (Toronto: Cities Centre).
- Hulse, K. (2003) Housing allowances and private renting in liberal welfare regimes, Housing, Theory and Society, 20, pp. 28–42.
- Kadi, J. & Ronald, R. (2014) Market-based housing reforms and the "right to the city": The variegated experiences of New York, Amsterdam and Tokyo, International Journal of Housing Policy, 14, pp. 268–292.
- Kavanagh, L., Lee, D. & Pryce, G. (2016) Is poverty decentralising? Quantifying uncertainty in the decentralisation of urban poverty, Annals of the American Association of Geographers, 106, pp. 1286–1298.
- Kemp, P. A. (1994) Housing allowances and the fiscal crisis of the welfare state, Housing Studies, 9, pp. 531–542.
- Kemp, P. A. (2015) Private renting after the global financial crisis, Housing Studies, 30, pp. 601–620.
- Kleynhans, S. & Weekes, T. (2019) From the Frontline: Universal Credit and the Broken Housing Safety Net (London: Shelter).
- Kneebone, E. & Berube, A. (2014) Confronting Suburban Poverty in America (Washington: Brookings Institute).
- Lees, L., Shin, H. B. & López-Morales, E. (2016) Planetary Gentrification (Cambridge: Polity Press).
- Lennartz, C., Arundel, R. & Ronald, R. (2016) Younger adults and homeownership in Europe through the global financial crisis, Population, Space and Place, 22, pp. 823–835.
- Livingston, M., Pannullo, F., Bowman, A., Scott, M. & Bailey, N. (2021) Exploiting new forms of data to study the private rented sector: Strengths and limitations of a database of rental listings, Journal of the Royal Statistical Society Series A: Statistics in Society, 184, pp. 663–682.
- Massey, D. S. & Denton, N. A. (1988) The dimensions of residential segregation, Social Forces, 67, pp. 281–315.
- Mattioli, G. (2017) ‘Forced car ownership’ in the UK and Germany: socio-spatial patterns and potential economic stress impacts, Social Inclusion, 5, pp. 147–160.
- Mullins, D. & Murie, A. (2006) Housing policy in the UK (Basingstoke: Palgrave Macmillan).
- Musterd, S., Marcińczak, S., van Ham, M. & Tammaru, T. (2017) Socioeconomic segregation in european capital cities: increasing separation between poor and rich, Urban Geography, 38, pp. 1062–1083.
- Musterd, S. and Ostendorf, W (1998) Urban Segregation and the Welfare State: Inequality and Exclusion in Western Cities (London: Routledge).
- Office for National Statistics (ONS). (2015) Methodology Note on 2011 Travel-to-Work Areas (London: ONS).
- Office for National Statistics, National Records of Scotland, and Northern Ireland Statistics and Research Agency (ONS/NRS/NISRA) (2017) 2011 Census aggregate data UK Data Service (Edition: February 2017).
- Paton, K. (2009) Probing the symptomatic silences of middle-class settlement: A case study of gentrification processes in glasgow, City, 13, pp. 432–450. http://www.informaworld.com/10.1080/13604810903298524
- Pawson, H., Hulse, K. & Cheshire, L. (2015) Addressing concentrations of disadvantage in urban Australia, in: AHURI Final Report No. 247 (Sydney: AHURI).
- Peck, J. (2012) Austerity urbanism: American cities under extreme economy, City, 16, pp. 626–655.
- R Core Team (2013) R: A Language and Environment for Statistical Computing (Vienna, Austria: R Foundation for Statistical Computing).
- Randolph, B. & Tice, A. (2017) Relocating disadvantage in five Australian cities: Socio-spatial polarisation under neo-liberalism: Urban policy and research, Urban Policy and Research, 35, pp. 103–121.
- Sanderson, E. & Wilson, I. (2017) Does locality make a difference? The impact of housing allowance reforms on private landlords, Housing Studies, 32, pp. 948–967.
- Smith, N. (2002) New globalism, new urbanism: Gentrification as global urban strategy, Antipode, 34, pp. 427–450.
- Van Gent, W. P. C. (2013) Neoliberalization, housing institutions and variegated gentrification: How the ‘third wave’ broke in Amsterdam, International Journal of Urban and Regional Research, 37, pp. 503–522.
- Weck, S., Dobusch, D., Pfaffenbach, C., Fina, S. & Schmitz, J. (2023) New peripheries in the making? Analysing German cities from the lens of a suburbanisation of poverty, Journal of Housing and the Built Environment.
- Wickham, H., Averick, M., Bryan, J., Chang, W., McGowan, L., François, R., Grolemund, G., Hayes, A., Henry, L., Hester, J., Kuhn, M., Pedersen, T., Miller, E., Bache, S., Müller, K., Ooms, J., Robinson, D., Seidel, D., Spinu, V., Takahashi, K., Vaughan, D., Wilke, C., Woo, K. & Yutani, H. (2019) Welcome to the Tidyverse, Journal of Open Source Software, 4, pp. 1686.
- Zhang, M. L. & Pryce, G. (2020) The dynamics of poverty, employment and access to amenities in polycentric cities: Measuring the decentralisation of poverty and its impacts in England and Wales, Urban Studies, 57, pp. 2015–2030.
- Zoopla Limited and Economic and Social Research Council (Zoopla/ESRC) (2023) Zoopla property data (Glasgow: Urban Big Data Centre).
Appendix
Figure A1. Quintile share of rental listings versus quintile share of PRS households, 2012–19.
Notes: Data is Zoopla Property Group PLC, © 2018, processed by UBDC, University of Glasgow. Points are (N = 74) TTWAs.