
ABSTRACT
Second-harmonic generation (SHG) in the nematic phase of bent-core oxadiazole-based liquid crystals (LCs) was studied and compared to that for the rod-like compound 4-cyano-4ʹ-n-octylbiphenyl (8CB). Weak, isotropically scattered second-harmonic (SH) light was observed for all materials, consistent with SHG by nematic director fluctuations. The SH intensity produced by the bent-core materials was found to be up to ~ 3.4 times that of 8CB. We discuss this result in terms of the dependence of SH intensity on temperature, elastic constants and flexoelectric coefficients. We have calculated the latter by using a molecular field approach with atomistic modelling, thus demonstrating how molecular parameters contribute to the flexoelectric coefficients and illustrating the potential of this method for predicting the flexoelectric behaviour of bent-core LCs. We show that the increased SH signal in the bent-core compounds is partly due to their nematic phases being at a much higher temperature, and also potentially due to them having greater flexoelectric coefficients, up to ~1.5 times those of 8CB. These estimates are consistent with reports of increased flexoelectric coefficients in bent-core compounds in comparison to rod-like compounds.
GRAPHICAL ABSTRACT
1. Introduction
In recent years, bent-core molecules have emerged as an exciting class of liquid crystals (LCs). Although new LC phases such as biaxial nematic [Citation1–Citation3] and polar nematic phases [Citation4] have been proposed, the most interesting physical properties found thus far are large flexoelectricity,[Citation5] unusual elastic constants,[Citation6,Citation7] large dielectric permittivity,[Citation8] anomalous electroconvection [Citation9,Citation10] and high ordinary refractive index,[Citation7] which have been reported for nonpolar uniaxial nematic LC phases formed from bent-core materials.
However, one area where little work has been done in bent-core materials is that of second-harmonic generation (SHG). This is perhaps surprising given that the unique shape of bent-core molecules offers the possibility to generate a more intense second-harmonic (SH) signal than from rod-like molecules. First, bent-core molecules have an electron donor–acceptor system along each rod-like segment of the molecule giving them a higher hyperpolarisability than calamitic molecules.[Citation11,Citation12] Second, they have reportedly greater flexoelectric coefficients [Citation5,Citation13–Citation15] which could be expected to lead to a greater flexoelectric polarisation and, consequently, SH signal in the nematic phase. Flexoelectric effects are predicted to be strongest for molecules asymmetric in shape and with a large permanent dipole.[Citation16] In particular, crescent-shaped molecules with a transverse permanent dipole are expected to have large values of the bend flexoelectric coefficient, . Bent-core molecules with their transverse dipole moments provide a very good example of such molecules.
As in all LC phases the arrangement of the molecules is of paramount importance if molecular structural properties are to be translated into macroscopic effects. In this respect SHG in homogeneous uniaxial nematic phases has been shown to be a weak effect (with typical SH intensities of the order of 10–5–10–6 times that of quartz) due to such phases being centrosymmetric and thus having a macroscopic, second-order non-linear susceptibility, χ(2) equal to zero. The weak SH intensity observed in the nematic phase arises from the local breaking of the inversion symmetry so that locally the second-order non-linear susceptibility is non-zero. The local breaking of the inversion symmetry is partly caused by surface interactions [Citation17,Citation18] but, in the main, by nematic director fluctuations in the bulk LC which induce a flexoelectric polarisation,[Citation19] leading to the generation of SH light. As the flexoelectric polarisation varies in accordance with the thermal director fluctuations, the SH light is emitted omni-directionally (i.e. is scattered and is therefore incoherent). This process by which scattered SH light is generated in the nematic phase is thus known as director fluctuation-based SH scattering.[Citation19]
In a uniaxial nematic phase, irrespective of the shape of the constituent molecules, the same sources contribute to the SH signal generated. We would therefore not anticipate the SH intensity in a bent-core uniaxial nematic phase to be on the level of that in an inorganic material. However, from the discussion of molecular shape above, we would expect the SH intensity in a bent-core uniaxial nematic phase to be greater than in a rod-like uniaxial nematic phase.
In this paper we (1) report the SH intensity in the isotropic and nematic phase of two bent-core oxadiazole based LCs and compare it to that of the calamitic compound 4-cyano-4ʹ-n-octylbiphenyl (8CB), thus demonstrating the predicted, enhanced SH; (2) examine the dependence of the SH signal on scattering angle; (3) explain the results in terms of the established theory of director fluctuation-based SH scattering in nematic LCs [Citation19]; (4) employ a computational methodology based on a molecular field approach with atomistic modelling to calculate the flexoelectric coefficients for the bent-core materials; (5) predict the temperature dependence of the SH intensity by using quantities we have calculated (the flexoelectric coefficients and
) and measured (the order parameter
and elastic constants
and
); and (6) examine the reasons for the extra SH signal in the bent-core materials. We believe that this approach offers a deep insight into the mechanisms associated with the generation of SH light in nematic LCs, especially those formed from molecules with a bent-core geometry, and provides a sound basis for future experiments that explore details such as the polarisation dependency of the SH signal.
2. Experimental and computational methods
The following subsections describe the LC materials, the experimental procedure for the measurement of the SH signal and the details for the calculation of the flexoelectric coefficients.
2.1 Materials
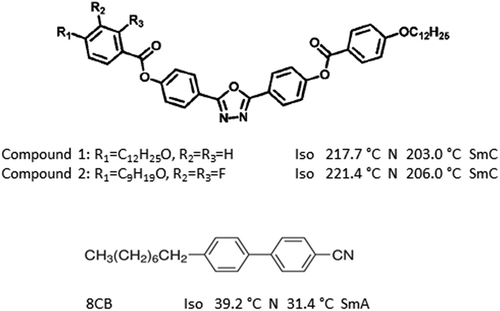
The bent-core materials used in this work have bis-(phenyl)-1,3,4-oxadiazole (ODBP) central bent units and alkoxy terminal chains of different length, as shown in . Compound 2 differs from 1 in that it has fluoro-substituents in the outer phenylene group of one wing. Details of the synthesis are available in.[Citation20,Citation21] The nematic phases of all the materials form at high temperatures of at least 170°C.[Citation20–Citation22] The temperatures for the phase transitions were measured by observation of the LC using polarising microscopy. The temperatures for compounds 1 and 2 were previously reported in Ref.[Citation23] Both compounds exhibit a biphasic region of ~3 K at the nematic to isotropic and smectic C to nematic transitions.
Figure 1. Molecular structures and phase transitions of bent-core compounds 1, 2 and 8CB. The temperatures stated correspond to the midpoint of the transition. Phase transitions other than that directly below the nematic phase are omitted.
2.2 Measurement of the SH signal
All measurements were made on commercial devices consisting of glass substrates coated with indium tin oxide (ITO) and the polyimide, SE130, the latter providing planar alignment and separated by a 5 μm-thick LC layer. These were the only commercial cells available that provided alignment at the high temperatures at which the nematic phase forms and so were the ones chosen, even though the ITO electrodes were not, in fact, used in the experiment. Using polarising microscopy, high-quality, monodomain alignment in the nematic phase of all the materials was confirmed by the absence of defects.
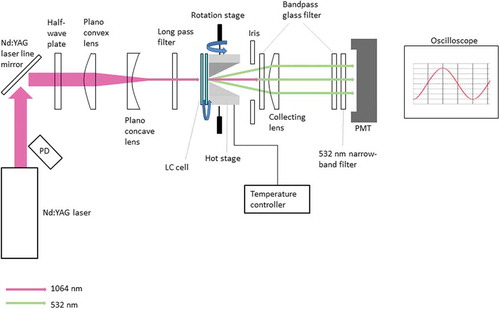
The experimental set-up for the measurement of SH light from LC samples is shown in . The devices were held in a Linkam THMS600 hot stage. Temperature control was achieved by a Linkam TMS 94 controller, which provides a relative accuracy of ±0.1°C. Isotropic and nematic LCs scatter light.[Citation24] Hence the disc-shaped heating element of the hot stage was cut to a cone of half-angle ~25° to allow the scattered SH light to propagate out of the back of the hot stage towards the detector. The hot stage was mounted on a custom-built rotation stage described previously.[Citation25,Citation26] The rotation stage allows the sample to be tilted relative to the direction of propagation of the beam, in order to change the angle of incidence on the sample, and rotated about the direction of propagation of the beam, in order to orient the nematic director relative to the direction of polarisation of the fundamental beam. A pulsed, Q-switched Nd:YAG laser (Spectron Lasers, SL804 1615) was used to provide a linearly polarised, near infrared (NIR) fundamental beam of wavelength 1064 nm and diameter ~1.8 mm. Pulses of duration 34 ns (full-width, half-maximum (FWHM)) and of energy 4 mJ were emitted at a repetition rate of 10 Hz. A half-wave plate was used to control the polarisation of the fundamental beam incident on the sample. The beam diameter was reduced by a plano-convex lens of focal length +250 mm and a plano-concave lens of focal length −100 mm, separated by a distance of 150 mm, in order to obtain a diameter of ~0.7 mm at the sample, sufficiently small for the beam to pass through the hot stage hole. A long-pass optical filter with a cut-on wavelength of 1000 nm was placed before the sample to absorb any 532 nm radiation generated by the optics preceding it. An adjustable, circular iris, of maximum open diameter 25 mm, was placed after the hot stage to allow investigation of the dependence of the SH light on scattering direction. A plano-convex lens, to collect the scattered SH light, was positioned at a distance from the sample equal to its focal length of +35 mm. Two bandpass coloured glass filters, made of Schott glass which transmit only in the wavelength range 335–610 nm, were used to block the fundamental beam. One was placed in front of the collecting lens and the other behind it, near to the photomultiplier tube (PMT) (Thorlabs, PMM01) of rise/fall time 15 μs. A 532 nm narrowband laser line filter, of centre wavelength 532 ± 0.2 nm and bandwidth 1 ± 0.2 nm (FWHM), was placed just in front of the PMT to transmit only the SH light. A photodiode (PD) was placed near to the exit of the Nd:YAG laser, where it detected the fundamental pulse, in order to trigger the acquisition of data on the oscilloscope. For each measurement 64 pulses were acquired and averaged on the oscilloscope. Each SH data point presented in Section 3 represents the average SH pulse energy.
Figure 2. (Colour online) Experimental set-up for the measurement of scattered SH light from a LC sample. PMT = photomultiplier tube. PD = photodiode.
The experimental set-up described above was initially tested on a -cut quartz crystal of thickness 0.5 mm and polished on both sides. Quartz is a well-established non-linear material [Citation27] and so these data enabled the SH measurements for the LCs under study to be expressed in terms of a fraction of the response of quartz. Experiments on empty cells with the fundamental beam incident on cell regions containing ITO showed a significant SH signal, as has been measured previously.[Citation28] Hence cells were positioned on the hot stage such that the fundamental beam was incident only on regions of glass, polyimide and LC. In all experiments a normally incident fundamental beam polarised at 45° to the LC optic axis (OA) was employed. This polarisation was chosen in order to access all possible elements of the third-order non-linear polarisibility tensor
, discussed in Section 4.2, which could contribute to the SH signal generated.
Cells were heated to ~3°C above the nematic to isotropic transition temperature, . Measurements were taken on cooling from the isotropic phase at a rate of 1°C/min through the nematic phase.
2.3 Calculation of the flexoelectric coefficients
The flexoelectric coefficients of these systems were calculated using a computational methodology based on a molecular field approach with atomistic modelling. The molecular field model makes use of the molecular orientational distribution in the nematic phase and the charge distribution in the molecule to obtain expressions for the splay and bend flexoelectric coefficients in terms of the dipole () and quadrupole moments of the molecule. This model is fully described in Refs.[Citation15,Citation29,Citation30] So, in this paper we will concentrate on the details of the atomistic models used in the calculation of the flexoelectric coefficients of the bent-core materials.
The atomistic modelling approach consists of three main steps: (1) determination of atomic charges, molecular geometry and energy parameters by single-molecule Density-Functional Theory (DFT) calculations; (2) Metropolis Monte Carlo (MC) [Citation31] sampling of the conformational space; and (3) calculation of orientational order parameters and flexoelectric coefficients using the Surface Interaction model.[Citation32,Citation33] In the latter two steps, the parameters determined in the former are used, and in the last one the properties are calculated as averages over all conformers sampled in the second step.
Conformers were generated according to the Rotational Isomeric State (RIS) approximation,[Citation34] with conformer geometries and energies defined on the basis of the torsional potentials obtained from quantum chemical calculations (relaxed scans) [Citation35] on representative molecular fragments. According to these data, the following choices were made [Citation23]:
Planar geometry of the central three-ring moiety was assumed, in agreement with the results of DFT calculations for 2,5-diphenyl-1,3,4-oxadiazole.[Citation36] The torsional potential reported there for the bond between the phenyl and oxadiazole rings exhibits two minima, corresponding to the coplanar configuration of the rings, separated by a high barrier of about 30 kJ/mol, corresponding to the perpendicular arrangement of the rings.
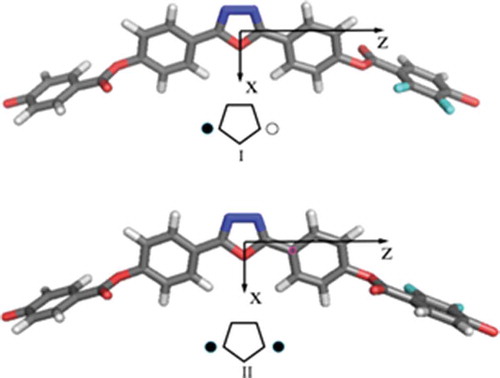
In phenyl benzoate, the Car–COO bond between the aromatic carbon (Car) and the COO moiety was frozen in the planar geometry, since high barriers oppose the rotation about this bond.[Citation37,Citation38] Choice of the geometry of Car–Car–O–CO dihedral is less obvious. As reported in the literature [Citation37–Citation39] and confirmed by the result of the DFT/M06-2X/6–31 + G** calculations carried out here, the torsional profile for this angle is sensitive to the level of theory used in the calculations, and some discrepancies exist regarding the exact location of the minima and the height of the energy barriers. Despite these uncertainties, all calculations point to a wide distribution in the ranges of ±(30–150°). For the sake of simplicity, in our calculations the Car–Car–O–CO dihedral was allowed to adopt the two values of ±90°, which correspond to the middle of the highest probability region. Thus, two states, (I) and (II), were assumed for the central five-ring moiety of compounds 1 and 2, with planar arrangement of the 2,5-diphenyl-1,3,4-oxadiazole unit and the C=O groups pointing either on the same side or on opposite sides (see ).
The benzoate group of the phenyl fluorobenzoate moiety was also assumed to be planar, with the CO group on the opposite side of the fluorine (F) atoms. This assumption was based on torsional potentials computed at the DFT/B3LYP/6–31 + G* level of theory. The profile exhibits two minima, corresponding to planar configurations: the minima are non-equivalent, since the configuration having the CO group on the opposite side of the fluorine atoms is lower in energy than the other by about 3 kJ mol−1. The torsional potential for the Car–Car–O–CO dihedral in phenyl fluorobenzoate has the same general form as that of phenyl benzoate, as indicated by DFT/B3LYP/6–31 + G* calculations: therefore, also in this case the Car–Car–O–CO dihedral was allowed to adopt the values of ±90°.
The CH2–CH2 and O–CH2 bonds of the alkyl and alkoxy chains were allowed to jump between the trans (180°), gauche+ (+65°) and gauche– (−65°) states. The trans state is more stable than the gauche state: an energy difference ΔVgt = 2.2 kJ mol−1 was assumed.[Citation40,Citation41] The only exception is given by the O–CH2–CH2–CH2 dihedral angle, for which the gauche states are more stable than the trans state: in this case ΔVgt = −2.85 kJ mol−1 was used.[Citation41] The energy stabilisation associated with the presence of adjacent gauche+gauche+ (or gauche–gauche–) pairs was accounted for by adding a correction term ΔVʹg±g± = –0.75 kJ mol−1 to ΔVgt.[Citation41] Conformers with adjacent gauche+gauche− (or gauche−gauche+) pairs, which are known to bring a high energy penalty, were simply rejected on the basis of the steric cut-off used in the MC conformational sampling.
Two possible equivalent states were assumed for the Car–Car–O–CH2 dihedral of alkoxy chains, at 0° and 180°, with the phenyl ring and the Car–O–CH2 group lying in the same plane. These two states are equivalent if the aromatic group is a benzene,[Citation38] whereas in the presence of fluoro-substituents the conformation having the O–CH2 bond on the opposite side of the fluorine atoms is found to be more stable (by about 3 kJ mol−1 at the B3LYP/6–31G** level and 7 kJ mol−1 at the B3LYP/6-31 + G* level), in agreement with calculations reported in the literature.[Citation42,Citation43]
Figure 3. (Colour online). Conformations of the core for compound 2. The schematics show the oxadiazole ring and the orientation of the C=O groups, which point in opposite (I) and in the same direction (II). The molecular frame has the Z-axis passing through the carbon atoms of the oxadiazole ring and Y perpendicular to the plane of this ring.
In MC sampling of conformers, the structures having pairs of atoms closer than a cut-off distance equal to 0.82 , where
is the sum of their van der Waals radii, were discarded. Van der Waals radii equal to 0.185 nm (C), 0.15 nm (N and O), 0.135 nm (F) and 0.1 nm (H) were assumed.[Citation44] In this way sterically hindered conformations were rejected, including those with adjacent gauche+ gauche– (or gauche– gauche+) pairs in the hydrocarbon chains. For each conformer, the molecular surface was generated by the fast molecular surface calculation library (MSMS),[Citation45] assuming a rolling sphere radius equal to 0.3 nm and density of vertices equal to 5 Å−2. The same van der Waals radii used for the cut-off distance were assumed for this purpose. Atomic charges were obtained using the RESP method [RESP], with the electrostatic potential computed at the B3LYP/6–311 + G(d,p) level.[Citation46] Charges equal to 70% of the RESP values were finally used to calculate the electric dipolar and quadrupolar moments and the flexoelectric coefficients.[Citation30] All quantities based on electric charges reported in the following are scaled by this factor.
3. Results
The following two subsections describe the results for the temperature and scattering angle dependency of the SH signal. Subsection 3.3 presents the results for the calculation of the flexoelectric coefficients.
3.1 Dependence of the SH signal on temperature
For measurements of the dependence of the SH signal on temperature, the iris was fully open. The SH signal is expressed in terms of the SH pulse energy from the quartz reference ×10–5.
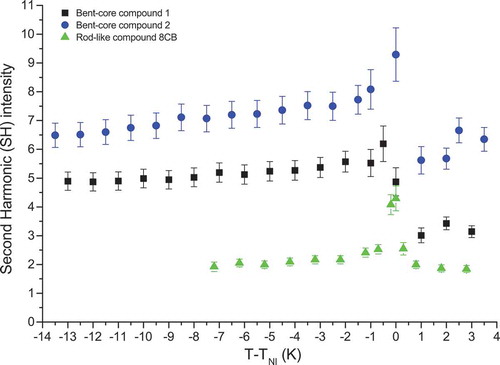
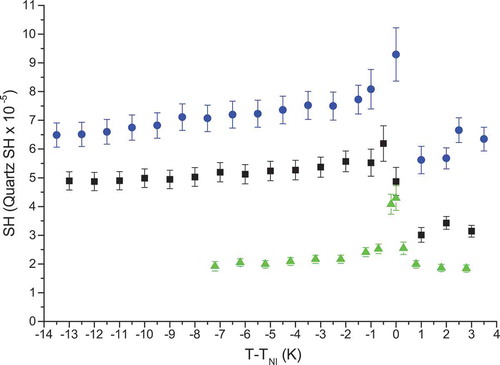
shows the dependence of the SH signal as a function of the reduced temperature for compounds 1, 2 and 8CB. For all materials the SH signal in the isotropic phase of the compounds is lower than in the nematic phase. The SH signal in the isotropic phase for compounds 1, 2 and 8CB is respectively 60, 85 and 90% of the SH signal in the respective nematic phase. Compounds 1 and 2 exhibit a significantly higher SH intensity of, respectively, ~1.7 and ~3.2 times that of 8CB in the isotropic phase. At the isotropic to nematic transition a sharp increase in the SH signal is observed. The nematic director forms at this transition. The director fluctuations are thus of their greatest amplitude, resulting in the greatest SH value.[Citation19] For compounds 1 and 2 at temperatures below the biphasic transition region (i.e. <
), the SH signal decreases slightly, but steadily, in the nematic phase as the temperature falls towards the underlying higher-ordered smectic C phase. A slight decrease in the SH signal is also observed for 8CB, as the underlying smectic A phase is approached. Interestingly, compounds 1 and 2 exhibit a noticeably greater SH intensity of, respectively, ~2.4 and ~3.4 times that of 8CB in the nematic phase. Measurements were taken over the whole nematic range to within 1 K of the start of the underlying phase transition, and no pre-transitional divergence of the SH signal on approaching the lower temperature phase was observed in any of the compounds.
Figure 4. (Colour online) SH pulse energy as a function of reduced temperature in the isotropic and nematic phases for compound 1 (black square), compound 2 (blue circle) and 8CB (green triangle) .
3.2 Dependence of the SH signal on scattering angle
The dependence of the SH signal on scattering angle was investigated by use of the iris of open-radius placed at a distance
~ 30 mm from the sample, just before the first bandpass filter and collecting lens, as shown in . The scattering angle
is defined as the angle between the direction of propagation of the incident wave and the scattered SH wave, where
. The SH signal was measured as the open radius of the iris was gradually reduced.
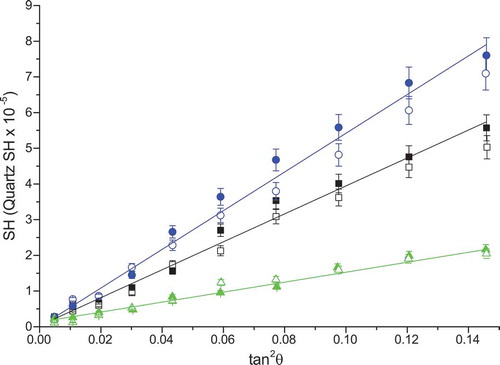
shows the dependence of the SH signal as a function of at two reduced temperatures,
(one in the high and one in the low nematic phase) for compounds 1, 2 and 8CB. Linear fits are shown in for compounds 1, 2 and 8CB at
= −2 K. For all three compounds, the SH signal increases linearly with the open area of the iris,
. No bias towards scattering at low or high angles is observed.
Figure 5. (Colour online) Relative SH pulse energy at various reduced temperatures as a function of
where
is the scattering angle. Compound 1; − 2 K (filled black square, fit line in black), − 8 K (open black square). Compound 2; −2 K (filled blue circle, fit line in blue), − 8 K (open blue circle). 8CB; − 2 K (filled green triangle, fit line in green), − 6 K (open green triangle) .
3.3 Calculation of the flexoelectric coefficients
Both compounds 1 and 2 have their largest component of the electric dipole moment pointing along the transverse molecular axis, and in both cases the average value of this transversal component is around 3.5 D. This is similar to what we found for a similar bent-core oxadiazole,[Citation15] which is not surprising since all three compounds have the same or very similar core. The wings do not significantly affect the dipole moment, not only because of the absence of strongly polar substituents, but also because of their flexibility. Also the predicted flexoelectric coefficients are similar for compounds 1, 2 and the compound in Ref.,[Citation15] which demonstrates the key role of the bent core and the much lower impact of changes (chain length, substituents) in the structure of the wings.
and show the flexoelectric coefficients and the dipolar contributions to the flexoelectric coefficients
calculated for compounds 1 and 2, respectively. The dipolar contribution to the bend dipolar coefficient
is large and positive, as expected for a banana-shaped molecule with an inward-pointing transverse dipole.[Citation16] Conversely,
is very small, consistent with the smaller value of the longitudinal dipole; in any case, the banana-like molecular shape would not allow an effective coupling of a longitudinal dipole to a splay distortion. The quadrupole contribution, which is identical for
and
, is comparable in magnitude to the dipole contribution to
but opposite in sign. This leads to a small
of lower absolute magnitude than
, apparently in contrast to what one might expect for bent-shaped mesogens. shows the difference between the splay and bend flexoelectric coefficients calculated for compounds 1 and 2. The flexoelectric difference depends only upon the dipolar contribution, and since
is very small,
is found. The magnitude of
is seen to increase as the temperature falls and the order increases, as has been observed in other nematic LCs.[Citation13,Citation47]
Figure 6. Flexoelectric coefficients and dipolar contributions to the flexoelectric coefficients
for compound 1 as a function of the reduced temperature
and the order parameter for the molecular Z-axis, SZZ:
(open circles),
(filled circles),
(open squares),
(filled squares) .
Figure 7. Flexoelectric coefficients and dipolar contributions to the flexoelectric coefficients
for compound 2 as a function of the reduced temperature
and the order parameter for the molecular Z-axis, SZZ:
(open circles),
(filled circles),
(open squares),
(filled squares) .
Figure 8. Difference between and
for compounds 1 (solid line, open circles) and 2 (dashed line, filled diamonds) as a function of the reduced temperature
.
4. Discussion
4.1 SHG in the isotropic phase
We first consider the source of SHG in the isotropic phase. Weak SH intensities of the order of 10–5 times that of quartz under the same conditions are observed. This is as expected due to the centrosymmetry of this phase. In the isotropic phase SH light is generated by single-molecule hyper-Rayleigh scattering (SMHRS).[Citation48] The intensity of the SH light is given by
where is a constant related to the scattering geometry,
the number of molecules exposed to the incident light and
the intensity of the incident light of angular frequency
. In the isotropic phase the SH intensity is thus proportional to the square of the first-order optical hyperpolarisability
of the molecule. From we can deduce that for the bent-core compounds 1 and 2
is, respectively, ~1.3 and ~1.8 times that of 8CB, as expected due to their molecular shape. We attribute the greater value of
for compound 2 in comparison to compound 1 to the presence of fluoro-substituents, which can enhance molecular polarisability.
4.2 SHG in the nematic phase
4.2.1 Source of SH light
We turn to SHG in the nematic phase. In the nematic phase we also find the expected, weak SH intensities of the order of 10–5 to 10–4 times that of quartz, with a clear maximum in the signal at the nematic to isotropic transition, where the director fluctuations are of their greatest amplitude.[Citation19] The angle dependence experiments show that the SH light is scattered isotropically (i.e. incoherently), rather than being concentrated in a forward direction as is the case for the quartz. These characteristics are all hallmarks of a SH signal generated by director fluctuation-based SH scattering. It should be noted that SMHRS is present in the nematic phase as well as in the isotropic phase, but it is much lower as the random rotation of the molecules is reduced in the more ordered nematic phase. In addition, the SH signal due to SMHRS would not be expected to rise rapidly at the transition.[Citation19] This is in contrast to . Hence we discount SMHRS as a significant contributor to the nematic phase SH signal.[Citation49]
Using a description of SHG in dielectric media, incorporating intermolecular interactions,[Citation50–Citation52] collective effects [Citation19,Citation53] and surface interactions,[Citation17,Citation18] we examine the sources of the SH signal in the nematic phase. The second-order non-linear or SH polarisation induced in such a medium by the electric field of the electromagnetic wave traversing the medium is given by [Citation49]
where is the electric field of the fundamental optical wave of angular frequency
and
is a point in the medium. The first term gives the SH polarisation due to dipole moments in the medium;
is the second-order non-linear polarisibility tensor. The second term represents the SH polarisation due to non-local quadrupole moments,[Citation50] which are weaker than dipole moments;
is the second-order non-linear quadrupolar susceptibility tensor. The third term is the SH polarisation arising from the combination through
of the electric fields of the optical waves with a zero frequency (i.e. d.c.) electric field
. The fourth term describes the SH polarisation caused by breaking of the centrosymmetry at the surfaces of the medium;
is the second-order non-linear surface susceptibility tensor. The function
defines the surfaces involved.[Citation49] The first term is only allowed in non-centrosymmetric media and thus vanishes in a homogeneous, uniaxial nematic LC, whilst the second, third and fourth terms are allowed in all media, whether centro- or non-centrosymmetric. In terms of their relative magnitudes, the second term is very weak compared to the third term in a nematic LC.[Citation53] One of our initial assumptions is that the contribution from the surface polarisation to the SH signal, described by the fourth term, is negligible.[Citation49]
The dominant contribution to the SH signal in the nematic phase thus comes from the third term, . The physical origin of this term lies in the thermal fluctuations of the director, which cause local breaking of the inversion symmetry, inducing a local flexoelectric polarisation
given by:[Citation24]
where is the nematic director field,
the splay flexoelectric coefficient and
the bend flexoelectric coefficient.
As the director fluctuates at a very low frequency compared to the optical frequency of the incident wave, can be treated as effectively constant with time. In this way
gives rise to the quasi-d.c. field
where
[Citation24] and
is the average dielectric susceptibility.
combines with the electric field
of the incident wave to generate a SH polarisation, which emits incoherent SH light as per the aforementioned process of director fluctuation-based SH scattering.
4.2.2 Calculation and discussion of the temperature dependence of the SH signal
We calculate the temperature dependence of the SH signal due to director fluctuation-based SH scattering, originating from the term , and compare it to the experimentally measured signal.
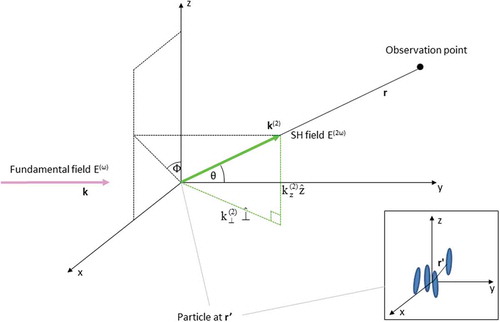
Appendix A derives an expression for the SH intensity in the LC nematic phase due to this process for the experimental geometry described in Section 2.2. Equation (A21) describes
as a function of the angle
, where
describes the orientation of the scattered SH wave in the plane perpendicular to the direction of propagation of the fundamental incident wave. (see ). As a circular iris rather than a slit is placed after the sample, the detector measures
due to all the possible orientations of SH waves (i.e. over all possible values of
). It is therefore necessary to integrate Equation (A21) in order to obtain
, measured by the detector placed at the observation point
, as follows:
where ,
is the volume of the sample,
the amplitude of the electric field of the fundamental wave,
the Boltzmann constant,
the temperature of the sample,
the angular frequency of the fundamental wave,
the average dielectric susceptibility of the medium,
the permittivity of free space and
the speed of light in a vacuum.
gives the direction of polarisation of the incident wave where
. In the experimental geometry described in Section 2.2, the incident wave propagates along the y direction (i.e.
is zero) and is polarised at 45° to the director (i.e.
). The summations of the elements of
which thus contribute to the SH signal are given by
and
.
It can be seen that Equation (4) is independent of (see Appendix A), which is another indication that director fluctuation-based scattering theory predicts an isotropic SH radiation scattering pattern, as observed in .
Equation (4) can be developed to obtain an expression for the temperature dependence of in terms of the temperature-dependent parameters
,
. The physical property
does not require the LC to be in the nematic phase in order to exist. This is unlike
,
which only have meaning in the nematic phase where director distortions are present. The dependence of
on temperature in the nematic phase is thus treated as secondary with respect to the dependences of
,
on temperature in the nematic phase.[Citation49] We assume
and
to be approximately equal (i.e.
). For compounds 1 and 2 we use experimentally determined values of
[Citation23] and calculated values of
from Section 3.3.
is then obtained by numerical integration of Equation (4).
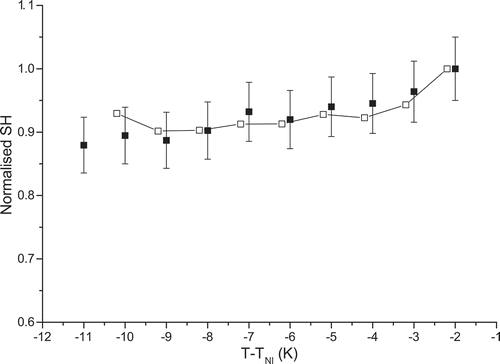
compares, for compound 1, the normalised experimental SH signal with to the normalised calculated SH signal, obtained from Equation (4), in the nematic range.
Figure 9. Temperature dependence of SH signal in the nematic phase for compound 1; experimental SH (filled black square), calculated SH (open black square and line). Data are normalised to the maximum value to allow comparison between the two data sets.
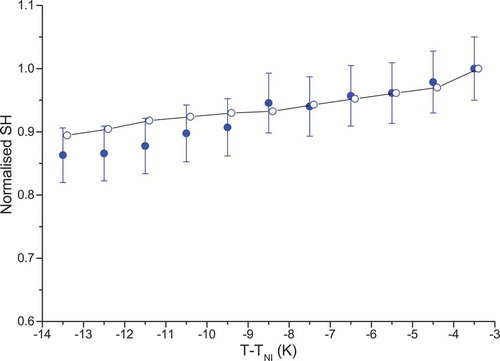
presents a similar comparison to for compound 2. and illustrate that the experimental SH signal is in excellent agreement with the calculated SH signal for both compounds. These results further confirm that the SH signal generated is due to director fluctuation-based SH scattering and validate our initial assumption that the SH signal due to symmetry breaking at the surfaces is negligible.
Figure 10. (Colour online) Temperature dependence of SH signal in the nematic phase for compound 2; experimental SH (filled blue circle), calculated SH (open blue circle and line). Data are normalised to the maximum value to allow comparison between the two data sets.
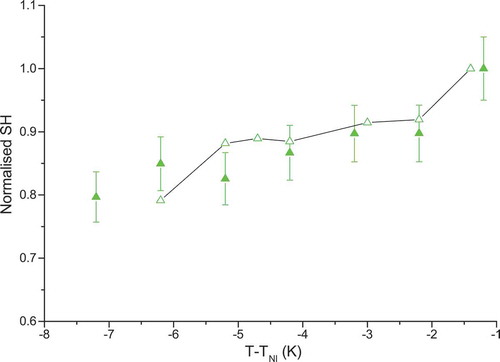
Regarding a similar comparison of the experimental and calculated SH signal for 8CB, unfortunately there are no published values of or
available for this LC. However, values of
[Citation54] and
[Citation55] are available. So in this case we make the assumption, experimentally demonstrated for some rod-like LCs,[Citation56] that
and
are linearly proportional to
in the nematic phase. In addition we use the one-flexoelectric-coefficient approximation
=
.[Citation47,Citation57] Making these substitutions in Equation (4), we obtain
where
compares for 8CB the normalised experimental SH signal to the normalised calculated SH signal, obtained from numerical integration of Equation (5), in the nematic range. There is good agreement between the experimental and calculated SH signal, although not quite as good as for compounds 1 and 2. This is most probably due to a degree of inaccuracy in the assumptions made about the flexoelectric coefficients.
Figure 11. (Colour online) Temperature dependence of SH signal in the nematic phase for 8CB; experimental SH (filled green triangle), calculated SH (open green triangle and line). Data are normalised to the maximum value to allow comparison between the two data sets.
We analysed the factors contributing to the temperature dependence of the SH signal. All compounds show a slight decrease in the experimentally measured SH signal as the temperature falls in the nematic phase (See ). The complete expression for the temperature dependence of the SH signal in Equation (4) is complex, depending on the absolute temperature of the LC and the parameters
,
, which behave differently with temperature and, in that way, nematic order. For compounds 1 and 2,
and
both increase as the temperature falls and
increases, but with
increasing at a faster rate.[Citation23] Regarding the flexoelectric coefficients,
decreases as the temperature falls whilst
increases but at a slower rate (see and ). No measurements of
are available for compounds 1 or 2. Indeed, measurements of
for bent-core nematic LCs are extremely rare. We thus assume, as explained before, that the dependence of
on temperature in the nematic phase is weak.[Citation58] We analyse the combined effect of the varying temperature dependences of
,
, as they appear in Equation (4) and contribute to the SH signal, by plotting the quantity
for compound 1 in .
Figure 12. Temperature dependence of (open black square, right y-axis, dashed linear fit line) and experimental SH (filled black square, left y-axis, solid linear fit line) in the nematic phase for compound 1.
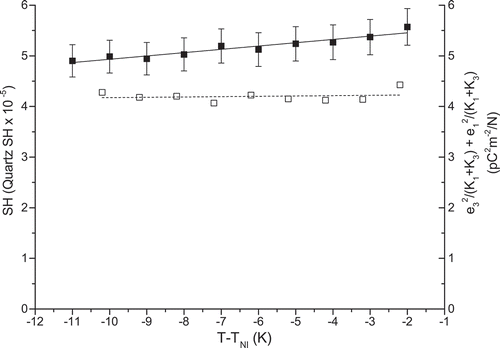
Figure 13. (Colour online) SH scattering geometry. The diagram shows only one scattered SH wave. However, in reality, there are many SH waves all with different wave vectors .The inset shows a particle at
acting as a source of SHG.
In we see from the horizontal dashed linear fit line that the quantity is constant in temperature over the nematic range. (The different variations with temperature of
,
effectively cancel out when they are combined into the quantity plotted.) Referring to Equation (4), the temperature dependence of the SH signal is thus, in the main, related to the absolute temperature
of the LC. We would thus expect the experimental SH signal to fall as
falls in the nematic phase, just as observed in and highlighted in .
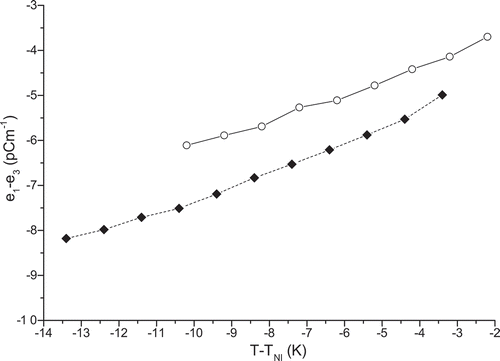
4.2.3 Comparison of the magnitude of the SH signal between different compounds
We now attempt to explain the difference in the intensity of the SH signal in the bent-core compounds compared to 8CB. In we list the experimental SH signal, and
for compounds 1, 2 and 8CB at reduced temperatures chosen so that they all have similar values of
and
(and thus almost identical values for the mean
). We note that the corresponding absolute temperature is much greater for 1 and 2, their nematic phases forming at temperatures of ~175 K higher than that of 8CB (see ).
Table 1. Values of ,
and the experimental SH signal for compounds 1, 2 and 8CB.
Using the data in , we calculate the ratio of the experimental SH signal for compounds 1 and 2 with respect to 8CB in . The SH signal for compound 1 is ~2.4 times greater than that for 8CB whilst that for compound 2 is ~3.4 times greater. Part of the increased signal can be explained by the fact that the absolute temperature of both compounds 1 and 2 is ~1.6 times greater than that of 8CB. Taking this into account, the SH signal for compound 1 is still ~1.5 times greater than that for 8CB whilst that for compound 2 is ~2.1 times greater. This extra signal in compounds 1 and 2 can be accounted for by them having either a larger or a larger
and/or
. Only one experimental study of
for a bent-core compound has to date been published, and the measurements were taken in the isotropic rather than the nematic phase.[Citation59] There are rather more reports of the flexoelectric coefficients for bent-core materials.[Citation5,Citation13–Citation15,Citation60–Citation62] If we therefore assume that the extra SH signal for compounds 1 and 2 with respect to 8CB is due to the flexoelectric coefficients rather than to
, we can estimate their relative values from the SH signal measurements. Using the fact that the SH signal is proportional to the square of the flexoelectric coefficients (see Equation (4)), we estimate
and
for compound 1 to be ~1.2 times greater than those for 8CB. For compound 2 we estimate
and
to be ~1.5 times greater than those for 8CB. These estimates would be consistent with reports of flexoelectric coefficients in bent-core materials of 2–3 times those in calamitic materials.[Citation13–Citation15]
Table 2. Ratios of SH signal and absolute temperature , calculated for the data in , for compounds 1, 2 and 8CB.
5. Conclusion
In this paper we experimentally determined the intensity of the SH light generated in the isotropic and nematic phases of two homogeneously aligned, bent-core oxadiazole compounds and the rod-like 8CB. The dependences of the SH intensity on temperature and scattering angle have been measured.
For all materials, weak (10–5–10–4 times that of quartz), isotropically scattered SH radiation with a maximum intensity at the nematic to isotropic transition was observed. These results are consistent with the theory of SHG by director fluctuation-based SH scattering, which leads to the emission of weak, incoherent SH radiation in the nematic phase. The intensity of the SH signal was seen to decrease slightly as the temperature fell in the nematic phase. We analysed this temperature dependence of the SH signal in terms of the elastic constants, flexoelectric coefficients and absolute temperature of the LCs. In order to do this, the flexoelectric coefficients were calculated using a molecular field approach with atomistic modelling, giving results which are in good agreement with other bent-core compounds. These calculations offer valuable predictive insight into the flexoelectric behaviour of LCs, starting from the molecular orientational distribution in the nematic phase and geometry and charge distribution of the constituent molecules. We find that the decrease observed in the SH signal as the temperature decreased in the nematic phase is predominantly due to this reduction in absolute temperature.
The predicted, enhanced optical nonlinearity was observed in the bent-core compounds. In the isotropic phase the SH signal of the bent-core compounds was found to be ~1.7–3.2 times that of 8CB, a factor that could be attributed to the higher molecular hyperpolarisability of bent-core molecules compared to rod-like molecules. In the nematic phase the bent-core materials exhibited a SH signal of ~2.4–3.4 times that of 8CB. In this case part of the enhancement in the SH signal in the bent-core materials is due to these being at a significantly higher absolute temperature in their nematic phase than 8CB. The other part of the enhancement can be explained in terms of potentially larger flexoelectric coefficients, of the order of ~1.2–1.5 times those of 8CB. Such values for the bent-core materials studied would be consistent with reports of the flexoelectric coefficients for other bent-core materials, which indicate these to be 2–3 times greater than in rod-like compounds. So, in summary, whilst we still find the SH intensity of the bent-core compounds to be low, as is the case for SH light generated in all uniaxial nematic LCs, we do find it to be greater than that for the rod-like compound, as predicted.
Acknowledgements
V.G. gratefully acknowledges the Royal Society for funding through a Dorothy Hodgkin Fellowship.
Disclosure statement
No potential conflict of interest was reported by the authors.
Additional information
Funding
Related Research Data
References
- Tschierske C, Photinos DJ. Biaxial nematic phases. J Mater Chem. 2010;20:4263–4294. doi:10.1039/b924810b.
- Acharya BR, Primak A, Kumar S. Biaxial nematic phase in bent-core thermotropic mesogens. Phys Rev Lett. 2004;92:145506. doi:10.1103/PhysRevLett.92.145506.
- Madsen LA, Dingemans TJ, Nakata M, et al. Thermotropic biaxial nematic liquid crystals. Phys Rev Lett. 2004;92:145505. doi:10.1103/PhysRevLett.92.145505.
- Shanker G, Nagaraj M, Kocot A, et al. Nematic phases in 1,2,4-Oxadiazole-Based Bent-Core Liquid Crystals: is there a ferroelectric switching? Adv Funct Mater. 2012;22:1671–1683. doi:10.1002/adfm.v22.8.
- Harden J, Mbanga B, Eber N, et al. Giant flexoelectricity of bent-core nematic liquid crystals. Phys Rev Lett 2006;97. doi:10.1103/PhysRevLett.97.157802.
- Majumdar M, Salamon P, Jakli A, et al. Elastic constants and orientational viscosities of a bent-core nematic liquid crystal. Phys Rev E 2011;83. doi:10.1103/PhysRevE.83.031701.
- Kaur S, Addis J, Greco C, et al. Understanding the distinctive elastic constants in an oxadiazole bent-core nematic liquid crystal. Phys Rev E. 2012;86. doi:10.1103/PhysRevE.86.041703.
- Marino L, Ionescu AT, Marino S, et al. Dielectric investigations on a bent-core liquid crystal. J Appl Phys. 2012;112:114113. doi:10.1063/1.4767915.
- Kaur S, Belaissaoui A, Goodby JW, et al. Nonstandard electroconvection in a bent-core oxadiazole material. Phys Rev E: Stat Nonlinear Soft Matter Phys. 2011;83:041704. doi:10.1103/PhysRevE.83.041704.
- Xiang Y, Goodby JW, Gortz V, et al. Revealing the uniaxial to biaxial nematic liquid crystal phase transition via distinctive electroconvection. Appl Phys Lett. 2009;94:193507. doi:10.1063/1.3138867.
- Araoka F, Park B, Kinoshita Y, et al. Evaluation of the first-order hyperpolarizability tensor of bent molecules by means of hyper-Rayleigh scattering method. Jpn J Appl Phys 1-Regular Pap Short Notes Rev Pap. 1999;38:3526–3529. doi:10.1143/JJAP.38.3526.
- Kentischer F, MacDonald R, Warnick P, et al. Second harmonic generation (SHG) investigations of different phases of banana shaped molecules. Liq Cryst. 1998;25:341–347. doi:10.1080/026782998206137.
- Salter PS, Tschierske C, Elston SJ, et al. Flexoelectric measurements of a bent-core nematic liquid crystal. Phys Rev E 2011;84. doi:10.1103/PhysRevE.84.031708.
- Le KV, Araoka F, Fodor-Csorba K, et al. Flexoelectric effect in a bent-core mesogen. Liq Cryst. 2009;36:1119–1124. doi:10.1080/02678290902854086.
- Kaur S, Panov VP, Greco C, et al. Flexoelectricity in an oxadiazole bent-core nematic liquid crystal. Appl Phys Lett. 2014;105:223505. doi:10.1063/1.4903242.
- Meyer RB. Piezoelectric effects in liquid crystals. Phys Rev Lett. 1969;22:918–921. doi:10.1103/PhysRevLett.22.918.
- Dadap JI, Shan J, Eisenthal KB, et al. Second-harmonic Rayleigh scattering from a sphere of centrosymmetric material. Phys Rev Lett. 1999;83:4045–4048. doi:10.1103/PhysRevLett.83.4045.
- Dadap JI. Optical second-harmonic scattering from cylindrical particles. Phys Rev B 2008;78. doi:10.1103/PhysRevB.78.205322.
- Copic M, Ovsenik T. 2nd-harmonic scattering on orientational fluctuations in nematics. Europhys Lett. 1993;24:93–98. doi:10.1209/0295-5075/24/2/003.
- Gortz V, Goodby JW. Enantioselective segregation in achiral nematic liquid crystals. Chem Commun. 2005;3262–3264. doi:10.1039/b503846d.
- Goertz V, Southern C, Roberts NW, et al. Unusual properties of a bent-core liquid-crystalline fluid. Soft Matter. 2009;5:463–471. doi:10.1039/B808283A.
- Gleeson HF, Kaur S, Gortz V, et al. The nematic phases of bent-core liquid crystals. ChemPhysChem. 2014;15:1251–1260. doi:10.1002/cphc.201400014.
- Kaur S, Liu H, Addis J, et al. The influence of structure on the elastic, optical and dielectric properties of nematic phases formed from bent-core molecules. J Mater Chem C. 2013;1:6667–6676. doi:10.1039/c3tc31545b.
- De Gennes PG, Prost J. The physics of liquid crystals. 2nd ed. Oxford: Clarendon Press; 1993.
- Brimicombe PD, Siemianowski SD, Jaradat S, et al. Time-resolved x-ray studies of the dynamics of smectic-A layer realignment by magnetic fields. Phys Rev E 2009;79. doi:10.1103/PhysRevE.79.031706.
- Gleeson HF, Roberts NW, Conn J, et al. Mechanisms of switching in an antiferroelectric liquid crystal device revealed by time-resolved X-ray scattering. Liq Cryst. 2006;33:451–457. doi:10.1080/02678290500487099.
- Miller RC. Mechanism of second harmonic generation of optical maser beams in quartz. Phys Rev. 1963;131:95–97. doi:10.1103/PhysRev.131.95.
- Wang WJ, Xu JH, Liu X, et al. Second harmonic generation investigation of indium tin oxide thin films. Thin Solid Films. 2000;365:116–118. doi:10.1016/S0040-6090(00)00649-0.
- Ferrarini A. Shape model for the molecular interpretation of the flexoelectric effect. Phys Rev E 2001;64. doi:10.1103/PhysRevE.64.021710.
- Cestari M, Frezza E, Ferrarini A, et al. Crucial role of molecular curvature for the bend elastic and flexoelectric properties of liquid crystals: mesogenic dimers as a case study. J Mater Chem. 2011;21:12303–12308. doi:10.1039/c1jm12233a.
- Metropolis N, Rosenbluth AW, Rosenbluth MN, et al. Equation of state calculations by fast computing machines. J Chem Phys. 1953;21:1087–1092. doi:10.1063/1.1699114.
- Ferrarini A, Moro GJ, Nordio PL, et al. A shape model for molecular ordering in nematics. Mol Phys. 1992;77:1–15. doi:10.1080/00268979200102271.
- Ferrarini A, Greco C, Luckhurst GR. On the flexoelectric coefficients of liquid crystal monomers and dimers: a computational methodology bridging length-scales. J Mater Chem. 2007;17:1039–1042. doi:10.1039/b618928h.
- Flory PW. Statistical mechanics of chain molecules. New York, NY: Wiley-Interscience; 1969.
- Frisch MJ, Trucks GW, Schlegel HB, et al. Gaussian 09, revision B.01. Wallingford (CT): Gaussian, Inc; 2010.
- Pelaez Laguno J. Atomistic simulation of biaxial liquid crystals and mixtures of liquid crystals [Doctoral thesis]. Durham (UK): Durham University.
- Wrzalik R, Merkel K, Kocot A. Ab initio study of phenyl benzoate: structure, conformational analysis, dipole moment, IR and Raman vibrational spectra. J Mol Model. 2003;9:248–258. doi:10.1007/s00894-003-0138-9.
- Cinacchi G, Prampolini G. DFT study of the torsional potential in ethylbenzene and ethoxybenzene: The smallest prototypes of alkyl- and alkoxy-aryl mesogens. J Phys Chem A. 2003;107:5228–5232. doi:10.1021/jp034648k.
- Kawauchi S, Choi S-W, Fukuda K, et al. Why achiral rod-like compound with ester group amplifies chiral power in chiral mesophase. Chem Lett. 2007;36:750–751. doi:10.1246/cl.2007.750.
- Klauda JB, Pastor RW, Brooks BR. Adjacent gauche stabilization in linear alkanes: implications for polymer models and conformational analysis. J Phys Chem B. 2005;109:15684–15686. doi:10.1021/jp0527608.
- Cestari M. 2009. Atomistic modelling of liquid crystal materials properties: a theoretical and computational methodology [doctoral thesis]. Padova (Italy): Università degli Studi di Padova.
- Novikov VP, Vilkov LV, Oberhammer H. Conformational properties of 2-fluoroanisole in the gas phase. J Phys Chem A. 2003;107:908–913. doi:10.1021/jp022235y.
- Isozaki T, Sakeda K, Suzuki T, et al. Evidence for a non-planar conformer and conformational isomerization of o-fluoroanisole in a low-temperature Ar matrix. Chem Phys Lett. 2005;33:451–457. doi:10.1016/j.cplett.2005.04.086.
- Lide DR. Handbook of chemistry and physics. Boca Raton, FL: CRC; 1996.
- Sanner MF, Olson AJ, Spehner JC. Reduced surface: an efficient way to compute molecular surfaces. Biopolymers. 1996;38:305–320. doi:10.1002/(SICI)1097-0282(199603)38:3<305::AID-BIP4>3.0.CO;2-Y.
- Frisch MJ, Trucks GW, Schlegel HB, et al. Gaussian 03, revision D.02. Wallingford (CT): Gaussian, Inc; 2004.
- Castles F, Green SC, Gardiner DJ, et al. Flexoelectric coefficient measurements in the nematic liquid crystal phase of 5CB. Aip Advances. 2012;2:022137. doi:10.1063/1.4723681.
- Clays K, Persoons A. Hyper-Rayleigh scattering in solution. Phys Rev Lett. 1991;66:2980–2983. doi:10.1103/PhysRevLett.66.2980.
- Hong SH, Williams JC, Twieg RJ, et al. Second-harmonic generation in a bent-core nematic liquid crystal. Phys Rev E 2010;82. doi:10.1103/PhysRevE.82.041710.
- Bjorkhol J, Siegman AE. Accurate cw measurements of optical 2nd-harmonic generation in ammonium dihydrogen phosphate and calcite. Phys Rev. 1967;154:851–860. doi:10.1103/PhysRev.154.851.
- Davis CC. Lasers and electro-optics. Cambridge, UK: Cambridge University Press; 1996.
- Bloember N, Chang RK, Jha SS, et al. Optical second-harmonic generation in reflection from media with inversion symmetry. Phys Rev. 1968;174:813–822. doi:10.1103/PhysRev.174.813.
- Zhongcan OY, Zie YZ. Theory of 2nd-harmonic generation in nematic liquid-crystals. Phys Rev A. 1985;32:1189–1200. doi:10.1103/PhysRevA.32.1189.
- Southern CD, Gleeson HF. Using the full Raman depolarisation in the determination of the order parameters in liquid crystal systems. Eur Phys J E. 2007;24:119–127. doi:10.1140/epje/i2007-10223-3.
- Chattopadhayay P, Roy SK. Splay and bend elastic-constants in 7CB and 8CB. Mol Cryst Liq Cryst Sci Technol Sect A-Mol Cryst Liq Cryst. 1994;257:89–98. doi:10.1080/10587259408033766.
- Dozov I, Martinotlagarde P, Durand G. Conformational flexoelectricity in nematic liquid-crystals. J Phys Lett. 1983;44:817–822. doi:10.1051/jphyslet:019830044019081700.
- Porenta T, Ravnik M, Zumer S. Effect of flexoelectricity and order electricity on defect cores in nematic droplets. Soft Matter. 2011;7:132–136. doi:10.1039/C0SM00546K.
- Wong KY, Garito AF. 3rd-harmonic-generation study of orientational order in nematic liquid-crystals. Phys Rev A. 1986;34:5051–5058. doi:10.1103/PhysRevA.34.5051.
- Dhara S, Araoka F, Lee M, et al. Kerr constant and third-order nonlinear optic susceptibility measurements in a liquid crystal composed of bent-shaped molecules. Phys Rev E 2008;78. doi:10.1103/PhysRevE.78.050701.
- Balachandran R, Panov VP, Vij JK, et al. Effect of cybotactic clusters on the elastic and flexoelectric properties of bent-core liquid crystals belonging to the same homologous series. Phys Rev E 2013;88. doi:10.1103/PhysRevE.88.032503.
- Kumar P, Marinov YG, Hinov HP, et al. Converse flexoelectric effect in bent-core nematic liquid crystals. J Phys Chem B. 2009;34:5051–5058. doi:10.1021/jp903241z.
- Sathyanarayana P, Dhara S. Antagonistic flexoelectric response in liquid crystal mixtures of bent-core and rodlike molecules. Phys Rev E 2013;87. doi:10.1103/PhysRevE.87.012506.
- Butcher PN, Cotter D. The elements of nonlinear optics. Cambridge, UK: Cambridge University Press; 1991.
Appendix A
In this Appendix we obtain an expression for the temperature dependence of the SH intensity , due to director fluctuation-based SH scattering originating from the term
in the LC nematic phase, in terms of the temperature-dependent parameters
and
. The scattering geometry is described in .
The fundamental incident wave vector is defined as of magnitude
and the scattered SH wave vector
of magnitude
, where
is the refractive index of the medium and its dispersion is ignored. The wave vector mismatch
. The nematic director is along the
-axis.
can be written as
where
is the component of
perpendicular to the director and
the component parallel to the director.
The SH intensity , due to director fluctuation-based SH scattering for a given
at the observation point
, is given by [Citation49]
where is the volume of the sample,
the amplitude of the electric field of the fundamental wave,
the Boltzmann constant,
the temperature,
the angular frequency of the fundamental wave,
the distance from the sample to the observation point,
the average dielectric susceptibility,
the permittivity of free space and
the speed of light in vacuo.
,
,
are the elastic constants associated with the splay, twist and bend deformations of the director.
The component of
is given by [Citation49]
Likewise for [Citation49]
With reference to , the fundamental incident wave propagates along the -axis (i.e.
), the angle between the direction of the incident wave and the scattered SH wave is the scattering angle
and the angle
provides the orientation of the scattered SH wave in the plane perpendicular to the direction of propagation of the incident wave. Its complementary angle
is measured from the positive
-axis and is the one used in this derivation. The scattering plane is the plane defined by
and
. In spherical coordinates
. For small
, as used in the experiment described in Section 2.2,
and so we can express
as
where . The component
has vanished and we obtain
. Hence Equation (A1) becomes
where is a constant independent of
and
.
First the term in Equation (A4) is examined. Using
in Equation (A2a), the
component of
becomes
where summation is implied over the repeated indices k, l.
gives the direction of polarisation of the incident wave where
. In the experiment described in Section 2.2, the incident wave propagates along the y direction (i.e.
is zero) and is polarised at 45° to the director (i.e.
). We obtain for Equation (A5)
where
All elements of the tensor with a non-recurring index are zero in a medium displaying reflection symmetry, such as a uniaxial nematic LC.[Citation63] Applying this to Equation (A6), the non-zero components of
are
where
Using Eqs. (A3) and (A7), we can write
The term in Equation (A4) can be written as
From Eqs. (A8) and (A9), the top line of Equation (A4) for is given by
For small , as used in the experiment described in Section 2.2,
and so Equation (A10) reduces to
Using Equation (A3), we can write for the bottom line of Equation (A4) for )
Hence from Eqs. (A11) and (A12) we obtain for
In terms of the parameters describing the scattered SH waves, the dependence on and
has dropped out and we now have an expression that depends only on
.
Substituting Equation (A13) into Equation (A4), the term in Equation (A4) can be written as
A similar procedure can be applied to calculate the term in Equation (A4) to obtain
The only non-zero component of is given by
where
In the limit of small ,
and Equation (A19) = 0 i.e. the
term in Equation (A4) vanishes.
Adding the (Equation (A15) and
(Equation (A19) terms, we obtain the SH intensity as a function of
As is a constant it can be incorporated into
, giving
where