
ABSTRACT
Three 1,4-disubstituted anthraquinone dyes with bis(4-n-butylphenyl) substituents connected via amine or amide linking groups have been studied as guest molecules dissolved in the nematic host E7. UV-visible absorption spectroscopy has shown each of the dyes to exhibit multiple absorption bands in the visible region, and dichroic order parameters obtained from polarised spectra of aligned guest–host samples were shown to differ significantly between the bands for each dye, and between the dyes. Time-dependent density functional theory calculations indicated that each dye exhibits several transitions, giving transition dipole moment vectors with a range of orientations, and fully atomistic molecular dynamics simulations of the guest–host mixtures showed differences in the calculated molecular alignments of the dyes. Combining the results from these two sets of calculations enabled a comparison of molecular alignment models based on the moments of inertia and the surface tensors of the dyes. The match between calculated and experimental values was improved significantly when using the surface tensor rather than the moment of inertia model, indicating that the shapes of the molecular surfaces of these dyes are crucial to their alignment. A novel method of calculating polarised UV-visible absorption spectra of dyes in liquid crystal hosts is also presented.
Graphical Abstract
1. Introduction
Dyes dissolved in liquid crystal hosts have long been the subject of research due to their potential for use in practical applications, arising from the ease with which their optical properties may be switched by the application of an electric field [Citation1]. In general, display technology has been the most widely proposed application for these systems because the incorporation of a suitable dye or mixture of dyes within a host in a liquid crystal cell provides a device that may be switched from a transmitting state to an absorbing state. Many variations on this basic concept have been proposed, for example, dual-layer devices [Citation2] or devices incorporating quarter-wave plates [Citation3] that do not require polarisers, phase-change devices that utilise cholesteric host molecules [Citation4] and scattering devices utilising smectic A hosts [Citation5]. Such guest–host systems have also been proposed for other wide-ranging applications, such as smart windows [Citation6], solar cell precursors [Citation7], security devices [Citation8], diffraction gratings [Citation9] and polarisers [Citation10].
The majority of these devices and applications are based on mixtures containing rod-like dye molecules that have transition dipole moment (TDM) vectors, which are the orientations within the molecular frame along which visible light absorption occurs, aligned with the principal axes along which the dyes align in a liquid crystal host. Dyes of this general type dissolved in a homogeneously aligned calamitic host exhibit maximum absorbance when the electric vector of incident polarised light is parallel with the host director (A||), and minimum absorbance when the electric vector of incident polarised light is perpendicular to the host director (A⊥). The dichroic ratio, R = A||/A⊥, is greater than 1 for structures of this type, and they are termed positive dichroics [Citation11]. Such systems generally lend themselves to devices giving negative contrast, where the device absorbs in the ‘off’ state and is switched to a transmitting ‘on’ state by the application of an electric field [Citation11]. For guest–host systems using just one dye, switching occurs between coloured and transmitting states, but for multi-component guests comprising dyes that have absorption bands at different wavelengths across the visible spectrum, guest–host systems may be produced that switch between black and transmitting states [Citation12].
Dye molecules that have TDM vectors orthogonal to their principal molecular axes are termed negative dichroics and exhibit values of R < 1 in a calamitic host. These compounds have also been proposed for use in devices based on guest–host mixtures [Citation13], in which the maximum absorbance occurs when the electric vector of incident polarised light is orientated perpendicular to the director. Such dyes readily enable devices that exhibit positive contrast [Citation14], and suitable mixtures of negative dichroic dyes also enable switching between black and transmitting states [Citation15].
The alignment of dye TDMs within both positive dichroic and negative dichroic guest–host systems may be quantified with the dichroic order parameter, S, defined in Equation (1) [Citation11], which takes values between 0 and 1 for positive dichroics, and values between 0 and −0.5 for negative dichroics. The dichroic order parameter is related directly to the absorbances, A||and A⊥, according to Equations (2) and (3), respectively [Citation16], where ε is the absorption coefficient of the visible absorption band of the dye, c is the concentration of the dye and l is the path length of the cell.
The dichroic order parameter arises from the distribution of angles, ϕ, made between the host director and the TDMs of the dyes, and may be expressed as a product of two contributing order parameters, given by Equation (4) [Citation17], assuming uniaxial molecular alignment. In this expression, Sθ is a molecular order parameter that is defined by the angle θ between the principal molecular axis of a dye molecule and the host director, where angular brackets denote an ensemble average. Sβ is a TDM order parameter that is defined by the angle, β, between the TDM associated with an electronic transition and the principal molecular axis of the dye molecule.
For systems comprising either purely positive dichroic dyes, or purely negative dichroic dyes, a dichroic order parameter with a large magnitude (ideally approaching 1 or −0.5, respectively) is crucial to device performance because it is this property that largely defines the contrast ratio between the absorbing and transmitting states. However, by incorporating a mixture of positive and negative dichroic dyes into a host system, or by using dyes which have multiple absorption bands in the visible region that have associated TDM vectors with different orientations, colour-switching devices may be constructed in which the application of a field causes a change in the colour of the cell [Citation18]. In these devices, contrast ratios are not necessarily as dependent on the order parameters of the dyes as they are in conventional guest–host devices [Citation18].
Although negative dichroic dyes have been the subject of much less research than positive dichroic dyes, there have been a range of reports of dyes exhibiting negative dichroism, including azo compounds [Citation14,Citation19], anthraquinones [Citation20–Citation25] and tetrazines [Citation26]. More recently than much of the initial research into negative dichroic dyes, a device mode has been suggested with wide viewing angles and a high contrast ratio using a black mixture of negative dichroic dyes, operating in both reflective and transmissive modes and without a polariser [Citation27]. Negative dichroic dyes have also been studied in the context of solar concentrators, for example, for use within smart windows where a colour-switching device utilising highly fluorescent negative dichroic dyes potentially provides improved properties over those containing non-fluorescent dyes [Citation28].
Many properties must be optimised for dye molecules to be of practical use in guest–host systems, such as the dichroic order parameter, colour, absorption coefficient, solubility and stability, and therefore the design of dye molecules for these applications is an extremely challenging problem. In particular, the relationship between the molecular structure and the dichroic order parameter is not always intuitive. A general approach to understanding this complex relationship has been provided by our recent development of computational methods to aid in dye design [Citation29–Citation32]. We have shown that a novel combination of molecular dynamics (MD) simulations and time-dependent density functional theory (TD-DFT) calculations, based on the application of Equation (4), can provide a rationale for observed trends in order parameters from calculations of Sθ and Sβ that are combined to give values of Sϕ that are directly comparable with experimental values of S. These methods have resulted in the successful prediction of order parameter trends for 1,5- and 2,6-disubstituted anthraquinones dyes and have demonstrated that the choice of principal molecular axis, which affects calculations of both Sθ and Sβ, may have a significant influence on the calculated dichroic order parameter [Citation32]. For the structures we have studied to date, we have found that an improved match with experimental trends was obtained by using the surface tensor z-axes, which are defined by the shape of the molecular surface [Citation33], as the principal molecular axes rather than the more conventionally used minimum moment of inertia (MOI) axes.
In general, confidence in computational methods is gained from their successful application to a wide range of systems. The computational methods described above successfully replicated the experimental order parameter trends for the dyes tested, but the molecular structures we studied were relatively closely related; all were positive dichroic dyes that exhibited experimental order parameters of S > 0.5 in a nematic host, and all exhibited only single transitions in the visible region. Negative dichroic dyes typically have much less rod-like shapes than positive dichroic dyes, giving molecular shapes for which the principal molecular axes may not be intuitive, and they may be expected to provide a more rigorous test of the applicability of the computational methods. The literature indicates that the general trend within anthraquinone dyes is for 1,4-diamino anthraquinones to exhibit positive dichroism, and for 1,4-diamido anthraquinones to exhibit negative dichroism [Citation23], suggesting that they might provide suitable structures to test the ability of our approaches to calculate order parameters of negative dichroic dyes. Moreover, 1,4-diamino anthraquinones are known to exhibit multiple absorption bands in the visible region of the spectrum [Citation34,Citation35], providing an additional test for the applicability of the computational methods.
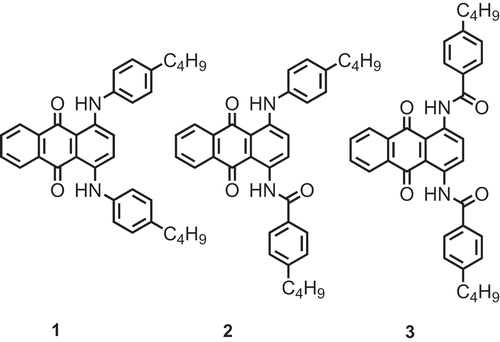
Hence, in this work, we extend the application of the computational methods we have recently developed to a set of more diverse anthraquinone structures in order to assess the scope of these methods. We present studies of three dyes: a 1,4-diamino anthraquinone, 1, a 1-amino-4-amido-anthraquinone, 2, and a 1,4-diamido anthraquinone, 3, all of which are shown in . These compounds each have n-butylphenyl substituents linked to the 1,4- positions of the anthraquinone by amine or amide linkages, providing a consistent set of structures to analyse. Compounds that are closely related to 1 have been reported to exhibit positive dichroic order parameters [Citation34–Citation37], whereas compounds that are closely related to 2 and 3 have been reported to exhibit negative dichroic order parameters [Citation23].
Figure 1. Structures and numbering of the dyes studied in this work.
We first present UV-visible absorption spectra of the dyes in isotropic solution and in the cyanobiphenyl-based nematic host E7, from which experimental absorption maxima, dichroic ratios and dichroic order parameters are determined for multiple absorption bands for each of the dyes. We then present the results of TD-DFT calculations on the dyes and fully atomistic MD simulations of the dyes in E7, from which calculated dichroic order parameters are determined for comparison with the experimental values. Previously developed methods are also extended to the calculation of polarised UV-visible absorption spectra of the dyes.
2. Experimental
2.1. Synthesis
Reactions were performed in oven-dried Ace pressure tubes (15 ml volume, back seal type) under an atmosphere of air for Chan-Lam couplings or dried nitrogen gas for amide synthesis. 1,4-Diaminoanthraquinone was obtained from Fluorochem and used without further purification (>95% purity), 4-butylphenylboronic acid was obtained from Sigma Aldrich (>98% purity). Copper (II) acetate was dried before use by heating under vacuum at ≈ 250 °C. 4-Butylbenzoylchloide was synthesised via a standard in-house acyl chloride preparation using oxalyl chloride and dimethylformamide, as we have described previously [Citation38].
Solvents were dried by percolation through activated alumina prior to use. Reactions were monitored by thin layer chromatography (TLC) with DCM as the eluent. Silica-coated aluminium TLC plates used were purchased from Merck (Kieselgel 60F-254) and visualised using either visible light, UV light (254 and 365 nm), or by oxidation with aqueous potassium permanganate solution.
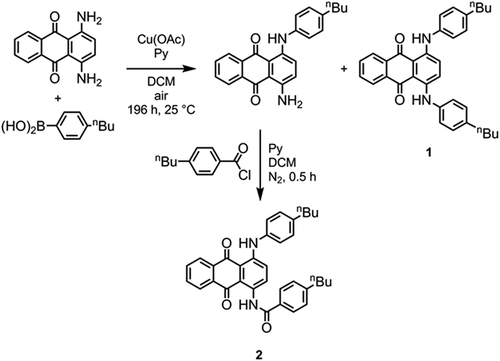
Synthesis of 1 (Scheme 1): A pressure tube was charged with 1,4-diaminoanthraquinone (735 mg, 3.09 mmol), 4-butylphenylboronic acid (550 mg, 3.09 mmol), copper (II) acetate (100 mg), pyridine (474 mg, 6 mmol) and DCM (60 ml). The vessel was sealed to prevent solvent evaporation; the flask was periodically opened to allow the internal atmosphere to be replaced by air. The reaction was monitored by TLC and deemed complete after 7 days. The two major components of the mixture, 1-amino-4-((4-butylphenyl)amino)anthraquinone and dye 1, were separated by flash chromatography with 3:2 hexanes/DCM as the eluent and were individually recrystallised from toluene. 1: TLC: Rf 0.68 (DCM); 1H NMR (400 MHz, CDCl3): 0.93 (6H, t, J = 7.3 Hz, –CH2–CH3), 1.31–1.41 (4H, m, –CH2–CH2–CH3), 1.56–1.65 (4H, m, –CH2–CH2–CH2–), 2.58 (4H, t, J = 7.3 Hz, Ar–CH2–CH2–), 7.16–7.18 (8H, m, ArH–C4H9), 7.45 (2H, s, ArH), 7.74 (2H, dd, J = 3.3 Hz, J = 5.9 Hz, ArH), 8.37 (2H, dd, J = 3.3 Hz, J = 5.9 Hz, ArH), 12.26 (2H, broad S, Ar–NH–Ar′). 1-Amino-4-((4-butylphenyl)amino)anthraquinone: TLC: Rf 0.175 (DCM);1H NMR (400 MHz, CDCl3): 0.94 (3H, t, J = 7.4 Hz, –CH2–CH3), 1.32–1.43 (2H, m, –CH2–CH2–CH3), 1.55–1.65 (2H, m, –CH2–CH2–CH2–), 2.61 (2H, t, J = 7.4 Hz, Ar–CH2–CH2–), 6.89 (1H, d, J = 9.5 Hz, ArH), 7.13–7.20 (4H, m, ArH), 7.46 (1H, d, J = 9.5 Hz, ArH), 7.70–7.76 (2H, m, ArH), 8.31–8.39 (2H, m, ArH), 12.11 (1H, broad S, Ar–NH–Ar′).
Synthesis of 2 (Scheme 1): 4-Butylbenzoyl chloride was added in one portion to a stirred solution of 1-amino-4-((4-butylphenyl)amino)anthraquinone (50 mg, 135 μmol) in DCM (1 ml) and pyridine (1 ml). The reaction was monitored by TLC and complete after 0.5 h, with complete consumption of the starting material (blue, RfDCM = 0.175) and formation of a new material (red, Rf = 0.33) noted. The reaction mass was concentrated in vacuo and purified by flash chromatography with DCM as the eluent. The chromatographed material was recrystallised from neat isopropanol. TLC: Rf 0.33 (DCM); 1H NMR (400 MHz, CDCl3): 0.93 (6H, t, J = 7.3 Hz, –CH2–CH3), 1.31–1.41 (4H, m, –CH2–CH2–CH3), 1.56–1.65 (4H, m, –CH2–CH2–CH2–), 2.58 (4H, t, J = 7.3 Hz, Ar–CH2–CH2–), 7.16–7.18 (8H, m, ArH–C4H9), 7.45 (2H, s, ArH), 7.74 (2H, dd, J = 3.3 Hz, J = 5.9 Hz, ArH), 8.37 (2H, dd, J = 3.3 Hz, J = 5.9 Hz, ArH), 12.26 (2H, broad S, Ar–NH–Ar′).
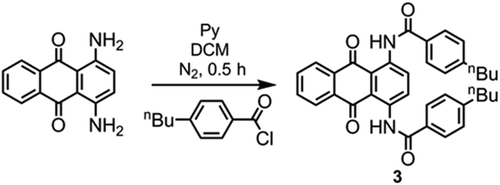
Synthesis of 3 (): The experimental procedure was as employed in the synthesis of 2. Quantities used: 4-butylbenzoyl chloride (3 mmol), 1,4-diaminoanthraquinone (238 mg, 1 mmol), DCM (2 ml), pyridine (2 ml). The reaction mass was purified by flash chromatography with DCM as the eluent, affording the title compound as a red microcrystalline solid following recrystallisation from acetonitrile. Data was consistent with literature values [Citation20]. TLC: Rf 0.30 (DCM); melting point: 231–232 °C; 1H NMR (400 MHz, CDCl3): 0.95 (6H, t, J = 7.3 Hz, –CH2–CH3), 1.33–1.45 (4H, m, –CH2–CH2–CH3), 1.61–1.71 (4H, m, –CH2–CH2–CH2–), 2.71 (4H, t, J = 7.3 Hz, Ar–CH2–CH2–), 7.37 (4H, d, J = 8.5 Hz, ArH–C4H9), 7.79–7.85 (2H, m, ArH), 8.07 (4H, d, J = 8.5 Hz, ArH–C4H9), 8.32–8.37 (2H, m, ArH), 9.43 (2H, s, ArH), 13.50 (2H, broad S, Ar–NHC(O)–Ar).
Scheme 1. The synthetic pathway to dyes 1 and 2.
Scheme 2. The synthetic pathway to dye 3.
2.2. Spectroscopy
The nematic host mixture E7 (Merck) and dichloromethane (≥99.9%, Fisher) were used as received. Dye-E7 mixtures were prepared at concentrations of ca. 1–2 wt%, heated above the clearing point, and subsequently sonicated for ca. 2 min while cooling to room temperature to ensure full dissolution of the dyes. Planar-aligned cells (Instec) with a path length of 20 μm were filled by capillary action while heated above the clearing point of the mixtures. Visual inspection of the cells under a microscope with crossed polarisers confirmed homogeneous alignment of the mixtures and no evidence of precipitation or crystallisation of the dyes was observed.
UV-visible absorption spectra of the dyes in dichloromethane were recorded at room temperature (ca. 20 °C) and against a solvent background, using matched quartz cells (1 cm) and a Hitachi U-3010 spectrophotometer. Polarised UV-visible absorption spectra of aligned guest–host mixtures were recorded using a Agilent Cary 8454 spectrophotometer with a rotatable Glan-laser polariser (Newport 10GL08) between the sample and the detector. The samples were held at 300 K in a temperature-controlled holder custom-built at the University of York. Polarised absorption spectra of an aligned sample of E7 alone were recorded using the same method and were subtracted from the guest–host spectra to obtain the spectra presented.
2.3. Computational studies
DFT calculations were performed using the Gaussian 09 package [Citation39]. Structure optimisations and TD-DFT calculations were carried out at the PBE0/6-311G(d,p) level [Citation40,Citation41], which has been shown generally to be successful for the prediction of visible absorption spectra of organic dyes [Citation42]. Fully atomistic MD simulations were carried out using GROMACS 5.1.2 [Citation43–Citation49], and the General Amber Force Field (GAFF) [Citation50], with adjustments reported for the simulation of liquid crystal phases [Citation51]. Atomic charges were determined using the RESP method for the optimised structures [Citation52]. Simulations were run with periodic boundary conditions using 2-fs steps and all bond lengths were constrained at their equilibrium geometries using the LINCS algorithm [Citation53]. The simulations were run at 300 K using a Nosé–Hoover thermostat [Citation54,Citation55], and maintained at a pressure of 1 bar using Parrinello–Rahman pressure coupling [Citation56,Citation57]. Electrostatic interactions were calculated using the Particle Mesh Ewald method with a cut-off of 1.2 nm [Citation58], and the same cut-off was used for van der Waals interactions. Simulations were run from pseudo-nematic starting geometries with five dye molecules in 400 host molecules, as described previously [Citation29], and trajectory frames were recorded every 25 ps. Order parameters of the host molecules were defined as twice the negative of the middle eigenvalue of the Q-tensor [Citation51], and plots of order parameter against time are shown as 20-point averages for clarity. Standard errors of the order parameters determined from the MD simulations were calculated using the method described by Chodera [Citation59], and gave standard errors between 0.004 and 0.045, dependent on the data set and the particular order parameter calculated; these order parameters are given consistently to three decimal places, and the standard errors are listed in full in the supplementary information.
Solvent-excluded molecular surfaces for the calculation of molecular surface tensors were determined using the MSMS algorithm [Citation60], with a rolling-ball radius of 2 Å, representative of the radius of a CHn group [Citation61], and using a triangulation density of 5 Å −2 consistent with previous studies [Citation62,Citation63]. The surface tensors and principal axes were defined using the method described previously, in which we define the surface tensor z-axis as the eigenvector associated with the eigenvalue with the smallest magnitude in the diagonalised Cartesian surface tensor [Citation32]. The surface tensor y-axis was defined as the eigenvector associated with the eigenvalue with the largest magnitude, and the surface tensor x-axis was defined as orthogonal to the y and z axes.
3. Results and discussion
3.1. Experimental results
Dyes 1, 2 and 3 dissolved in dichloromethane gave blue, violet and orange solutions, respectively, as shown by the photograph in . UV-visible absorption spectra of these solutions are shown in , and the absorption maxima and associated absorption coefficients are listed in . Each of the dyes exhibits a band at long wavelength in the 490–650 nm range, and a band at shorter wavelength in the 330–410 nm range. The long-wavelength visible absorption bands of such substituted anthraquinone dyes are typically attributable to amine/amide-to-quinone intramolecular charge–transfer transitions, and the shift of this band to shorter wavelength on going from 1 to 3 is consistent with the decrease in the electron-donating character on going from amine to amide substituents. Calculated UV-visible spectra of the dyes are also shown for comparison and are discussed in Section 3.2.
Figure 2. (Colour online) Photograph of solutions of the dyes at ca. 1 × 10⁻⁴ mol dm−3 in dichloromethane.
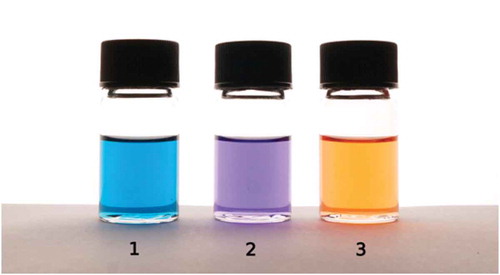
Figure 3. Experimental UV-visible absorption spectra of solutions of the dyes at ca. 1 × 10⁻⁴ mol dm−3 in dichloromethane plotted as absorption coefficient. Calculated spectra are also shown and were obtained by summing Gaussian peaks of 50 nm full-width at half-maximum at each calculated transition with an intensity equal to the respective calculated oscillator strength, f (shown as lines) .
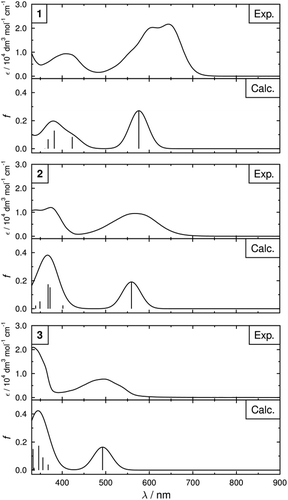
Table 1. Experimental visible absorption maxima, λmax, and absorption coefficients, εmax, of the dyes.
Planar-aligned cells were filled with mixtures of each dye in the nematic host mixture E7, and photographs of these cells illuminated with polarised white light oriented parallel and perpendicular to the alignment direction of the cells are shown in , giving a significant colour change for each of the samples when the polarisation orientation is changed. Polarised UV-visible absorption spectra of these samples, recorded at 300 K, are shown in with the electric vector of the polarised light oriented parallel, A||, and perpendicular, A⊥, to the alignment direction of the cells. Plots of the dichroic ratio, R, against wavelength are shown beneath each spectrum. The average dichroic ratios of the long- and short-wavelength bands were determined over the full-width at half-maximum (FWHM) of the bands, except for the short-wavelengths bands of 2 and 3 where the absorbance of the host gave a short-wavelength limit of 360 nm. These regions are shaded on each spectrum in , and the average dichroic ratios and the experimental dichroic order parameters, Sexp, determined according to Equation (1) are given in .
Figure 4. (Colour online) Photographs of planar-aligned cells containing the dye-E7 mixtures, backlit with polarised white light. The images are shown as composites of the respective images, split to show the colours when lit with the light polarised parallel and perpendicular to the alignment orientation. Image processing was identical for each image.
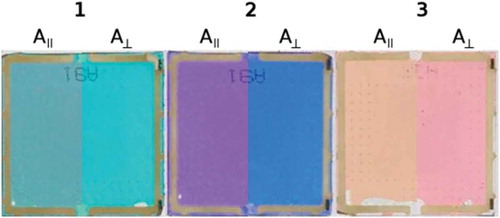
Figure 5. Experimental polarised UV-visible absorption spectra of the dyes at ca. 1–2 wt% in E7 in planar-aligned cells at 300 K. Beneath each plot is the dichroic ratio plotted against wavelength, and regions shaded in grey are those over which average dichroic ratio values were determined for the band.
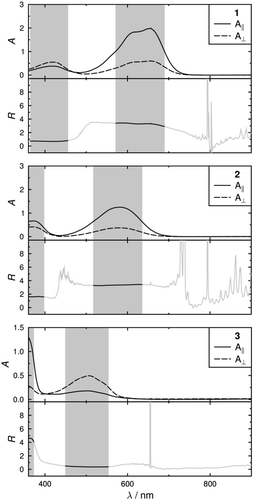
Table 2. Experimental visible absorption maxima, λmax, dichroic ratios, R, and dichroic order parameters, Sexp, determined from the spectra shown in Figure 5.
For each dye, the experimental dichroic order parameters of the long- and short-wavelength bands differ significantly, indicating that the underlying transitions are polarised in different orientations within the molecular frame of each of the dyes, consistent with the variation in observed colours with incident light polarisation shown in . There are also significant differences between the dyes: the long-wavelength bands of dyes 1 and 2 have positive order parameters, whereas the long-wavelength band of 3 has a negative order parameter; and the short-wavelength band of 1 has a negative order parameter whereas the short-wavelength bands of 2 and 3 exhibit positive order parameters.
The experimental dichroic order parameters given in are consistent with most reports of order parameters of closely related compounds in nematic hosts. Compounds similar to 1 with various alkyl chain lengths have been reported to have order parameters in the range 0.2–0.5 for the long-wavelength band in nematic hosts [Citation34,Citation36,Citation37], and dye 1 itself has been reported to exhibit order parameters of 0.5 and −0.13 for the long- and short-wavelength bands, respectively, in a cyclohexyl-cyanophenyl host [Citation35]. The long-wavelength band of the C8 analogue of 3 is reported to have an order parameter of −0.33 in a nematic host [Citation23]. The long-wavelength band of a compound with the same core structure as 2 is reported to have an order parameter of −0.05 [Citation23], which is somewhat different from that determined for 2 in this work but may be attributable to the difference in overall molecular structure as well as the different host mixture used.
3.2. Electronic structure calculations
DFT-optimised structures of the dyes are shown in , and each exhibits a planar anthraquinone core with the NH substituents also lying in the same plane, stabilised by hydrogen-bonding with the anthraquinone carbonyl groups. The phenyl groups of the phenylamine substituents in 1 and 2 lie at an angle to the plane of the anthraquinone core, consistent with the configurations adopted by 1,5-phenylamino anthraquinone dyes [Citation30], whereas the phenyl groups of the phenylamide substituents in 2 and 3 are close to co-planar with the anthraquinone core. The calculated UV-visible absorption spectra of these structures are shown in , showing a generally close match between experimental and calculated spectra, and the calculated wavelengths and oscillator strengths are listed in . Axes are also overlaid on the structures shown in , corresponding to the calculated TDM vectors (red), the minimum MOI axes (blue) and the surface tensor z-axes (green). For each dye, the calculated TDM vectors show significant variation in orientations between the different calculated transitions. Qualitatively, this is consistent with the experimental dichroic ratios and order parameters in and , which show significant differences between the long- and short-wavelength bands for each of the dyes.
Figure 6. (Colour online) Structures of the dyes optimised at the PBE0/6-311G(d,p) level with minimum MOI axes (blue), surface tensor z-axes (green) and transition dipole moment vectors (red) with lengths proportional to the respective calculated oscillator strengths overlaid.
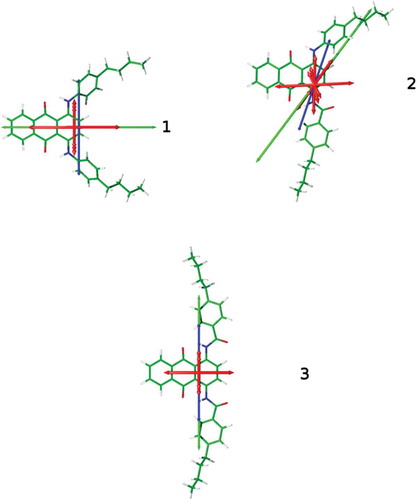
Table 3. Calculated transition wavelengths, λ, oscillator strengths, f, angles between the TDM vectors and the minimum MOI axes (βMOI) and the surface tensor z-axes (βsurface) and their associated order parameters, Sβ.
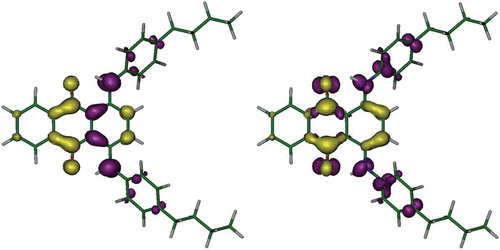
The reason for the different orientations of the TDM vectors within the dyes lies in the nature of the electron-density shifts associated with the different transitions. shows the calculated electron density shifts associated with the two lowest energy calculated transitions of 1, illustrating the difference in electron-density shifts between the two transitions. The lowest energy transition of 1 is calculated to give a significant electron-density shift that arises from a HOMO involving the amine nitrogen atoms and carbon atoms in the adjacent anthraquinone ring, and a LUMO located on the central anthraquinone moiety, such that the transition is polarised along the anthraquinone long axis. By contrast, the second lowest energy transition of 1 is calculated to give a significant electron-density shift that arises from a HOMO – 1 orbital that is located mainly on the amine nitrogen atoms and the phenyl substituents, and the same LUMO, such that the transition is polarised perpendicular to the anthraquinone long axis. Hence, the polarisations of these two transitions of 1 are orthogonal to each other and give rise to the orthogonal TDM vectors shown in . A similar account can be given to explain the orientations of all the TDMs of the dyes and how they relate to the different molecular structures.
Figure 7. (Colour online) Calculated electron-density shifts overlaid on the optimised structure of 1 for the lowest energy excitation (left) and the second lowest energy excitation (right). Density shifts are from the regions shown in purple to the regions shown in yellow using cut-offs of ±0.0025 e Bohr−3.
The orientations of the minimum MOI axes and the surface tensor z-axes of the dyes, both relative to the orientations of the anthraquinone moieties and relative to each other, illustrate the complexity of the molecular axis definitions for dye structures that are not rod-like. In the case of the 1,5-disubstituted anthraquinone dyes we have studied previously, the minimum MOI axes and surface tensor z-axes were found to exhibit only slight differences in orientation [Citation32], but for the structures studied here, dye 1 exhibits surface tensor z-axes and minimum MOI axes that are orthogonal, whereas 2 has these axes offset by 19°, and 3 has these axes coincident. The angles, β, between both definitions of the principal molecular axes and the calculated TDM vectors are listed in , along with their contributions, Sβ, to the dichroic order parameters. It is notable that the values of Sβ exhibit significant variation between the two different axis definitions for 1 and 2, for which the MOI and surface tensor axes are not coincident; these differences highlight the importance of the choice of principal axis when quantifying molecular alignment, and confirm the suitability of these structures to provide a rigorous test of the applicability of these definitions. The relative orientations of the TDM axes to the surface tensor x and y-axes are given by the angles, α, which are also listed in and are defined as the angle between the x-axis and the projection of the TDM on to the xy plane. For large values of β, the values of α are all <15°, showing that the TDMs tend to lie in or close to the zx plane, which approximately describes the plane of the anthraquinone core.
3.3. MD simulations
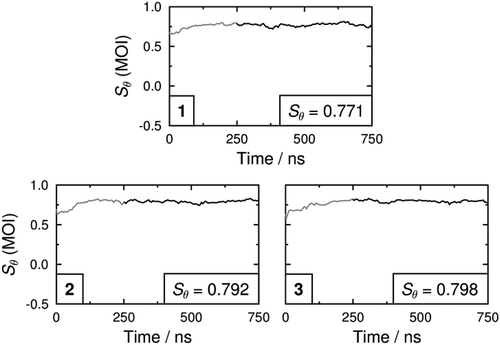
Fully atomistic MD simulations of each dye in E7 were run for 750 ns, and the molecular order parameters, Sθ, of the minimum MOI axes of the host molecules of E7 during the simulations are shown in . The minimum MOI axes were used here to define the principal molecular axes because we have shown previously that they provide a very close match with the surface tensor z-axes of the E7 component molecules whilst avoiding the significant computational expense of the surface tensor analysis for the full simulations [Citation32]. The average values of Sθ over the last 500 ns of the simulations are also given as insets in , demonstrating that the order parameters of the host molecules in these three guest–host mixtures are very similar, with values in the range of 0.77–0.80. These values are higher than the experimental value of ca. 0.64 for E7 alone [Citation29,Citation64], but they provide a significant improvement on that of ca.0.88 we obtained when using the OPLS (Optimised Potential for Liquid Simulations) force field in earlier studies [Citation29]. This improvement may be primarily attributed to the weaker Lennard–Jones interactions of the aromatic carbon atoms in the adapted GAFF force field used here [Citation51].
Figure 8. Molecular order parameters, Sθ (MOI), of the minimum MOI axes of the E7 molecules in each of the guest-host MD simulations. The insets give average values that were determined between 250 and 750 ns.
The molecular order parameters, Sθ (MOI), of the minimum MOI axes of the dye molecules in the guest–host simulations, determined against the host director and calculated according to the first term of Equation (4), are shown in the left plots in . The average values over the last 500 ns of the simulations, given in , suggest that all three dye molecules exhibit lower molecular order parameters than the host molecules, which is consistent with the less rod-like shapes of the dye molecules. In our previous work, we observed that the trend in the calculated order parameters of the host molecules in guest–host mixtures matched that of the guest molecules, and that is the case again for these simulations [Citation31], demonstrating that the addition of guest molecules has an influence on the calculated alignment of the overall mixture.
Figure 9. (Colour online) Molecular order parameters, Sθ, of the minimum MOI axes (black; left plots) and the principal, secondary and tertiary surface tensor axes (light green, medium green and dark green, respectively; right plots) of the dye molecules in each of the guest–host MD simulations. The average values given in were determined between 250 and 750 ns.
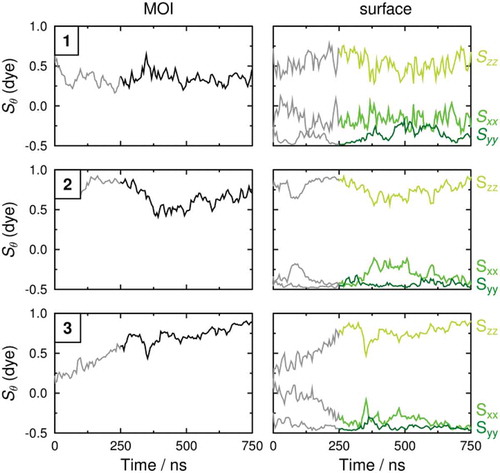
Table 4. Molecular order parameters determined from the minimum MOI axes and from the principal, secondary and tertiary surface tensor axes (Szz, Sxx and Syy, respectively) of the dyes relative to the host director, calculated from the MD simulations by averaging between 250 and 750 ns.
The molecular order parameters obtained from the surface tensor x, y and z axes are also shown in , and the average values over the last 500 ns of the simulations are listed in . A comparison of these values with the average order parameters of the minimum MOI axes demonstrates that the surface tensor z-axes of each of the dyes exhibit higher order parameters than the respective minimum MOI axes. This result is consistent with our earlier studies, which showed that the surface tensor z-axes are a better definition of the principal molecular axes of guest dye molecules.
In our previous study of dyes for which the minimum MOI and surface tensor z-axes were shown to have very similar orientations [Citation32], only relatively subtle differences in the order parameters of the different axes were calculated, but in the systems studied here the average order parameters from the two definitions differ by up to almost 0.2. The difference between the two calculated order parameters of each of the dyes is consistent with the orientations of the minimum MOI and surface tensor z-axes shown in : dye 1, which has the largest difference in the orientations of these two axes has the largest difference in order parameters, whereas dye 3, which has coincident MOI and surface z-axes for its optimised geometry, has the smallest difference in order parameters. The higher order parameters of the surface tensor z-axes than the minimum MOI axes again show the surface tensor z-axes to be a better definition of the principal molecular axes of these guest molecules.
3.4. Calculated dichroic order parameters
Calculated dichroic order parameters of the dyes, Sϕ, were obtained via Equation (4) using both the minimum MOI axes and the surface tensor z-axes, and the values are listed in . The calculation of these order parameters is straightforward for the long-wavelength bands, which are calculated to arise from single transitions, enabling the direct use of Equation (4). However, the short-wavelength bands were calculated to arise from a number of different transitions, in some cases with different values of β, as listed in . The calculated dichroic ratios of these bands were determined by summing the absorbance contributions from the total number of transitions, m, contributing to each band, according to Equation (5), which is derived from Equations (2) and (3), and where Sϕi is the calculated order parameter of each transition determined using Equation (4). This approach assumes that the absorption coefficient of each transition, i, is proportional to the calculated oscillator strength, fi, and that all the transitions provide a wavelength-independent contribution to the band. The results obtained from this method are consistent with the experimental dichroic ratios, which are essentially wavelength independent across the bands; an alternative, wavelength-dependent, approach is discussed in Section 3.5. The overall calculated dichroic order parameter of each band, Sϕ, was then determined from this dichroic ratio according to Equation (1).
Table 5. Calculated dichroic order parameters of the long- and short-wavelength bands of the dyes using the minimum MOI axes and the surface tensor z-axes as definitions of the principal molecular axes according to Equation (4).
These calculated dichroic order parameters are listed in , and those for the short-wavelength bands were obtained using the transitions listed at <450 nm in . The results show that the choice of axis definition has a significant influence on the calculated values, and that the values obtained using the minimum MOI axes predict the incorrect sign of the experimental order parameters for three of the six bands measured, whereas the values from the surface tensor z-axes predict the correct sign for every band measured. This trend provides further evidence that the surface tensor z-axes provide a better description of the principal molecular axes than the minimum MOI axes for guest dye molecules in anisotropic hosts.
The method used to calculate the dichroic order parameters listed in is consistent with that we reported previously, in which the systems are considered to be uniaxial and hence Equation (4) may be used to calculate Sϕ [Citation32]. This assumption is appropriate for rod-like molecules for which β is small, but for less rod-like molecules, such as those studied here, it is important to consider the influence of biaxiality on the calculated dichroic order parameters. Equation (6) is a modified version of Equation (4) [Citation65,Citation66] that includes the biaxial order parameter (Sxx − Syy), which is calculated as the difference in molecular order parameters arising from the secondary and tertiary molecular axes. The order parameters of the secondary and tertiary surface tensor axes of the dyes during the MD simulations are shown in (right plots), and both the average values and the average differences (Sxx− Syy) are given in . The non-zero values of the biaxial order parameters demonstrate that the molecular alignment of the dyes within the MD simulations is not uniaxial, consistent with their relatively flat, non-rod-like molecular shapes, and it indicates that the influence of biaxiality on the dichroic order parameters may be significant.
Hence, the dichroic order parameters were recalculated using Equation (5) and the surface tensor axes but using Equation (6) to calculate values of Sϕi that include the influence of biaxiality; these calculated order parameters are listed in and are shown graphically in alongside those calculated assuming uniaxiality. The most notable differences between the two sets of values arise for the bands which are calculated to have large values of β, such as the short-wavelength band of 1 and the long-wavelength bands of 2 and 3; in each of these cases, including the biaxiality term makes the calculated order parameter more positive and results in a better match with the experimental value.
Figure 10. (Colour online) Plot of the experimental dichroic order parameters (grey), and the values calculated using the minimum MOI axes (blue), using the surface tensor z-axes and assuming uniaxial alignment (dark green), and using all the surface tensor axes to include the effect of biaxiality (light green).
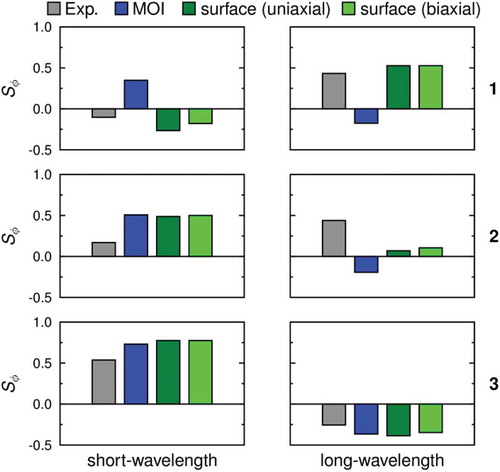
Table 6. Calculated dichroic order parameters of the dyes using surface tensor axes as the principal molecular axes, and using Equation (6) to include the influence of biaxiality.
Overall, the results shown in demonstrate that the computational methods developed and applied here are capable of correctly predicting the sign of the dichroic order parameters for both of the visible bands for each of the dyes studied. This result is particularly significant in view of the fact that these alignment trends are not necessarily intuitive from the structures alone. The most significant differences between the calculated and experimental values are found for dye 2, which has an asymmetric structure that is the most complex of the dyes, and it has the most variation in the TDM orientations for the transitions contributing to the visible bands. However, the calculations still predict that both the long- and short-wavelength bands exhibit positive dichroic order parameters, consistent with the experimental values.
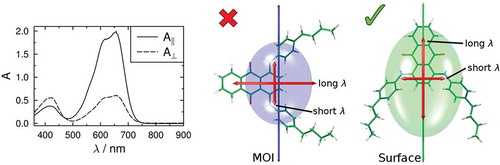
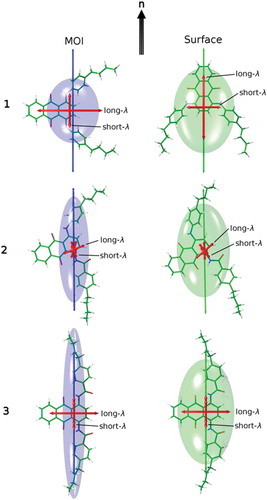
The importance of the choice of principal molecular axis for these systems is highlighted in , which shows visualisations of the inertia and surface tensors of the dyes in their preferred orientations relative to the director, n, based on the two models. The differing molecular orientations correspond with the respective minimum MOI and surface tensor z-axis orientations shown in . The resulting TDM orientations versus the director that give the mismatch with the signs of the experimental dichroic order parameters when using the minimum MOI axes highlight the need for principal molecular axes to be carefully defined. The improved match from using the surface tensor z-axes suggests that the molecular shape is the major factor in determining the alignment of these guest molecules, and the differences in the shapes of the inertia tensor and surface tensor ellipsoids in show the significance that the choice of molecular frame can have; these molecules provide a clear illustration of the effect of choosing incorrect axis definitions in the theoretical treatment of liquid crystal systems.
Figure 11. (Colour online) Optimised structures of the dyes shown with their minimum MOI axes (left, blue) and their surface tensor z-axes (right, green) overlaid and oriented, respectively, along a vertical host director, n. The respective ellipsoids have their principal axes along the eigenvectors of the MOI and surface tensors, with dimensions proportional to the reciprocal of the respective eigenvalues. The calculated visible TDM vectors are also shown in red.
3.5. Calculation of polarised UV-visible absorption spectra
A more sophisticated application of the calculation methods than comparing dichroic order parameters alone may be obtained by generating calculated polarised UV-visible absorption spectra to provide a comparison with the experimental spectra shown in . Such a comparison enables a concurrent assessment of the results of combining MD and TD-DFT results to calculate the alignment of the different TDMs, as well as of TD-DFT for calculating the transition energies of the dyes. Calculated polarised UV-visible absorption spectra were generated by assuming that the absorption coefficient of each calculated transition, i, was proportional to the calculated oscillator strength, fi, and that each transition had a Gaussian band-shape. Values of A||and A⊥ at each wavelength were determined according to Equations (7) and (8), based on Equations (2) and (3), where n is the total number of calculated transitions contributing to the spectrum, λi is the calculated wavelength of transition i, and Δλi is the FWHM of the Gaussian band.
The calculated spectra were generated using all the transitions listed in and values of Sϕi determined from Equation (6) using the surface tensor axes. The calculated polarised spectra are shown in and generally show a good match with the experimental spectra, in terms of both band positions and relative intensities. As noted above, the most significant differences occur for the relative intensities calculated for dye 2. Additionally, there is a significant difference between experimental and calculated band shapes of the long-wavelength transition of for dye 1, which may be attributed to the vibronic structure in the experimental spectrum that was not considered in the calculations performed here, although such an approach is possible with more advanced methods [Citation67]. However, the match between the experimental and calculated spectra is good across the three dyes, demonstrating that this combination of computational approaches enables the general form of the wavelength-dependent polarised absorption spectra of guest–host mixtures in devices to be predicted.
Figure 12. Normalised experimental and calculated polarised UV-visible absorption spectra of the dyes in E7. Calculated spectra were determined using Δλ = 80 nm for each Gaussian band and using calculated dichroic order parameters from the surface tensor axes.
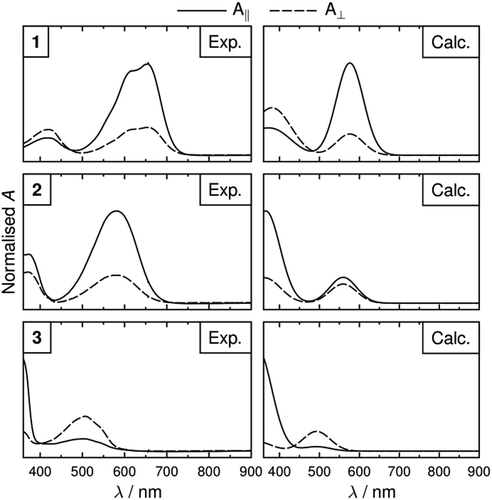
The polarised spectra in could also be used to calculate wavelength-dependent dichroic ratios and order parameters. The dichroic order parameters calculated with this approach for the long-wavelength bands are the same as those obtained using Equation (5) because they arise from single transitions, whereas those for the short-wavelength bands may differ slightly because they arise from multiple transitions at different wavelengths, which, in the case of 1 and 2, have slightly different TDM orientations. Calculations using this approach may also be influenced by the FWHM value chosen, and by the effect of vibronic structure. Hence, for the dyes studied here, we consider that Equation (5) is more appropriate to calculate values of Sϕ for the long- and short-wavelength bands, as listed in and . However, the wavelength-dependent approach via Equations (7) and (8) provides a useful ability to obtain calculated polarised spectra, as illustrated in .
4. Conclusions
The experimental polarised UV-visible absorption spectra of three phenyl-amine/amide substituted anthraquinone dyes dissolved in the nematic host E7 were shown to be relatively complex. Each dye was shown to exhibit long- and short-wavelength visible bands, with the dichroic order parameters differing significantly between the bands and between the dyes. This complex set of experimental data has enabled a rigorous assessment of our previously developed methods for predicting the dichroic order parameters of dyes in liquid crystal hosts.
The results of TD-DFT calculations on optimised structures of the dyes reflected the complexity observed experimentally, with several transitions of different energy and different TDM orientations within the molecular frame calculated to contribute to the absorption spectrum of each dye. The importance of the choice of principal molecular axis was demonstrated by these calculations, with the orientations of the surface tensor z-axes and minimum MOI axes varying between coincident and orthogonal between the three dyes.
The influence of the principal molecular axis definition was also reflected in the results of the fully atomistic guest–host MD simulations, in which the minimum MOI axes were calculated to give significantly lower molecular order parameters than the surface tensor z-axes. Further, the calculated dichroic order parameters obtained by using the minimum MOI axes incorrectly predicted the signs of the order parameters for three of the six absorption bands analysed, whereas the signs of the order parameters were correctly predicted for all six bands when the surface tensor z-axes were used. These results provide convincing evidence to support our previous results, which indicated that the surface tensor z-axes provide a better description of the principal molecular axes of dye molecules in nematic hosts than the minimum MOI axes.
For five of the six bands, the match between the calculated and experimental dichroic order parameters was unchanged or improved when the uniaxial model was extended to include biaxial alignment of the dyes within the host. In general terms, this result supports the importance that we have demonstrated previously of removing assumptions in the theoretical treatment of dye alignment in guest–host mixtures. It is likely that the match between experimental and calculated values could be improved further if molecular flexibility was included in the calculation of TDM orientations within the dyes, as we have shown in other studies [Citation32], but this additional analysis comes at a significant computational cost. The good matches demonstrated here without the influence of flexibility show that very useful results may be achieved for a relatively accessible computational expense, and with much-reduced user input when compared with that required when flexibility is included in the TDM calculations.
Further extensions to the computational methods enabled calculated polarised UV-visible absorption spectra to be generated. Thus, a method is presented that provides an approach to predicting wavelength- and polarisation-dependent optical properties of guest–host devices, without the input of any experimental data.
Overall, the methods we have demonstrated and developed here may be able to provide valuable tools for the design and optimisation of dyes and guest–host mixtures for liquid crystal device applications.
TLCT_1333639_Supplemental data
Download PDF (187.2 KB)Acknowledgements
We thank Dr Laurence Abbott and Dr Stephen Cowling for useful discussions. Data from this article are available by request from the University of York Data Catalogue at http://dx.doi.org/10.15124/06329a1e-86d1-4480-ae99-0dcd94591044.
Disclosure statement
No potential conflict of interest was reported by the authors.
Additional information
Funding
References
- Heilmeier GH, Zanoni LA. Guest-host interactions in nematic liquid crystals. A new electro-optic effect. Appl Phys Lett. 1968;13:91–92.
- Uchida T, Seki H, Shishido C, et al. Bright dichroic guest-host LCDs without a polarizer. Proc SID. 1981;22:41–46.
- Cole HS, Kashnow RA. A new reflective dichroic liquid-crystal display device. Appl Phys Lett. 1977;30:619–621.
- White DL, Taylor GN. New absorptive mode reflective liquid-crystal display device. J Appl Phys. 1974;45:4718–4723.
- Ebru AB, Maxim M, Børre H, et al. Flexible bistable smectic-a polymer dispersed liquid crystal display. Jpn J Appl Phys. 2006;45:4146–4151.
- Debije MG. Solar energy collectors with tunable transmission. Adv Funct Mater. 2010;20:1498–1502.
- Carrasco-Orozco M, Tsoi WC, O’Neill M, et al. New photovoltaic concept: liquid-crystal solar cells using a nematic gel template. Adv Mater. 2006;18:1754–1758.
- Carrasco-Vela C, Quintana X, Oton E, et al. Security devices based on liquid crystals doped with a colour dye. Opto-Electron Rev. 2011;19:496–500.
- De Sio L, Ricciardi L, Serak S, et al. Photo-sensitive liquid crystals for optically controlled diffraction gratings. J Mater Chem. 2012;22:6669–6673.
- Peeters E, Lub J, Steenbakkers JAM, et al. High-contrast thin-film polarizers by photo-crosslinking of smectic guest–host systems. Adv Mater. 2006;18:2412–2417.
- Bahadur B. Liquid crystals: applications and uses. Singapore: World Scientific; 1992.
- Scheffer TJ. Optimized three‐component dye mixtures for achromatic guest‐host liquid‐crystal displays. J Appl Phys. 1982;53:257–264.
- Uchida T, Wada M. Guest-host type liquid-crystal displays. Mol Cryst Liq Cryst. 1981;63:19–43.
- Rumyantsev VG, Ivashchenko AV, Muratov VM, et al. Dyes with negative dichroism for liquid crystal displays based on the guest-host effect. Mol Cryst Liq Cryst. 1983;94:205–212.
- Umanskii B, Prudnikova E, Torgova S. Designing a black mixture by dichroic dyes for liquid crystal devices. Mol Cryst Liq Cryst Sci Technol, Sect A. 1999;332:27–36.
- Sims MT. Dyes as guests in ordered systems: current understanding and future directions. Liq Cryst. 2016;43:2363–2374.
- Rothschild KJ, Clark NA. Polarized infrared spectroscopy of oriented purple membrane. Biophys J. 1979;25:473–487.
- Schadt M. Field-induced color switching in liquid crystal displays. J Chem Phys. 1979;71:2336–2344.
- Ivashchenko AV, Petrova OS, Titov VV. Heteroaromatic azo dyes exhibiting negative dichroism in liquid crystals. Mol Cryst Liq Cryst. 1984;108:51–60.
- Ivashchenko AV, Lazareva VT, Prudnikova EK, et al. Anthraquinone dyes exhibiting negative dichroism in liquid crystals I. Derivatives of 1-amino-and 1, 4-diaminoanthraquinones. Mol Cryst Liq Cryst. 1985;129:259–266.
- Ivashchenko AV, Lazareva VT, Prudnikova EK, et al. Anthraquinone dyes exhibiting negative dichroism in liquid crystals II. Derivatives of 1, 4-diamino- and 1-amino-4-hydroxy-anthraquinones. Mol Cryst Liq Cryst. 1985;129:267–275.
- Ivashchenko AV, Lazareva VT, Prudnikova EK, et al. Anthraquinone dyes exhibiting the negative dichroism in liquid crystals III. Derivatives of diaminodihydroxyanthraquinones. Mol Cryst Liq Cryst. 1985;129:277–283.
- Imazeki S, Kaneko M, Ozawa T, et al. Anthraquinone dyes with negative dichroism. Mol Cryst Liq Cryst. 1988;159:219–231.
- Matsui M, Sumiya Y, Shibata K, et al. Fluorine-containing negative dichroic 1,4-bis(Acylamino)anthraquinone dyes. Liq Cryst. 1997;23:821–832.
- Prudnikova E, Umanskii B, Plyusnina T. Synthesis of new dichroic dyes with negative dichroism for a black mixture. Mol Cryst Liq Cryst Sci Technol, Sect A. 1999;332:37–41.
- Demus D, Krücke B, Kuschel F, et al. 3-N-Alkyl-6–[4-N-Alkyloxy-Phenyl] −1,2,4,5-tetra-zines - New stable dyestuffs with liquid-crystalline properties. Mol Cryst Liq Cryst. 1979;56:115–121.
- Chigrinov V, Prudnikova E, Ng KW, et al. Non polarizer guest–host mode based on dyes with negative dichroism. Jpn J Appl Phys. 2003;42:1297–1300.
- Debije MG, Menelaou C, Herz LM, et al. Combining positive and negative dichroic fluorophores for advanced light management in luminescent solar concentrators. Adv Opt Mater. 2014;2:687–693.
- Sims MT, Abbott LC, Cowling SJ, et al. Dyes in liquid crystals: experimental and computational studies of a guest–host system based on a combined DFT and MD approach. Chem – Eur J. 2015;21:10123–10130.
- Sims MT, Abbott LC, Cowling SJ, et al. Molecular design parameters of anthraquinone dyes for guest-host liquid-crystal applications: experimental and computational studies of spectroscopy, structure and stability. J Phys Chem C. 2016;120:11151–11162.
- Sims MT, Abbott LC, Cowling SJ, et al. Experimental and molecular dynamics studies of anthraquinone dyes in a nematic liquid-crystal host: a rationale for observed alignment trends. Phys Chem Chem Phys. 2016;18:20651–20663.
- Sims MT, Abbott LC, Cowling SJ, et al. Principal molecular axis and transition dipole moment orientations in liquid crystal systems: an assessment based on studies of guest anthraquinone dyes in a nematic host. Phys Chem Chem Phys. 2017;19:813–827.
- Ferrarini A, Moro GJ, Nordio PL, et al. A shape model for molecular ordering in nematics. Mol Phys. 1992;77:1–15.
- Soroka PV, Pergamenshchik VM, Boiko OP, et al. Aggregation of anthraquinone dye molecules in a nematic liquid crystal. Mol Cryst Liq Cryst. 2014;589:96–104.
- Imazeki S. Order parameters of α-substituted anthraquinone dyes in a nematic liquid crystalline host. Mol Cryst Liq Cryst. 1986;140:119–130.
- Milanchian K, Abdi E, Tajalli H, et al. Nonlinear refractive index of some anthraquinone dyes in 1294-1b liquid crystal. Opt Commun. 2012;285:761–765.
- Marrucci L, Paparo D, Maddalena P, et al. Role of guest-host intermolecular forces in photoinduced reorientation of dyed liquid crystals. J Chem Phys. 1997;107:9783–9793.
- Mandle RJ, Davis EJ, Voll CCA, et al. The relationship between molecular structure and the incidence of the ntb phase. Liq Cryst. 2015;42:688–703.
- Frisch MJ, Trucks GW, Schlegel HB, et al. Gaussian 09, revision B.01. Wallingford CT: Gaussian Inc.; 2009.
- Adamo C, Barone V. Toward reliable density functional methods without adjustable parameters: the PBE0 model. J Chem Phys. 1999;110:6158–6170.
- Krishnan R, Binkley JS, Seeger R, et al. Self-consistent molecular orbital methods. XX. A basis set for correlated wave functions. J Chem Phys. 1980;72:650–654.
- Jacquemin D, Perpète EA, Scuseria GE, et al. TD-DFT performance for the visible absorption spectra of organic dyes: conventional versus long-range hybrids. J Chem Theory Comput. 2008;4:123–135.
- Abraham MJ, Murtola T, Schulz R, et al. Gromacs: high performance molecular simulations through multi-level parallelism from laptops to supercomputers. SoftwareX. 2015;1–2:19–25.
- Páll S, Abraham MJ, Kutzner C, et al. Tackling exascale software challenges in molecular dynamics simulations with gromacs. In: Markidis S, Laure E, editors. Solving Software Challenges for Exascale: International Conference on Exascale Applications and Software, Easc 2014; Stockholm, Sweden; 2014 April 2-3. Revised Selected Papers. Cham: Springer International Publishing; 2015. p. 3-27.
- Pronk S, Páll S, Schulz R, et al. Gromacs 4.5: a high-throughput and highly parallel open source molecular simulation toolkit. Bioinformatics. 2013;29:845–854.
- Hess B, Kutzner C, van der Spoel D, et al. Gromacs 4: algorithms for highly efficient, load-balanced, and scalable molecular simulation. J Chem Theory Comput. 2008;4:435–447.
- Van Der Spoel D, Lindahl E, Hess B, et al. Gromacs: fast, flexible, and free. J Comput Chem. 2005;26:1701–1718.
- Lindahl E, Hess B, van der Spoel D. Gromacs 3.0: a package for molecular simulation and trajectory analysis. Mol Model Annu. 2001;7:306–317.
- Berendsen HJC, Vanderspoel D, Vandrunen R. Gromacs - a message-passing parallel molecular-dynamics implementation. Comput Phys Commun. 1995;91:43–56.
- Wang J, Wolf RM, Caldwell JW, et al. Development and testing of a general amber force field. J Comput Chem. 2004;25:1157–1174.
- Boyd NJ, Wilson MR. Optimization of the gaff force field to describe liquid crystal molecules: the path to a dramatic improvement in transition temperature predictions. Phys Chem Chem Phys. 2015;17:24851–24865.
- Bayly CI, Cieplak P, Cornell W, et al. A well-behaved electrostatic potential based method using charge restraints for deriving atomic charges: the resp model. J Phys Chem. 1993;97:10269–10280.
- Hess B, Bekker H, Berendsen HJC, et al. Lincs: a linear constraint solver for molecular simulations. J Comput Chem. 1997;18:1463–1472.
- Nosé S. A molecular dynamics method for simulations in the canonical ensemble. Mol Phys. 1984;52:255–268.
- Hoover WG. Canonical dynamics: equilibrium phase-space distributions. Phys Rev A. 1985;31:1695–1697.
- Parrinello M, Rahman A. Polymorphic transitions in single crystals: a new molecular dynamics method. J Appl Phys. 1981;52:7182–7190.
- Nosé S, Klein ML. Constant pressure molecular dynamics for molecular systems. Mol Phys. 1983;50:1055–1076.
- Darden T, York D, Pedersen L. Particle mesh ewald: an N Log(N) method for ewald sums in large systems. J Chem Phys. 1993;98:10089–10092.
- Chodera JD. A simple method for automated equilibration detection in molecular simulations. J Chem Theory Comput. 2016;12:1799–1805.
- Sanner MF, Olson AJ, Spehner JC. Reduced surface: an efficient way to compute molecular surfaces. Biopolymers. 1996;38:305–320.
- Yang L, Tan C-H, Hsieh M-J, et al. New-generation amber united-atom force field. J Phys Chem B. 2006;110:13166–13176.
- Ferrarini A, Janssen F, Moro GJ, et al. Molecular surface and order parameters in liquid crystals. Liq Cryst. 1999;26:201–210.
- Di Matteo A, Ferrarini A, Moro GJ. Effects of electrostatic interactions on orientational order of solutes in liquid crystals. J Phys Chem B. 2000;104:7764–7773.
- Pelaez J, Wilson M. Molecular orientational and dipolar correlation in the liquid crystal mixture E7: a molecular dynamics simulation study at a fully atomistic level. Phys Chem Chem Phys. 2007;9:2968–2975.
- van Gurp M, van Langen H, van Ginkel G, et al. Angle-resolved techniques in studies of organic molecules in ordered systems using polarized light. In: Samori B, Thulstrup EW, editors. Polarized spectroscopy of ordered systems. The Netherlands: Kluwer Academic Publishers. 1988; 455–489.
- Kiefer R, Baur G. Molecular biaxiality in nematic liquid crystals as studied by infrared dichroism. Mol Cryst Liq Cryst. 1989;174:101–126.
- Jacquemin D, Bremond E, Ciofini I, et al. Impact of vibronic couplings on perceived colors: two anthraquinones as a working example. J Phys Chem Lett. 2012;3:468–471.