
ABSTRACT
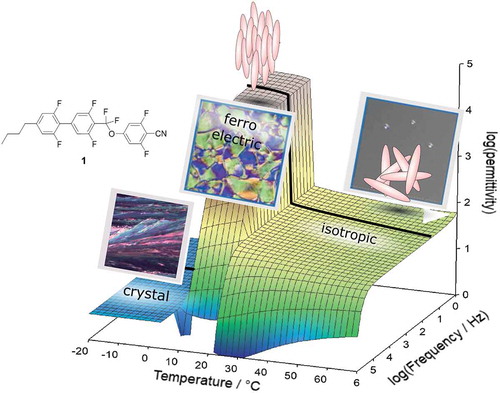
We report a liquid crystal 1 that shows ferroelectricity at room temperature. 1 directly enters the ferroelectric nematic phase from the isotropic phase upon cooling, without the formation of a conventional nematic phase. The synthesis, microscopic texture observations and dielectric spectroscopy measurement results of 1 are presented. A relative permittivity of over 20000 is observed in the ferroelectric nematic phase. Together with its low melting point the new liquid crystal will accelerate application research and device prototyping in various directions.
Graphical
1. Introduction
Virtually all modern Liquid Crystal Displays are based on nematic calamitic liquid crystals [Citation1]. These are fluid phases composed of rod-shaped (calamitic) molecules that align with their long molecular axes and possess anisotropic properties such as birefringence and two dielectric constants.
For the liquid crystal to switch in an electric field, it must possess a non-zero dielectric anisotropy, Δε, a quantity that is related to the molecular polarisability, the dipole moment and its orientation with respect to the long molecular axis [Citation2]. Without an external field, ordinary nematic phases show only orientational order along a preferred direction, the so-called director, and molecular dipole moments are distributed randomly. It is, however, conceivable, and was postulated as early as 1916 by Max Born [Citation3], that molecular dipole moments are in fact correlated, and a macroscopic dipole moment arises over the bulk material or in separated domains with inversed direction. The latter phenomenon was reported in 2017 by Mandle et al. [Citation4,Citation5] - more than a hundred years after Born’s paper - in a polar aromatic diester containing a nitro-group. Only a few weeks earlier, Kikuchi and co-workers had published another highly polar molecule that exhibits two new phases with apparently ferroelectric ordering [Citation6]. Ferroelectricity in the compounds reported by Mandle [Citation4,Citation7] was later confirmed experimentally [Citation7] and further explored by a different group [Citation8].
These recent discoveries have found a wide echo in the soft materials community and a bright, although still blurry future for potential applications has been postulated. The current state of affairs of these exciting new developments has recently been summarised by Lavrentovich [Citation9].
We now report a liquid crystal that shows ferroelectricity at room temperature, whereas other published materials exhibit the new phases at much higher temperatures. Furthermore, our material directly enters the ‘ferroelectric nematic’ phase from the isotropic phase upon cooling without the formation of a conventional nematic phase.
2. Molecule description
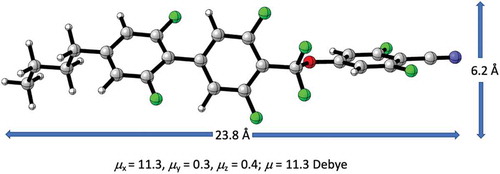
The molecular structure of the new liquid crystal 1 is shown in . It contains fluorinated biphenyl- and phenyl units bridged by a difluoromethoxy group. The core structure is flanked by an n-butyl side chain and a terminal cyano group. The local dipoles of the rings, bridge and terminal group add up to a total dipole moment of 11.3 Debye calculated at the B3LYP/6-31G(d) level of theory. The direction of the dipole vector is almost perfectly parallel to the long molecular axis.
Figure 1. (Colour online) Molecular structure of 1 with calculated molecular dimensions and dipole moment
3. Synthesis and characterisation
Scheme 1. Synthesis of 1
The synthesis of 1 starts from 1-bromo-3,5-difluoro-4-carboxylic acid chloride 2 which is converted to 5 via its dithianylium salt derivative 3 [Citation10]. Boronic ester 6 is then coupled [Citation11] with 1-bromo-2,6-difluoro-4-butylbenzene 7 to furnish 1, in 30% overall yield [Citation12]. 1 crystallises in the triclinic space group P-1. There are four independent molecules in the asymmetric unit that represent different conformers of the molecular structure. Because of symmetry constraints there is no macroscopic dipole moment in the solid state. The molecules are packed in parallel aligned infinite groups that are related to each other by crystallographic inversion centres [Citation13].
4. Experimental observation
4.1. Mesophase behaviour
shows a Differential Scanning Calorimetry (DSC) trace of 1, the cooling rate is 10 K min−1). At room temperature the material is crystalline, and it melts directly to an isotropic liquid at 44°C upon heating (not shown). On cooling, a mesophase, later identified as ‘nematic’ by its texture (see below), appears at 19.6°C, with a transition enthalpy of 2.1 kJ mol−1. It crystallises at around -7°C.
Figure 2. (Colour online) DSC of 1 on cooling down
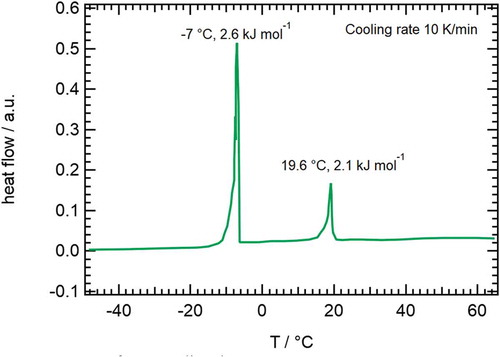
Another run was made to observe the transition from ‘nematic’ to isotropic, by heating up again before the crystallisation occurs. The isotropic phase is entered at 21.8°C with an enthalpy of 2.6 kJ mol−1. The DSC-trace looks normal for a single material with a monotropic nematic phase. 1 shows a weak first order transition, but with elevated transition enthalpies for both directions.
4.2. Microscope observation
The textures were observed under a polarisation microscope with crossed polarisers and temperature controller. The sample was applied on a clean slide glass with cover glass, so the thickness of the film is unknown. Surfaces have no preferred orientation. As the sample is crystalline at room temperature, it was heated above its melting point first and then cooled down.
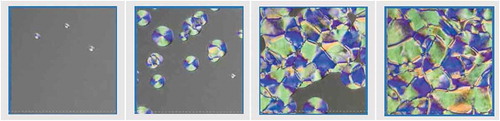
shows the texture change from isotropic to nematic under crossed polarisers, with a cooling rate of 5 K/min. The image sizes are 200 μm x 200 μm. Upon cooling, small droplets appear (a) and grow in size (b). Unlike typical nematic droplets, the disk circularity is very high, and most exhibit a symmetrically divided pattern in four segments with two colours on opposite sides. When the sample is further cooled down, the droplets begin to fuse (c), and eventually cover the whole area (d). The typical domain size is around 50 μm. This texture (d) remains stable during further cooling down, until the crystallisation occurs at around -7°C. It is interesting to note that the disclination lines appear slightly straighter with time.
Figure 3. (Colour online) (a-d) (from left to right): Microscopic texture change of 1 upon cooling down from isotropic to ‘nematic’ phase. (a) Appearance of droplets, (b) Growing droplets, (c) Fusing process of droplets, (d) Final quasi-stable ‘nematic’ texture. Images are artificially brightened to optimise texture visibility
During the texture development from (c) to (d), a slow spontaneous flow of disclination lines is observed only for the first transition. This flow is quasi one-dimensional and the movement of disclination lines appears coordinated. The flow is not observed in subsequent trials, probably due to the surface memory effect of the glass substrates.
The transition from ‘nematic’ to isotropic could also be observed by heating the sample before it crystallises. Snapshots of this process are shown in .
Figure 4. (Colour online) (a-d) (from left to right): Microscopic texture change of 1 upon heating up from the ‘nematic’ to the isotropic phase. (a) Stable ‘nematic’ texture, (b) Appearance of string fine pattern with domain structure maintained, (c) Disappearance of domain structure, (d) New texture with thin needle-like pattern. Images are artificially brightened to optimise texture visibility
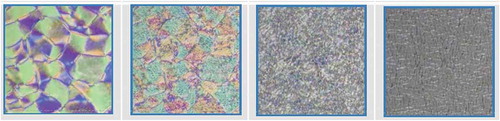
The stable ‘nematic’ texture (4a) changes into a new texture with fine structures of parallel thin and tiny bars (4b). The domain colour difference is still maintained here, but on further heating up it disappears (4c). With another texture change, where thin linear lines dominate (4d), it goes back to the isotropic phase.
The phase change in the cooling down process is a direct transition from isotropic to ‘nematic’ with a small temperature range of intermittent co-existence. Concerning the phase sequence observed by heating up, care should be taken. It is unclear, whether the textures shown in can be assigned as individual stable phases with very narrow temperature ranges or just as transitional ones. Careful investigations with much smaller temperature gradients would be necessary.
During the microscope observation, a simple fluidity check of the ‘nematic’ phase can be made by pressing the cover glass and its fluid state is confirmed. Stripe-domain patterns, which were reported [Citation6] in the MP phase of DIO (see ), from the transition from M2 to MP were not observed at all.
Table 1. Three materials known to exhibit ferroelectric-like nematic phases: Molecular structures, transition temperatures (°C), transition enthalpies (kJ mol−1, in parentheses), molecular length and width (Å) and dipole moments μ (Debye), calculated at B3LYP/6-31G(d). All transitions are estimated on cooling (marked with ↓) except melting from the crystalline phase (marked as ↑)
4.3. Epsilon measurement by dielectric spectroscopy
The permittivity is measured with a dielectric spectrometer by Novocontrol consisting of an Alpha-N High Resolution Dielectric Analyser and a Novocool temperature control unit. The sample holder is a Standard Sample holder BDS1200 with a custom-made sample cell designed for liquid samples (see e.g [Citation14]). The sample cell is made from polished stainless steel with a cell gap of 110 µm. Prior to filling, the sample cell was thoroughly cleaned with acetone and isopropanol. An appropriate amount of material was weighed in and melted before sealing the cell in order to avoid bubbles within the investigated volume. In addition to this cell, a sample cell with ITO electrodes as described in [Citation6] with a cell gap of 10 µm was used for comparison. The real part of the permittivity is measured for temperatures T between 70 and -20°C either with a ramp of 1 K min−1 at a fixed frequency f of 1 kHz or in steps of 2°C with frequencies between 1 MHz and 1 Hz. In the latter case, equilibration time for each temperature step is 10 minutes. In all measurements the orientation of the materials is not controlled. Therefore, anchoring forces and the specific order of the director is not discussed in this communication.
shows a full dielectric scan of 1 with the conditions described above. Three regimes can be identified, namely an isotropic phase for T > 35°C where the measured permittivity is weakly depending on temperature following a typical Curie-law well known for LCs [Citation2]. Between 35°C and 20°C molecular modes appear that lead to an increase of epsilon from ~100 to ~1000 strongly depending on the analysed frequency. Below 20°C a sudden phase transition appears where the permittivity is sharply increased to a huge value of over 20000. The exact value is depending on the frequency applied and the cell gap used. Below 10°C crystallisation is observed where the permittivity is breaking down to values of less than 10.
Figure 5. (Colour online) Full dielectric scans according to experimental details for 110 µm cell gap (left) and 10 µm cell gap (right). Cuts through in the temperature plane for frequencies of 103 Hz, 104 Hz and 105 Hz are also shown. Here, the sharp phase transition is marked with a broken line at 20°C
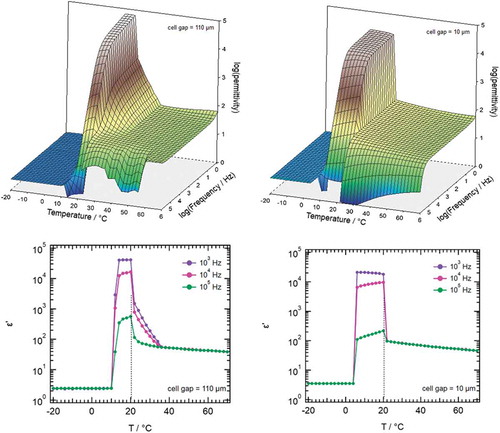
The increase of permittivity in the temperature range between 35°C and 20°C is normal for highly polar liquid crystal materials with a nematic phase. However, in the microscope texture as well as in the DSC, a typical sign for nematic behaviour is missing and we interpret this observation as a pre-transitional effect possibly depending on the experimental conditions such as cell-gap etc. To check this, we performed an additional scan with a thin cell gap of 10 µm. As shown in , the pre-transition behaviour is absent, supporting the conclusion of pre-transition dynamics. It also vanishes if we apply a temperature ramp at fixed frequency, see . The data show again the isotropic phase with a sharp transition at 20°C, where the liquid crystal transits into the highly polar phase. In contrast to the slow step-by-step measurement discussed above, the pre-transitional increase of the permittivity between 35°C and 20°C is also missing.
Figure 6. (Colour online) Temperature ramp scan of permittivity according to experimental details for 110 µm cell gap. Full symbols and line show data upon cooling, the broken line shows heating data. The dotted line indicates again the sharp transition into the highly polar phase at 20°C
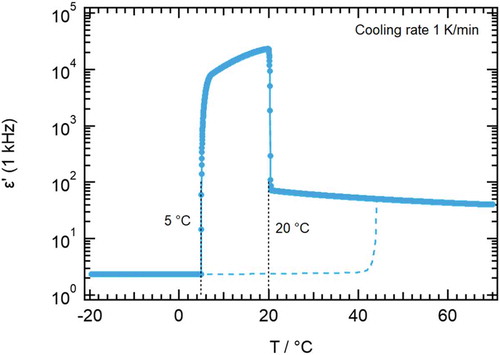
With a thin cell gap of 10 µm or with a large cell gap and a temperature ramp supercooling is observed. Crystallisation is shifted from 10°C to 5°C (see ). DSC data shown in are in particularly good agreement with the dielectric data shown here. Crystallisation is even further shifted to lower temperatures as expected for the large cooling rate (50 K min−1) compared to the dielectric experiments. It is remarkable that the phase transition into the ferroelectric phase is well reproduced on both experimental setups. From the dielectric experiments and the DSC scans we observe that the width of the highly polar phase is at least 10°C. The permittivity decreases for increasing frequency showing a distinct polarisation mechanism most likely due to a collective reorientation of molecules. This polarisation and the temperature dependency of permittivity are not investigated further here. In general, the interpretation is difficult since we do not control the order of the director in the sample cell.
Overall, three regimes are identified: An isotropic phase, a nematic-like phase with huge permittivities and a crystalline phase. The nematic-like phase is remarkably similar to the ‘MP phase’ described by Nishikawa, Kikuchi and co-workers [Citation6] who also investigated a material with a high molecular dipole moment (8.9 D, see ). The nematic-like phase is fluid (see discussion above), and it is likely that we observe similar ferroelectric behaviour as reported by Kikuchi et al. [Citation6] However, the highly polar phase of 1 has two remarkable differences compared to the material Nishikawa, Kikuchi et al. investigated: It is ferroelectric at room temperature, and it exhibits a direct transition from an isotropic phase to a ferroelectric phase.
5. Discussion
Pertinent examples for compounds showing a ferroelectric-like nematic phase are compiled in .
All molecules contain rings and bridges and exhibit rod-like forms with similar dimensions and very high dipole moments along the molecular long axes. Polarity is generated by the dioxane ring, polar terminal groups, fluorine substituents, and ester and difluoromethoxy bridges, respectively. RM734 contains a lateral methoxy group that imparts an overall wedge-like shape [Citation7] to the molecule.
Based on these considerations, it appears that a large dipole moment in the long axis of a rod-like molecule is of primary importance for the appearance of a ferroelectric nematic phase.
Another important factor should be the length of the side chain. As reported by Mandle [Citation4], longer alkyl chains tend to lower transition temperatures. Longer alkyl chains could disturb the tendency to form dipole aligned structures. It is speculated that the low transition temperature of 20°C in 1 is due to the relatively long butyl chain. The synthesis of the complete homologue series is in progress and will help to understand this effect.
In RM734 and DIO, there are one and two intermediate phases observed between the isotropic and ferroelectric nematic phase, respectively. In contrast, 1 directly transits from isotropic to ferroelectric nematic. The reason for this different behaviour is unclear. Dipole–dipole interactions will certainly play a decisive role, but other, more subtle factors will also be important, such as specific intermolecular interactions and the influence of different conformers and their population at specific temperatures.
Even if the ferroelectric nematic phase has been elusive, we now have several examples of molecules that exhibit such a phase [Citation4–9,Citation15]. 1 is probably not the only example for the behaviour described in this paper. If molecules are designed with similar molecular length like DIO but with stronger dipole moment, they might also exhibit a direct transition from isotropic to ferroelectric nematic at much higher temperature than 1.
6. Practical importance
From the practical point of view, it is worth mentioning that 1 is the first single material to show ferroelectric nematic behaviour at room temperature. This is perhaps reminiscent of the landmark publications of Kelker et al. [Citation16,Citation17], where ordinary nematic phases around room temperature were reported for the first time, and the development of nematic materials for Liquid Crystal Displays started to flourish. Various feasibility studies of future possible applications have now become much easier. Nevertheless, the identification of materials or formulations that show true enantiotropic ferroelectric nematic phases in a reasonable operating temperature range is crucial for all future applications.
7. Conclusion and outlook
We have successfully synthesised and characterised the first single material which shows a direct transition from isotropic to ferroelectric nematic, and the first compound that is ferroelectric nematic around room temperature. This will accelerate application research or possible device prototyping in various directions. Detailed phase investigations using X-ray experiments, and mixture design to realise enantiotropic ferroelectric nematic phases with wider phase range are currently under investigation.
Acknowledgments
The authors are grateful to Harald Lannert for synthesis, Marc Sauer for DSC and microscopy observation, Patrick Schrod, Bettina Schröder and Dr. Simon Siemianowski for dielectric spectroscopy measurement, and Dr. Harald Untenecker for the X-Ray crystal structure determination.
Disclosure statement
No potential conflict of interest was reported by the author(s).
References
- Bremer M, Kirsch P, Klasen-Memmer M, et al. The TV in your pocket: development of liquid-crystal materials for the New Millennium. Angew Chem Int Ed. 2013;52:8880–8896.
- Maier W, Meier G. Eine einfache Theorie der dielektrischen Eigenschaften homogen orientierter kristallinflüssiger Phasen des nematischen Typs. Z Naturforsch. 1961;16a:262–267.
- Born M. Über anisotrope Flüssigkeiten. Versuch einer Theorie der flüssigen Kristalle und des elektrischen Kerr-Effekts in Flüssigkeiten. Sitzungsber Preuss Akad Wiss. 1916;30:614–650.
- Mandle RJ, Cowling SJ, Goodby JW. Rational design of rod-like liquid crystals exhibiting two nematic phases. Chem Eur J. 2017;23:14554–14562.
- Mertelj A, Cmok L, Sebastián N, et al. Splay nematic phase. Phys Rev X. 2018;8:041025.
- Nishikawa H, Shiroshita K, Higuchi H, et al. Material with highly polar order. Adv Mater. 2017;29(43):1702354.
- Sebastian N, Cmok L, Mandle RJ, et al. Ferroelectric-ferroelastic phase transition in a nematic liquid crystal. Phys Rev Lett. 2020;124:037801.
- Chen X, Korblova E, Dong D, et al. First-principles experimental demonstration of ferroelectricity in a thermotropic nematic liquid crystal: polar domains and striking electro-optics. Proc Nat Acad Sci. 2020;117:14021–14031.
- Lavrentovich OD. Ferroelectric nematic liquid crystal, a century in waiting. Proc Nat Acad Sci. 2020;2020(117):14629–14631.
- Kirsch P, Bremer M, Taugerbeck A, et al. Difluorooxymethylene-bridged liquid crystals: a novel synthesis based on the oxidative alkoxydifluorodesulfuration of dithianylium salts. Angew Chem Int Ed. 2001;40:1480–1484.
- Lennox AJ, Lloyd-Jones GC. Selection of boron reagents for Suzuki-Miyaura coupling. Chem Soc Rev. 2014;43:412–443.
- 1H-NMR (400 MHz, Chloroform-d) δ 7.16 (d, J = 11.0 Hz, 2H), 7.07 – 6.99 (m, 2H), 6.91 – 6.81 (m, 2H), 2.69 – 2.61 (m, 2H), 1.69 – 1.57 (m, 2H), 1.39 (h, J = 7.4 Hz, 2H), 0.96 (t, J = 7.3 Hz, 3H).
- Crystal Data: C24H15F8NO, FW=485.37, Cu Kα (λ=1.5418 Å), T=298 K; a=9.3549(2) Å, b=19.5323(4) Å, c=24.7059(6) Å; α=82.1305(18)°, β=80.419(2)°, γ=88.2221(18)°, V= 4409.30(18) Å3; 59466 reflections, 13613 used with I > 2σ, 1230 parameters: Rint=0.0218, R1(I > 2σ)=0.0680, wR2(all data)=0.2288, GooF=1.065. The structure has been deposited at the Cambridge Crystallographic Data Center CCDC 2078430.
- Wipf R, Jaksch S, Stühn B. Dynamics in water-AOT-n-decane microemulsions with poly(ethylene glycol) probed by dielectric spectroscopy. Colloid Polym Sci. 2010;288:589–601.
- Connor PLM, Mandle RJ. Chemically induced splay nematic phase with micron scale periodicity. Soft Matter. 2020;16:324–329.
- Kelker H, Scheurle B. A liquid-crystalline (Nematic) phase with a particularly low solidification point. Angew Chem Int Ed. 1969;8:884–885.
- Kelker H, Scheurle B, Hatz R, et al. Liquid crystalline phases having particularly low freezing points. Angew Chem Int Ed. 1970;9:962–963.