
 ?Mathematical formulae have been encoded as MathML and are displayed in this HTML version using MathJax in order to improve their display. Uncheck the box to turn MathJax off. This feature requires Javascript. Click on a formula to zoom.
ABSTRACT
We report on observations of optical switching in bent-core liquid crystals possessing azocinnamoyl groups in both elongated side arms. UV-activated switching was observed in two of the synthesised materials, both of which were studied optically and with dielectric spectroscopy. Polarising microscopy was used to measure the changes in optical transmittance, and while no illumination effect was seen in the nematic phase, visible changes were observed in the smectic phase, most pronounced in the close vicinity of the smectic to nematic-phase transition. Switching dynamics was characterised, and we found that the average switching time varies strongly with temperature. The relaxation process is faster (below ) and exhibits no significant temperature dependence. Dielectric measurements have shown that the observed smectic C phases were not polar with the molecules possessing a rather small electric dipole moment. Upon illumination, small differences in the dielectric permittivity were observed only in the smectic phase, suggesting that the illumination effect can be attributed to changes in the molecular conformational and orientational order.
GRAPHICAL ABSTRACT
1. Introduction
Optical manipulation has expanded the suitability of liquid crystals (LC) to applications beyond the conventional display industry to the field of sensors, actuators and optical switches [Citation1–3]. The high temporal resolution of the illumination, combined with the non-contact approach, is very suitable for implementation of light for optical and mechanical manipulation of matter. One approach to making liquid crystals sensitive to light stimuli is to dope the LC host with photoactive materials, which may themselves exhibit LC phases [Citation4–6]. The alternative approach uses LC mesogens possessing chromophoric units [Citation7,Citation8].
When illuminated with light, the introduced photoactive molecules or chromophoric units undergo structural changes, which influence the long-range molecular order of the liquid crystalline phase. Upon light absorption, liquid crystals can, for example, reorient or align [Citation9], change spacing in the smectic phase [Citation10], undergo a phase transition [Citation11] or completely lose their intermolecular order and melt into the isotropic phase [Citation12,Citation13]. Even if the material does not undergo a photoinduced- phase transition, the interaction with incident light can still be manifested as changes in the physical properties of the material [Citation14]. Most notable are the visual transformations, as often changes in colour and transmittance can be observed by the naked eye or under polarising microscope [Citation13]. Changes are also observed in dielectric permittivity, most notably in ferroelectric liquid crystalline phases [Citation15].
A typical photoactive material, which is most often either mixed into the LC host or incorporated into mesogenic molecules, is azobenzene [Citation1,Citation16]. Its main feature is a simple yet prominent geometric change through reversible trans-cis isomerisation: by illumination with UV light, the trans-azobenzene transforms into a thermodynamically unstable cis isomer. Obtained cis isomer gradually returns to the stable trans state, a process which can be accelerated by visible light irradiation or by heat. Several decades of incorporating azo-derivatives into liquid crystals have led to a diverse variety of applications, such as tunable diffraction gratings [Citation17], optical data storage [Citation1], actuators [Citation3,Citation18] or photoswitchable catalysts [Citation19].
Adding photosensitive components to the material is not limited to calamitic liquid crystals but can also be expanded to other types, for example, bent-core liquid crystals (BCLC). A large variety of LC phases together with different functional responses have identified BCLC containing photosensitive azo groups as a suitable option for the development of functional materials [Citation20,Citation21]. We recently reported on the synthesis of BCLC with azocinnamoyl units in both elongated side arms [Citation22] and demonstrated the existence of both nematic and smectic C phases in two of the synthesised compounds. In this context, a similar behaviour, i.e. the formation of nematic and smectic phases, was reported by Šmahel et al. when they incorporated azobenzoyl group in one of the side arms [Citation23]. In contrast to azobenzoyl analogue, the ethylene group between the phenyl ring and the carboxylate group in the azocinnamoyl group enhances the longitudinal polarisability and increases the molecular length. Although cinnamoyl units are known to undergo several photoinduced processes, including trans-cis isomerisation and photodimerisation [Citation24], it has been shown that in solution, cycloaddition does not occur, and in liquid crystalline phase, only trans-cis isomerisation happens upon UV illumination [Citation25].
Here, we report on a systematic study of photoactivity in two bent-core liquid crystals with azocinnamoyl units that form both nematic and smectic liquid crystalline phases. We studied the sample behaviour upon illumination with UV light in both phases by observing the sample transmittance under a polarising microscope. The photoresponse of the compounds was measured, including the changes in transmitted intensity as well as material response and relaxation times as a function of temperature. Dielectric measurements provide additional information on the photoactive effect and yield light-induced permittivity changes in the samples. Given the tunability of both cinnamoyl and azobenzene units and the functional opportunities afforded by their combination, thorough characterisation of newly synthesised materials, in correlation with known and previously described material responses, helps identify structural properties which promote photoactive mesomorphic behaviour. Thus, an in-depth knowledge about the photoresponsivity is necessary in planning new applications based on BCLCs, especially when photoalignment, optical data storage or non-linear optical properties are pursued.
2. Experimental
2.1. Materials and sample preparation
A detailed synthesis of azocinnamoyl bent-core liquid crystals was described previously [Citation22]. Both the investigated molecules possess a five-ring structure with azocinnamoyl units in the side arms, with the compound A having one bromine atom in the central ring and the compound B having two chlorine atoms positioned symmetrically in the same central ring, as shown in . The molecular symmetry of compound A is thus lower than that of compound B, and the different substituents have an impact also on the molecule opening angle, smectic layer spacing and index of refraction, with compound A showing a larger layer spacing of approximately and birefringence in the nematic phase of
and compound B showing a layer spacing of
and
[Citation22].
Figure 1. Chemical structure of the investigated compounds with compound (a) having bromine in the central ring and compound (b) having two symetrically positioned chlorine atoms in the central ring.
The phase sequences and phase transition temperatures were previously determined by differential scanning calorimetry (DSC) and found to be (in ): Iso (148.8), N (131.3) and SmC (112.3) K for compound A and Iso (180.2), N (129.3) and SmC (92.0) K for compound B [Citation22]. As we used a different setup and open heating stage that enabled illumination with UV light, the transition temperatures, which we observed, deviated to a few degrees from the DSC ones. The data on the temperature are therefore given relative to the transition temperatures, which were observed under a polarising microscope as phase transition fronts at a cooling rate of
.
Samples were prepared by using commercially available planar cells (Instec F62 S100A200uG180, 20 μm, polyimide, antiparallel rubbing; and KSRP-05/D607P1NSS05 by EHC Co. Ltd, Japan, 5 μm). The thickness of the cells, which were used to measure the sample response upon illumination, was not additionally verified. We did, however, check that the absorbance in all the filled cells was small enough for the light to penetrate through the sample. Although the intensity was reduced to about in the 20-μm thick sample, we believe that this is still high enough to consider the sample illuminated through the whole thickness.
2.2. Polarisation microscopy
The cells were filled with photoactive liquid crystals in the isotropic phase at for compound A and
for compound B and subsequently cooled at the rate of
. We used an Instec heating stage (MK1) that enabled heating up to
and equipped it with a UV illumination lamp (
, LedEngin LED). The lamp provided homogeneous illumination of the whole sample at a measured irradiance of
(measured with Coherent LabMax TOP with PM1). Polarising microscope (Nikon Optiphot II) with a Canon EOS M200 camera was used for observation of the sample, determination of the phase transition temperatures and measurements of the transmitted intensity. A FLIR Blackfly S BFS-U3-17S7M (196 fps) camera was implemented for the observation of fast relaxation dynamics. The observed relative transmittance was found to be independent of the selection of the camera. It should be noted, however, that all camera settings were set manually to ensure comparable measurements. The acquired images were analysed using Fiji (ImageJ) software.
2.3. Dielectric measurements
Dielectric spectroscopy was conducted using Keysight E4980 precision LCR metre with probe voltage for sample B. A commercial EHC 5-μm cell was employed, and the empty cell capacitance was determined before filling it. The actual sample capacitance was measured as a function of temperature in the frequency range of
to
to ensure that any spurious low-frequency contribution or cell relaxation did not affect the observed changes. We measured the material’s permittivity as a function of frequency both with UV-light on and off at temperatures close to the phase transition (
and
below each transition) and also deep in the chosen phase.
3. Results and discussion
3.1. Optical properties
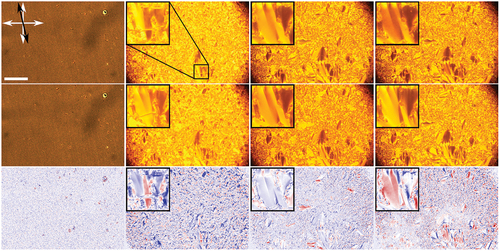
Both investigated substances exhibited the same mesophase sequence: isotropic–nematic–smectic C–crystalline, and the effect of UV-illumination was studied in both mesophases. First, the visual changes of compound A were observed under polarising microscope, and the obtained images are shown in .
Figure 2. (Colour online) Changes in compound A upon illumination with UV light as seen under a polarising microscope. Top: nematic phase, smectic C at , smectic C at
and smectic C at
with no UV light. Middle: same phases at the same temperatures under UV illumination. Bottom: calculated difference between the non-illuminated and illuminated images depicted as a heat map. Red denotes increased transmittance, blue decreased transmittance and white colour no change. Insets: close-ups of a chosen region of interest. White arrows indicate the orientation of the polarisers and the black arrow the direction of rubbing. Scale bar is
μm.
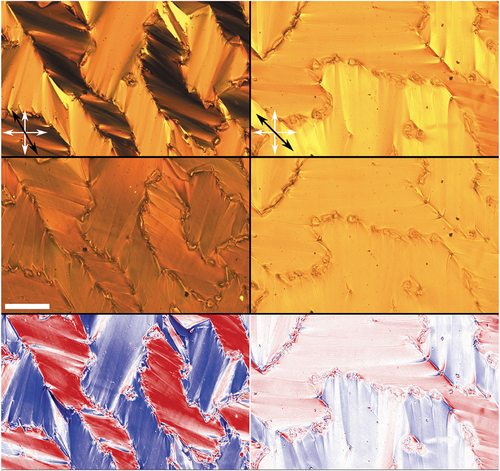
A much more pronounced effect is seen in compound B (), which also showed a notably more uniform alignment.
Figure 3. (Colour online) Changes in compound B upon illumination with UV light as seen under a polarising microscope. Top: nematic phase, smectic C at , smectic C at
and smectic C at
with no UV light. Middle: same phases at same temperatures under UV illumination. Bottom: calculated difference between the non-illuminated and illuminated images. Red denoted increased transmittance, blue decreased transmittance and white colour no change. White arrows indicate the orientation of the polarisers and the black arrow the direction of rubbing. Scale bar is
μm.
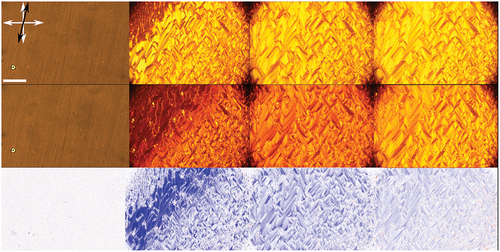
Similar to compound A, in compound B, no changes are observed in the isotropic, nematic and crystalline phase, but a drastic change in the transmitted intensity is seen in the smectic phase: the average overall transmitted intensity is reduced to ,
and
of the initial transmittance as the temperature is lowered. The highest overall change in transmitted intensity is thus observed close to the phase transition into the nematic phase (
). Locally, the change can be even larger; as under UV illumination, the transmitted intensity can be reduced to below
of the transmittance of the non-illuminated sample.
Further, we rotated the sample between crossed polarisers. Images showing the sample with the angle between the rubbing direction and the polariser being 30° and 45° are shown in .
Figure 4. (Colour online) Changes in compound B upon illumination with UV light as seen under a polarising microscope. Top: smectic C with no UV light when the angle between the rubbing direction and the polariser is 30° (left) and 45° (right). Middle: the same sample orientation under UV illumination. Bottom: calculated difference between the non-illuminated and illuminated images. Red denoted increased transmittance, blue decreased transmittance and white colour no change. White arrows indicate the orientation of the polarisers and the black arrow the direction of rubbing. Scale bar is μm.
Due to the molecular configuration of the smectic phase, the overall average transmitted intensity does not change significantly and is for both orientations reduced only by a few per cent ( and
). Locally, however, the changes are more prominent, especially when the sample is rotated for 30°: the transmitted intensity of the initially bright regions is locally reduced by almost
, whereas the transmitted intensity of the initially dark regions increases by a factor of around 4. When rotated for 45°, the difference in transmitted intensity between regions almost diminishes, as the brighter regions become darker (about
reduction in transmittance) and darker become brighter (at in increase of about
). In this case, the illuminated sample appears practically homogeneous with defect lines still present. We believe that the changes in the sample transmitted intensity are a direct consequence of the changes in molecular shape upon isomerisation and consequently in molecular ordering.
It should be noted that we did not observe any significant changes in the phase transition temperatures under UV illumination, nor did we observe any strong deterioration of the sample under repeated heating/cooling or exposure to UV light. The samples remained stable over several weeks. The changes in the sample transmittance indicate changes in the molecular configuration and related changes in the effective index of refraction; however, in all the investigated cases, the illumination did not induce a phase transition into the nematic or melting into the isotropic phase.
3.2. Switching dynamics
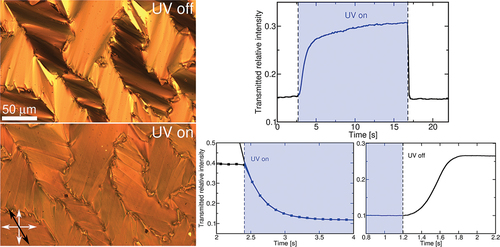
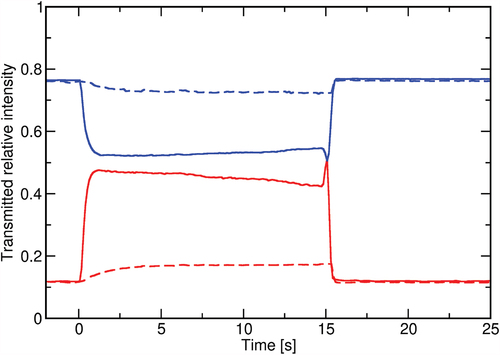
After identifying the changes in the transmitted intensity, we analysed the switching dynamics of both substances. By choosing a region of interest (ROI), the transmitted intensity was recorded as a function of time, while UV illumination was switched on/off. One example for substance B is shown in , where the change in transmittance of two selected ROIs is presented for two different temperatures.
Figure 5. (Colour online) Time dependence of the POM transmitted optical intensity upon switching the UV light on (at ) and off (at
). Different colours represent the transmittance of two chosen regions of interest at rubbing direction angle of 30° with respect to the polariser. Blue lines correspond to a chosen blue region in bottom left and red line to a chosen red region. Switching is shown for two different temperatures: solid line at
and dashed line at
.
In addition to the changes in the response magnitude, which lower with decreasing temperature, different response times are observed ().
Figure 6. (Colour online) Changes in the transmitted intensity upon UV illumination for sample B at different temperatures. Symbols are the measured data and the solid lines fitted exponential curves, from which the response times were determined. The measurements were shifted to a common initial value for better comparison.
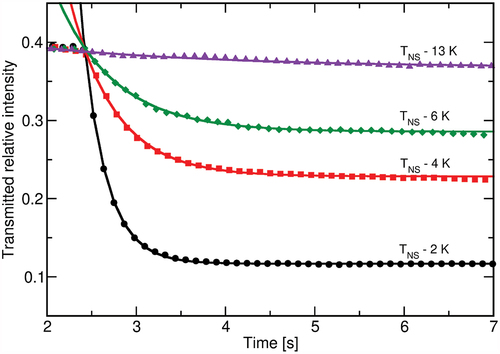
Table 1. Response times upon UV illumination at different temperatures.
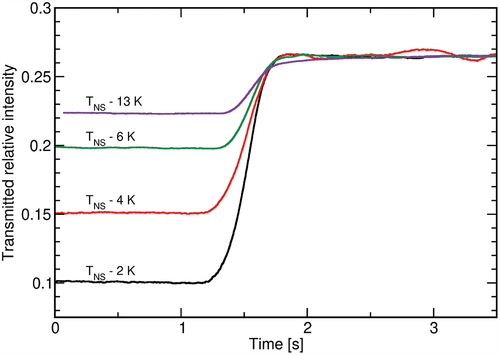
While illumination is kept switched on, only slight changes in the transmitted intensity can be observed, as seen in . In order for the sample to return to its initial state, the illumination needs to be switched off. The liquid crystal then quickly relaxes with a switching time of around . To analyse the switching-off characteristics in more detail, a faster camera was implemented, which recorded the transmittance at a frame rate of
fps. The observed behaviour for sample B is shown in , and one clearly sees that the relaxation dynamics cannot be sufficiently described by a single exponential relaxation. Nevertheless, we estimated the relaxation times, which are found to be
for sample A and
for sample B, independent of the temperature within the experimental accuracy.
Figure 7. (Colour online) Changes in the transmitted intensity upon switching off the UV illumination for sample B at different temperatures. The measurements were shifted to a common final value for better comparison.
3.3. Dielectric properties
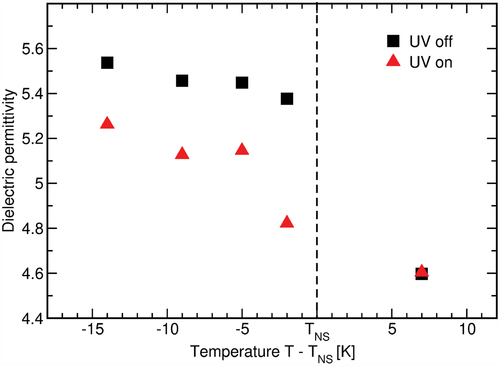
As substance B showed larger response to illumination, we used this substance to determine if optical changes can also be detected as changes in dielectric permittivity upon UV illumination in both nematic and smectic phases at different temperatures. Equivalently to optical observations, no difference is observed in the nematic phase. In the smectic phase, however, we observe a decrease in the permittivity in the illuminated sample (), which can be contributed to the combined effect of molecular isomerisation towards a more linear shape and the change in mesophase ordering. The largest change (
) is observed just below the transition from nematic to smectic phase, but a difference remains detectable deep into the smectic phase. Although some effect of the illumination is undoubtedly present, the observed changes are small. These experiments would indicate that the change in ordering of the dipoles is rather tiny. The fact that no changes are observed in the nematic phase would suggest that the observed effect in the smectic phase could be attributed to a change in molecular ordering due to isomerisation of the molecules. However, due to small relative change, this interpretation should be taken with caution.
Figure 8. (Colour online) Changes in the dielectric permittivity at upon switching on the UV illumination for sample B at different temperatures.
4. Conclusions
We investigated optical switching of two bent-core liquid crystals with azocinnamoyl units in side arms and observed changes in optical and dielectric properties upon illumination with UV light. The illumination causes trans-cis molecular isomerisation, which is most prominently observed in the smectic C phase as a change in light transmission when observed with polarising microscopy. The average sample transmission between crossed polarisers changes for up to upon illumination, with local changes reaching values as high as
. The isomerisation effects, however, are not detected in the nematic phase, and the effects are too small to cause any observable changes in the phase transition temperatures. The response in the smectic phase, which is the largest just below the transition and reduced upon cooling, and the absence of the response in the nematic phase, indicate that the illumination causes changes in the layer packing rather than a significant change in the average molecular dipole moment. We also measured the on/off switching dynamics upon UV illumination and found that the response time to UV illumination increases significantly upon cooling, with its value increasing from around
below the phase transition to over
deep in the smectic phase, whereas the relaxation time remains practically temperature independent. The relaxation upon switching off the illumination returns the sample to the initial state; however, a high-speed camera observations show a non-exponential dependence of the POM transmittance, indicating a fast, but more complex relaxation process. Nevertheless, these materials, which have tunable both cinnamoyl and azobenzene units and enable their functional combination, offer potential for further investigations and possible optical switching applications.
Disclosure statement
No potential conflict of interest was reported by the authors.
Additional information
Funding
References
- Ikeda T, Tsutsumi O. Optical switching and image storage by means of azobenzene liquid- crystal films. Science. 1995;268:1873–1875.
- Kato T, Uchida J, Ichikawa T, et al. Functional liquid crystals towards the next generation of materials. Angew Chem Int Ed. 2018;57:4355–4371.
- Gelebart AH, Jan Mulder D, Varga M, et al. Making waves in a photoactive polymer film. Nature. 2017;546:636–646.
- Jánossy I, Lloyd AD, Wherrett BS. Anomalous optical Freedericksz transition in an absorbing liquid crystal. Mol Cryst Liq Cryst. 1990;179:1–12.
- Jull EIL, Gleeson HF. All-optical responsive azo-doped liquid crystal laser protection filter. Opt Express. 2018;26:34179–34184.
- Talukder JR, Lee YH, Wu ST. Photo-responsive dye-doped liquid crystals for smart windows. Opt Express. 2019;27:4480–4487.
- Yu H, Ikeda T. Photocontrollable liquid-crystalline actuators. Adv Mater. 2011;23:2149–2180.
- Yu H. Recent advances in photoresponsive liquid-crystalline polymers containing azobenzene chromophores. J Mater Chem C. 2014;2:3047–3054.
- Chigrinov V, Kwok HS, Takada H, et al. Photo-aligning by azo-dyes: physics and applications. Liq Cryst Today. 2005;14:1–15.
- Lansac Y, Glaser MA, Clark NA, et al. Photocontrolled nanophase segregation in a liquid- crystal solvent. Nature. 1999;398:54–57.
- Kosa T, Sukhomlinova L, Su L, et al. Light-induced liquid crystallinity. Nature. 2012;485:347–349.
- Alaasar M, Poppe S, Tschierske C. Photoresponsive halogen bonded polycatenar liquid crystals. J Mol Liq. 2019;277:233–240.
- Begum N, Kaur S, Xiang Y, et al. Photoswitchable bent-core nematic liquid crystals with methylated azobenzene wing exhibiting optic-field-enhanced Fréedericksz transition effect. J Phys Chem C. 2020;124:874–885.
- Chen H, Yang H, Kuo H, et al. Photo-switching behaviour in liquid crystalline materials incorporating a non-planar dithienylcyclopentene core and their birefringence properties. Liq Cryst. 2022;49:1475–1487.
- Nishikawa H, Sano K, Araoka F. Anisotropic fluid with phototunable dielectric permittivity. Nat Commun. 2022;13:1142.
- Hrozhyk U, Serak S, Tabiryan N, et al. Wide temperature range azobenzene nematic and smectic LC materials. Mol Cryst Liq Cryst. 2006;454:235/[637]–245/[647].
- Zhao Y. New photoactive polymer and liquid-crystal materials. Pure Appl Chem. 2004;76:1499–1508.
- van Oosten CL, Bastiaansen CWM, Broer DJ. Printed artificial cilia from liquid-crystal network actuators modularly driven by light. Nat Mater. 2009;8:677–682.
- Liu R, Zhang X, Xia F, et al. Azobenzene-based photoswitchable catalysts: state of the art and perspectives. J Catal. 2022;409:33–40.
- Etxebarria J, Ros MB. Bent-core liquid crystals in the route to functional materials. J Mater Chem. 2008;18:2919–2926.
- Alaasar M. Azobenzene-containing bent-core liquid crystals: an overview. Liq Cryst. 2016;43:2208–2243.
- Simić KG, Rybak P, Pociecha D, et al. Introducing the azocinnamic acid scaffold into bent-core liquid crystal design: a structure–property relationship study. J Mol Liq. 2022;366:120182.
- Šmahel M, Poryvai A, Xiang Y, et al. Photosensitive bent-core nematic liquid crystals with various linking units in the side arms: structure-properties relationships. J Mol Liq. 2020;306:112743.
- Kihara H, Tamaoki N. In situ photochemical conversion from cinnamoyl-functionalized liquid-crystalline monomers to liquid-crystalline dimers. Liq Cryst. 2007;34:1337–1347.
- Bubnov A, Cigl M, Sedláčková N, et al. Self-assembling behaviour of new functional photosensitive cinnamoyl-based reactive mesogens. Liq Cryst. 2020;47:2276–2291.
- Jákli A, Prasad V, Rao DSS, et al. Light-induced changes of optical and electrical properties in bent-core azo compounds. Phys Rev E. 2005;71:021709.
- García-Amorós J, Velasco D. Recent advances towards azobenzene-based light-driven real- time information-transmitting materials. Beilstein J Org Chem. 2012;8:1003–1017.
- Liu XM, Jin XY, Zhang ZX, et al. Theoretical study on the reaction mechanism of the thermal cis-trans isomerization of fluorine-substituted azobenzene derivatives. RSC Adv. 2018;8:11580–11588.