
 ?Mathematical formulae have been encoded as MathML and are displayed in this HTML version using MathJax in order to improve their display. Uncheck the box to turn MathJax off. This feature requires Javascript. Click on a formula to zoom.
ABSTRACT
Using high-resolution microscope observations, we show that both the static cubic (BPI) and the dynamic amorphous (BPIII) blue phases consist of fractional skyrmion filaments that transform into the same quasi two-dimensional structure of ‘baby’ half-skyrmions upon confinement to ultra-thin layers. We confirm this using numerical simulations of BPIII skyrmion structures in confinement combined with optical simulations, which reproduce experimental images, shown to originate at the glass-sample boundaries. Chiral nature of skyrmion filaments is demonstrated through experimental observations and optical simulations using circularly polarised light of opposite handedness producing images that vary strongly in comparative optical contrast. Direct observations and light scattering measurements of BPIII dynamics in bulk reveal that it is a highly dynamic phase, distinguished by two well-separated dynamic regimes, the slower of which can be observed even with a naked eye. We show that the slow dynamics corresponds to the thermally driven collective reshaping of the amorphous structure, while the fast mode is due to the director fluctuations within the filaments. Chirality of the relaxation modes in the bulk isotropic phase is also demonstrated and discussed. We show the dynamics in thinnest layers still show a two phase behaviour, with overall dynamics of half-skyrmions dramatically slowed down.
GRAPHICAL ABSTRACT
1. Introduction
Blue phases (BPs) are arguably one of the most intriguing phases in chiral liquid crystals. Although they have been observed already 140 years ago, understanding of their structure came about only about 30 years ago [Citation1]. BPs are spontaneously formed in some highly chiral nematic liquid crystals in which the high molecular chirality tends to induce a (pure) twist of molecular orientation in all directions (i.e. radial twist) [Citation2]. Because this is not possible on a larger spatial scale, topological defects are spontaneously formed in BP structures to compensate for the orientational frustration. Tendency for a radial twistFootnote1 is therefore fulfilled locally by the emergence of chiral objects that were predicted and termed double-twist cylinders (DTCs) by Saupe back in 1969 [Citation3]. In each DTC, the director is oriented along the DTC axis and rotates for
45° as we move radially out towards its edge, as shown in . According to the prevailing understanding of BPI and BPII structures, the double twist cylinders are arranged in a body-centred and simple cubic lattices, respectively, as shown in . In a portion of points where double-twist cylinders meet, defect lines or disclinations are formed, with a cross-section of a
nematic defect line (see bottom insert of ).
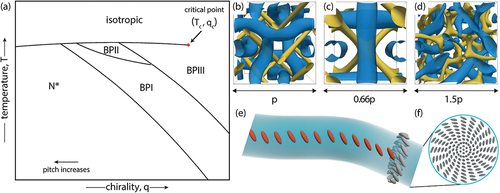
Figure 1. (Colour online) Phase diagram and structure of the blue phases. (a) Temperature – chirality (inverse pitch) phase diagram of chiral nematic exhibiting a critical point . (b)–(d) Numerically calculated structures of BPI, BPII and BPIII, respectively. The blue tubes represent the regions of double-twist cylinders while yellow tubes are the
disclination lines that intertwine them. Note that blue tubes visualise the iso-surface of the DTC. The double-arrows below each panel show an approximate size of the shown structures in units of chiral pitch
. (e) an illustration of a double-twist cylinder, a building block of the blue phases, with a shown cross section. Such a cylinder is equivalent to a quarter-skyrmion. (f) a skyrmion-like cross section of a double-twist cylinder.
Existence of the third blue phase, BPIII, also called the grey phase [Citation4], fog [Citation5] or the blue fog [Citation6] was first reported by Bergmann [Citation4] in 1978 and was a few years later described in some detail by Marcus [Citation5]. Unlike cubic BPs, where internal structure was hinted at by narrow, crystal-like reflectance spectra [Citation7], growth of crystallites from the isotropic phase [Citation8], Kossel diagrams [Citation9,Citation10] and later confocal [Citation11] and SEM images of polymerised samples, the structure of BPIII remained elusive. It appears as a featureless, isotropic liquid, which reflects faint blue light, the spectrum of which is much wider than that of cubic BPs. It has been identified as a true, stable, thermodynamic phase for a wide variety of liquid crystals using optical [Citation12–14], calorimetric [Citation15–17] and light scattering [Citation12,Citation17–19] measurements.
Following Ref [Citation20], who measured such diagrams in different chiral-racemic mixtures, we show in a generic temperature-chirality phase diagram of the chiral nematic and blue phases. Most notably we see that BPIII is observed in liquid crystals with high chirality , where
is the usual cholesteric pitch. This is one of the reasons, why BPIII is rarely observed. Another interesting feature of the phase diagram is a critical point at
, where the phase transition line from isotropic to chiral nematic phases ends. This critical point is similar to the critical point in water-vapour pressure-temperature phase diagram, meaning that the blue phases can be reached continuously from the isotropic phase by just choosing a path that bypasses this critical point. This means that the transition between the isotropic phase and BPIII is continuous [Citation15,Citation21,Citation22] above the critical point, which was demonstrated in a number of optical and calorimetric measurements.
Several theoretical approaches were developed to explain the observed BPIII properties. For example, the BPIII was viewed as an icosahedral quasicrystalline phase [Citation23–25] or a phase with bond-orientational order [Citation26]. Due to its relatively large optical rotation, it was speculated that the BPIII could be an amorphous state, formed by randomly oriented microscopic BPII domains [Citation27]. Hornreich et al. [Citation28] conjectured that BPIII could be an amorphous melt of soliton-like objects, which crystalises into an ordered BPI structure of the same soliton-like building units. Similarly it was proposed by Marcus [Citation5] that BPIII is an amorphous melt of DTCs. In agreement with the latter two predictions, recent mesoscopic numerical simulations of the BP structures [Citation29,Citation30] predict the amorphous structure of the disclination lines enmeshed with DTCs. While its properties have been studied in considerable detail, direct experimental observations of BPIII structure on the microscopic level are still scarce, performed mainly on the frozen [Citation31] or polymerised [Citation32] structures using electron microscopy.
Skyrmions were originally proposed to describe the stability of a nucleon as topological solitons of a pion field [Citation33] by Tony Skyrme in 1962. In later years, it has been realised that these vortex-like field configurations could exist in other continuous field systems as well [Citation34]. Skyrmions have been observed as 2D spin textures of a quantum Hall effect [Citation35], as coreless vortex formations in spinor Bose–Einstein condensates [Citation36] and as configurations of the velocity field in a superfluid phase [Citation37]. Skyrmions in solid state materials are most prominent in chiral magnetic systems [Citation38–40], where the often called ‘baby’ – skyrmions are tube-like localised swirls of magnetisation vector stabilised by the Dzyaloshinskii–Moriya interaction (DMI) between the magnetic spins [Citation41,Citation42]. Magnetic skyrmions are interesting for application in memory devices thanks to their fast responsiveness to external electrical current, small size and compactness and most importantly their energetic stability [Citation43]. The latter is a consequence of topology of their structure, which cannot be disentangled into a homogeneous structure by any smooth transformation. A skyrmion can only be disentangled by applying an energetically costly discontinuity of the magnetisation field. In this sense, it is often said that skyrmions are topologically protected structures [Citation44].
The continuous field of chiral nematic liquid crystals (CLCs), described by the average molecular orientation director field , has also shown the ability to spontaneously form various chiral solitonic structures [Citation45–47]. A free energy term analogous to the DMI term in magnetic systems in chiral nematics is written as
and it corresponds to the director twist term in the expression for the elastic free energy of the chiral nematic. In real nematic systems, the chiral interaction between the molecules causes the field to spontaneously twist and form various forms of skyrmions such as stable and isolated skyrmions [Citation48], skyrmionic bags [Citation49] or schools of skyrmions [Citation50]. In addition to skyrmions, CLCs have been shown able to host other solitonic structures such as torons, hopfions and heliknotons [Citation51].
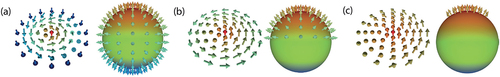
To describe their topological properties, skyrmions are often assigned a topological charge or a skyrmion number , defined as
where is the continuous vector field that is hosting the skyrmion and the integrals runs over a surface of the skyrmion [Citation44]. This expression counts the number of times the field vector of the deformation wraps around a unit sphere on which it is mapped, or conversely the angle for which the field twists with respect to its direction in the centre. This is shown in for three different cases. shows a structure of a magnetic skyrmion with
, where the radial twist angle is equal to
. Because
, such configuration is named a full-skyrmion. The right-hand panel in shows a mapping of the vector field on a sphere, which shows that the sphere is covered exactly once by all the spins of the full-skyrmion structure. In , this is generalised to half- and quarter-skyrmion with fractional charges of
and
, which correspond to radial twists of
and
, respectively. In contrast to full-skyrmions, these fractional magnetic skyrmions (also called merons) cannot be embedded into any homogeneous background field smoothly and as such are not stable by themselves. They can only be stabilised by other, oppositely charged merons [Citation52,Citation53].
Figure 2. (Colour online) Full and fractional (‘baby’) skyrmions. (a) Polar vector field configuration of a full-skyrmion, with a radial twist equal to and skyrmion number
. (b, c) Structures of half-skyrmion and quarter-skyrmion with
and
radial twist and
and
, respectively. In all cases, the vector mapping of the skyrmion vector field on a unit sphere is shown on the right.
In the case of polar fields, such as magnetisation, inversion of the vector sign will cause the inversion of sign of the skyrmion number
. In the case of the non-polar vector field, such as that of nematic director
, the vectorisation of that field must be performed before calculation or mapping on the unit sphere, yielding in the end equivalent consideration of both polar and non-polar skyrmions. In nematic case both
and
skyrmions correspond to the same structure [Citation51].
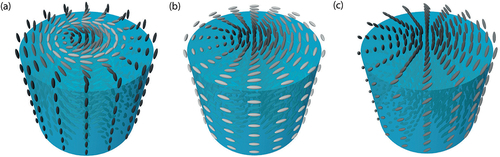
While 2D skyrmions can be realised by confining BP LCs to very thin layers, 3D skyrmions can take a form of skyrmion tubes in CLCs. In fact, it has been shown in 2017 by Nych et al. [Citation54,Citation55] that the 3D body-centred cubic array of quarter-skyrmions, forming the BPI, transforms into a quasi-2D hexagonal lattice of half-skyrmions such as the one shown in , when confined to very thin layers. It is then clear that the double-twist cylinder shown in , is in fact equivalent to a quarter-skyrmion tube, shown in . In both 3D cubic BPs and quasi-2D hexagonal lattice structures, the quarter- and half skyrmions are accompanied by disclinations with a profile of a defect in the cross-section. On the other hand, the full-skyrmion tubes may be embedded without defects in a homogeneous background [Citation56].
Figure 3. (Colour online) Schematic drawings of skyrmion tubes in CLCs. Full (a), half-(b) and quarter-skyrmion (c) tubes (filaments) found in CLCs. The quarter-skyrmion filament (c) is equivalent of a double-twist cylinder discussed in BP models and presented in .
In this work, we use different experimental techniques combined with numerical modelling of the structures and optical simulations, to show that BPIII is a highly dynamic 3D liquid phase of quarter-skyrmions entangled with a 3D network of singular topological defect lines, as shown in . In Section 2, we present the most relevant details of the experimental and numerical methods used in this work and we offer an overview and discuss the obtained results on the structure and dynamics of the observed skyrmion phases in Section 3. In conclusion, we provide an overview and future perspectives of this work.
2. Materials and methods
Here, we list only the most relevant experimental details regarding this work and refer an interested reader to our previously published work [Citation57], where more experimental details are provided.
The BPIII material used in the experiments was a 1:1 wt% mixture of a bent-core nematic 5-3CF3-2 M-5 [Citation58] and the right-handed chiral dopant CB15 ((S)-4-(2-Methylbutyl)- 4’-cyanobiphenyl, Merck KGaA). The addition of the chiral dopant determines the pitch of the structure and lowers the transition temperature of BPs, which in this mixture existed at temperatures C. The cholesteric pitch roughly matches the lattice constant of the BPI phase, where it was determined using Cano wedge method to be
nm.
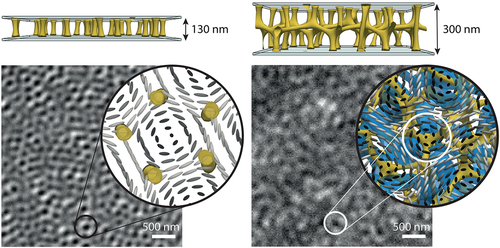
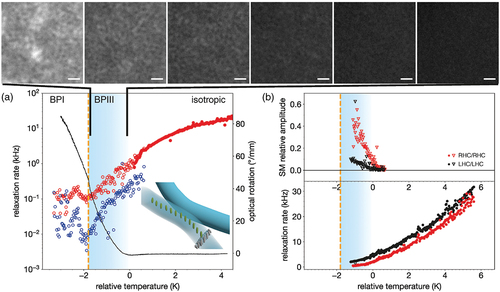
shows a low magnification image of this BP LC, taken in an upright microscope, operated in reflection mode under crossed polarisers. The BP LC was filled inside a 50 thick rectangular capillary that was used for measuring reflection spectra of bulk BP () and Dynamic Light Scattering (DLS) measurements. In this case, the capillary was placed on the heater so that a few K temperature gradient formed across the whole length of the capillary and all the phases of this BP LC could be seen at once.
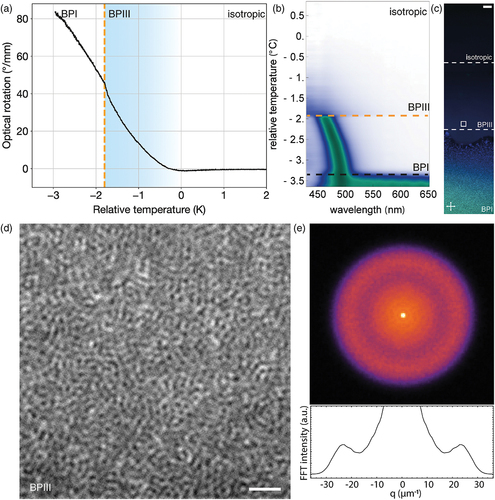
Figure 4. (Colour online) Properties and microscopic appearance of bulk BPIII. (a) Optical rotation as a function of temperature shows a continuous transition to BPIII and a first order transition to BPI. Zero temperature was determined at the onset of optical rotation and was cross calibrated with DLS measurements using 5CB (see ). (b) Reflective spectrum of the sample upon cooling. The spectrum in the amorphous BPIII is wide in the blue part of the visible spectrum shifting to longer wavelengths with reducing temperature. In BPI the spectrum is crystal like, with a sharp peak close to 470 nm. It shifts to
nm upon cooling. Zero temperature was determined at the onset of reflected light intensity on the spectrum. (c) Reflection image of the sample positioned in a temperature gradient cell with temperature ranging from
27°C on the bottom to
30°C on the top, showing three different phases in our sample. Scale bar indicates 10
. (d) Higher resolution microscopic image of BPIII, close to the transition to BPI. Image shows that locally BPIII structure appears similar to half-skyrmion lattices observed in thin layers of BPI; however, it is positionally disordered and dynamic. Scale bar corresponds to 1
. (e) FFT spectrum of an image, averaged over a number of images of the dynamic BPIII showing a ring-like structure. The radius of the ring at
25
corresponds to the typical distance over which intensity is modulated, that is, the distance between the dark spots,
250 nm. Bottom insert shows radially averaged plot of the FFT.
To measure the thickness-temperature phase diagram, the cells of very low thicknesses in the range of 30–500 nm were prepared by compressing a very small droplet (
) of this mixture between two 150
thick glass plates. This resulted in an uneven thickness of the BP LC, ranging from some tens of nanometres in thinnest places to several hundreds of nanometres in thickest places. Local thickness was determined in several places of the sample, distributed along a line in the regions of interest. Local thickness of the sample was determined after the sample was filled and mounted on the microscope through measurements of reflection spectra of a broadband light source (tungsten bulb). This was usually done immediately before or after a particular measurement was performed, as (slight) thickness changes were known to happen over times of several hours. The local interference spectra were then fitted by a numerical thin layer interference model with sample thickness as a variable parameter. In this way, local thickness could be determined with an accuracy of
nm. Temperature of the sample was controlled using a custom designed heater for operation in reflection mode microscopy and the temperature of the sample was stable within 5 mK.
For high magnification images, the samples were observed using an inverted optical microscope (Nikon Ti-U) equipped with oil immersion objective with high numerical aperture objective (CFI Plan Apo Lambda 100 Oil, NA 1.45). The microscope was operated in reflection mode so the objective acted as both condenser and objective. When the sample was illuminated using a narrow-spectra 450 nm or a 530 nm light source (CoolLed pE-300), the microscope reached theoretically predicted diffraction limit and the resolution of this optical microscope was
130 nm [Citation59].
Optical rotation power (ORP) measurements are standard in chiral materials and have been commonly used in BPIII systems as well [Citation12,Citation27]. The ORP was measured using a standard combination of photoelastic modulator and lock-in amplifiers, described in detail in [Citation60]. The angle of rotation of polarisation for a linearly polarised 632.8 nm HeNe laser beam was measured after it travelled through 140 thick cell filled with our sample at different temperatures.
Dynamic light scattering (DLS) is a well-recognised method for measuring dynamical properties of a variety of systems [Citation61] with many studies performed on bulk BP systems as well [Citation12,Citation19,Citation62,Citation63]. It is an ensemble averaging method, yielding information about system dynamics on scales spanning several orders of magnitude of time. The length scale on which the dynamics is probed (i.e. the DLS wave vector, or the wave vector of the fluctuation) is determined by laser wavelength used (in our case 632.8 nm He-Ne laser) and experimental geometry.
Dynamics in thinner layers of BP was measured using a variant of differential dynamic microscopy (DDM) [Citation64] called the cross-DDM (cDDM) [Citation65]. DDM is a DLS equivalent method that can be performed using an optical microscope simply by taking fast frame rate movie frames of the samples using a single camera. The frames are then processed in the Fourier domain by calculating image differences at different time delays, which yields time correlation functions , where connection between the DDM wave vector
and the true scattering wave vector
can be made [Citation64]. Cross-DDM method [Citation65,Citation66] uses two aligned cameras, taking frames of identical field of view of the sample. Such configuration allows shortening the delay between two frames to values much below what is achievable using a single camera, that is limited by its frame rate. Our cDDM experiments were performed using the reflection microscope setup described above. The samples were illuminated with green, 530 nm LED, and we avoided exposing BP samples to light of shorter wavelengths. Even with blue LED illumination, the sample degradation could clearly be seen by constant lowering of the clearing point under long term illumination. Typical correlation times probed using cDDM are
ms and up to
s. The scattering wave vector projection amplitudes that can (theoretically) be probed using DDM in general are determined by the objective numerical aperture and light wavelength were in our case
.
Numerical modelling of the skyrmionic structures was done using a continuum Landau-de Gennes free energy approach based on the full order parameter tensor [Citation67,Citation68] with the free energy expansion in the dimensionless form consisting of 3 main contributions: (i) The condensation free energy term, (ii) Elastic free energy contribution in a single elastic constant approximation including the chiral term, and (iii) The surface free energy term. We used typical material parameters of a chiral nematic [Citation57]. To obtain different structures of BPs in bulk, different initial conditions were used, as explained in more detail in Ref [Citation57].
The disclination lines of BP structures were visualised as isosurfaces of the scalar order parameter
and are coloured in yellow throughout this work. The isosurfaces representing the skyrmion filaments, shown in numerical figures in blue colour, were identified from the
tensor field by introducing a visualisation parameter, related to an effective calculation of the electric potential (see [Citation57] and [Citation69]), which has a minimum in the centre of skyrmion filaments. The skyrmion detection algorithm worked correctly in cases of the cubic BPs (see ) so it was used in BPIII as well.
The calculated skyrmion structures were also visualised by calculating their appearance under an optical microscope and visually compared to taken images of the skyrmion structures. To this aim, simulations of light reflection through and from the LdG calculated tensor fields of the skyrmion structures were performed using the diffractive-transfer matrix method (DTMM) [Citation70]. The accuracy of this method was tested by comparing to real space images calculated by slower, but more accurate finite-difference time domain method (FDTD) [Citation71,Citation72], which directly solves the Maxwell equations. Both methods provided good qualitative (visual) match between themselves. The light propagation simulations were performed in the context of a virtual (reflection) microscope, which included the details of the actual Koehler illumination and light collection using a finite set of plane waves propagating and collected inside a cone whose opening angle is defined by the objective (condenser) aperture. Details and parameters of these simulations may be found in [Citation57].
3. Results and discussion
3.1. Properties and structure of bulk BPIII
To characterise basic properties of the prepared BPIII sample, we performed a series of experiments with the sample confined in thick BPIII (
). To determine the temperature of the phase transitions in the sample, the optical rotatory power measurements proved to be most convenient. The measured temperature dependence of the ORP in our BPIII mixture is shown in . The isotropic – BPIII transition was determined by a slight dip in the optical rotation, just before it starts continuously increasing in the BPIII phase. The zero of the relative temperature scale was set to this point. At
K the temperature dependence of the ORP changes the slope, and this point is identified as the discontinuous transition to the lower temperature BPI phase. This ORP measurement indicates that our BPIII mixture is close to the critical point in the temperature-chirality phase diagram shown in [Citation14,Citation17,Citation19,Citation21]. A similar feature is seen in the reflection spectra shown in , and in the low magnification image of the structure in in which a sharp boundary is observed at the BPIII-BPI transition but no such boundary is seen at the BPIII-isotropic transition. The absence of the boundary between the two phases is an evidence of a continuous transition between these two phases.
The low magnification image, which is shown in , was taken in reflection from the 50 thick BPIII sample placed in a temperature gradient between
C at its top and
C at its bottom. We see a stark contrast between the appearance of BPI and BPIII: BPI shows a distinguished crystalline platelet structure with reflection colour of the platelets from dark blue and black (reflection in UV) at the high temperature end towards the darker green colour tones at the low temperature end. This behaviour is clearly observed also in the temperature dependence of the peak of reflection spectra in BPI, shown in . By cooling the BPI phase, this reflection peak shifts from
nm to
nm, which is a consequence of the increase of the pitch with lowering the temperature. On the other hand, BPIII appears as a deep blue featureless fog with a significantly broader reflection spectra, located at the blue end of the measured spectral range, presumably extending into the UV region as well. When image of a bulk BPIII is taken using diffraction limited optical microscope, one can see randomly distributed black (non-reflecting) dots, as shown in . If a video of bulk BPIII is taken, one can clearly see that these dark spots are fluctuating in intensity, disappearing and reappearing, therefore reallocating at a time scale of seconds. It is important to note that these black dots are not just noise, they represent true objects, as we shall see in the continuation. We should also note that the reflection spectra, appearance and other optical properties of BPIII are already well documented, however none of the studies we are aware of has reported on direct high resolution observations of this amorphous structure of randomly distributed and fluctuating black dots on a micrometre scale.
It is relevant to discuss at this point the origin of contrast in our high resolution optical microscopy images. In reflection mode microscopy, the contrast in the sample image stems from variation of the local reflectivity of the observed sample. In real samples, there might be a number of other undesirable reflections, which can be superposed to sample reflectivity. For example, an LC sample is usually confined between two glass plates. In reflection microscopy, illuminating light will then be reflected not only from the sample itself, but also from the front and back interfaces of glass with air. These reflections will add up and obscure the image of the sample. For this reason, it is very important to index match different optical elements, which can contribute sparse reflections and reduce the quality of the sample image. This can be avoided by careful index-matching the objective lens and the sample glass surface, while at the exit glass a black absorber is placed to prevent any reflection.
After care is taken and sparse reflections are minimised, only a few % of the incoming light will be reflected from the LC sample. However, the reflection from the glass-LC interface depends on the local value of the refractive index of the LC, or in another words, on the molecular orientation in the vicinity of glass-LC interface. If the LC is oriented differently at the interface, there will be different local reflectivity at different places at the interface. This contrast in reflectivity is therefore the highest when the focal plane of the microscope matches the LC-glass interface. Let us consider light reflection from the interface of a birefringent LC sample, with and
and optically isotropic glass with
, and we take prevalently in-plane, linearly polarised illumination light. The refractive index mismatch at the interface changes from
in places where the director lies in plane of the sample to
in places, where the director is perpendicular to the interface. In the latter case, where LC molecules are perpendicular to the glass interface, the reflectivity of light is very small and these places will appear dark. For this reason, the centres of the half-skyrmions in thin layers of BPI appear as dark dots with a brighter rim, as reported in [Citation54].
The amorphously distributed black dots of BPIII, shown in , were immediately reminiscent of the half-skyrmions observed in thin layers of BPI [Citation54]. However, there is one important distinction: BPIII structure appears highly dynamic, while the hexagonal skyrmion lattice in thin layers of BPI appears quite static. It can be seen in Supplementary Video 1, showing a nm thin layer of BPIII at a temperature close to BPI transition that the black dots are highly dynamic objects. They are forming, disappearing and reshaping on a timescale that is observable with a naked eye and easily captured by a microscope camera. Results regarding the intriguing dynamics of BPIII structure are presented in Section 3.3.
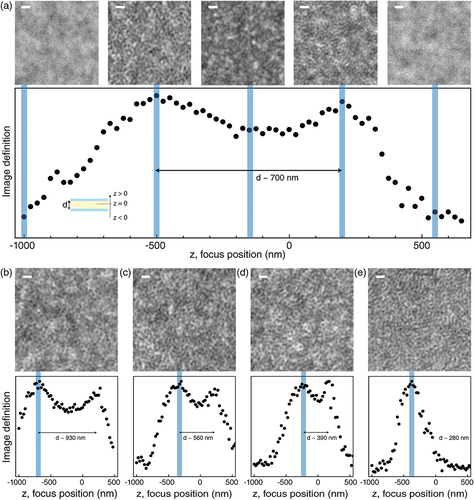
At higher temperatures the BPIII dynamics becomes somewhat faster, which partly obscures the interpretation of the structure from the microscopic images that are taken at rather finite exposure time. However, close to the transition to BPI, the dynamics becomes slow enough for the structure to be recognisable. At these temperatures we searched for further clues about the BPIII structure. Using high NA objective the focus was scanned through the sample in steps of nm and an image was taken at each step. We noticed something very peculiar when the thickness of the sample was around
: during the focus scan, the structure appeared in focus two times. When the focal plane was located below the sample, the image appeared blurry, and became sharper as we moved upwards. At a certain focal position, the structure of the black dots was in sharp focus. Moving beyond that point did not cause the image to go completely out of focus, but the black dots did not appear sharp any more. By further moving the focus upwards, the sharp image of black dots reappeared again. Such a scan is shown in for sample thickness of
nm. The graph below the series of images shows Image definition as a function of the focus position
moving from planes below the sample. Image definition is a parameter that we used as a measure of black dots sharpness. It is defined as the number of black dots with specific size and relative darkness appearing on a particular image recognised using a particle tracking software TrackPy [Citation73]. Depending on the sample focus, the algorithm identified more or fewer black dots (particles). The number of detected black dots gets maximal, when the dots are in focus. On the graph in , we see two distinct peaks, corresponding to the images in which black dots appear to be in sharp focus. As the sample thickness was reduced, the peaks shifted towards each other, with the distance between them roughly matching the measured sample thickness at that position – see . At the thickness
nm, only one peak could be resolved (see ) and the sample appeared in focus at only one
position. This thickness roughly matches with the estimate for the depth of field value for our microscopy parameters:
nm. Results presented in indicate that the structure images originate at the two glass-sample interfaces. Observation of the second peak at higher
values for larger thicknesses is possible due to the amorphous structure of BPIII and transparency of the sample.
Figure 5. (Colour online) Origin of contrast in BPIII microscopy images. (a) Focus scan of the amorphous BPIII; top row shows images taken at different positions marked by blue colored bands on the lower graph, which shows Image definition dependence on the focus position. Two peaks are observed, corresponding to the two sample-glass interfaces where image contrast is increased. (b)–(e) Image definition dependencies on focus position at different thicknesses with microscopy image shown at the first peak at a point marked with the blue band. Only a single peak could be observed once the sample thickness was below the depth of field determined by the numerical aperture of the objective. Scale bars in images corresponds to 500 nm.
If BPIII is really a disordered melt of quarter-skyrmions, the black dots in the BPIII structure may be the quarter-skyrmions themselves connecting to the glass surface under different angles. We therefore want to fully explain the observed structure of BPIII using Landau-de Gennes numerical simulations of the bulk structure. Similar to previous works by Henrich et al. [Citation29,Citation30] the unbounded stable BPIII structure appeared after numerical relaxation as an intertwined structure of regions with reduced scalar order parameter – disclinations - and elongated double-twisted regions – skyrmion filaments – shown in the left panel of . The disclinations, shown in yellow, form an irregular mesh with all observed disclination junctions appearing 4-ended, similarly as in BPII. Each disclination has a cross-section of a defect director profile shown in the insert of . The skyrmion filaments appear as elongated cylinders, free of singularities and junctions meandering through the disclination mesh, sometimes terminating at a disclination but mostly at the surfaces. The cross-section of a typical skyrmion filament is shown in the top insert of .
Figure 6. (Colour online) Numerically calculated bulk BPIII structure. The BPIII structure appears as an amorphous mesh of disclination lines with defect cross-section (shown in the bottom insert) and skyrmion filaments with quarter-skyrmion profile shown in the upper circular insert. On the right the director profiles are shown in the plane marked by the two corresponding dark planes on the left figure viewed along the arrow directions.
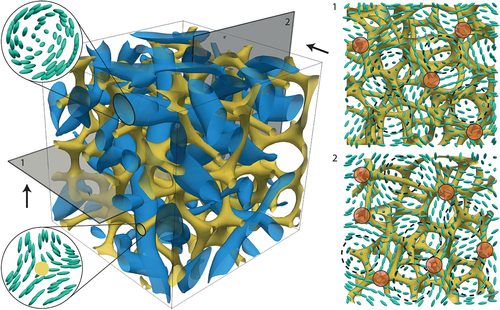
If we take any cross-section of the numerically calculated BPIII phase shown in , we can observe skyrmion director profiles formed in different parts of the plane. This is shown in the right panel of , where two perpendicular cross-sections (denoted 1 and 2) are shown. Such profiles appear in regions free of disclinations, but they are not necessarily part of a single quarter-skyrmion filament. When the structure is viewed along the corresponding plane normals (see arrows in ), there are inevitably randomly positioned skyrmion profiles formed. If we consider a glass-BPIII interface as a plane that is cutting through a BPIII sample, skyrmion centres will appear as dark spots in the reflection microscopy image. Positions of these skyrmionic profiles will become more apparent later, when we will deal with a confined BPIII.
Skyrmions are normally understood as topologically stable field configurations that can exist as isolated objects, which are embedded in the homogeneous surrounding field. The reason behind their energetic stability is their complex (director, magnetisation) structure, which, in turn, causes their topological protection, when embedded in the homogeneous background field. However, single fractional skyrmions that we observe and discuss in this work, cannot be embedded in the background field smoothly, but cause a frustration in the field, resulting in creation of topological defect lines. In this sense the skyrmion filaments of blue phases are stabilised by the disclinations, and in bulk the ensembles of these skyrmion filaments are collectively stabilised by a network of disclinations. This opens a question of topological charge counting and compensation in such systems so dissimilar to those in which the charges are simply counted and compensated in pairs [Citation74].
3.2. Skyrmion phases in thin layers
Following the ideas of Nych et al. [Citation54] and Fukuda et al. [Citation55], we became interested in what structures would form in thin layers of BPIII liquid crystal. To study this systematically, we decided to explore a temperature-thickness phase diagram and identify different structures and phases that can be observed. For this, we prepared wedge type cells using bare glass plates with planar degenerate anchoring as described in Section 2.
The resulting phase diagram is shown in . In it, each black cross represents a high resolution reflection microscopy image taken at that particular thickness and temperature. In the presented thickness-temperature range we were able to identify four different phases composed of skyrmion filaments and the cholesteric phase (). If we follow the vertical line marked with number 3 through the phase diagram, we start in the low temperature cholesteric phase coloured with bright red colour and cross-over the red line marking the first order phase transition into the BPI phase (), coloured green in the phase diagram. This is followed by another first order phase transition across the full blue line to the dynamic BPIII phase (), marked by the bright blue colour and positioned below the high temperature isotropic phase, shown in white. When the thickness is decreased in the BPI phase, the LC structure changes at a critical thickness of
nm, into a dense lattice of half-skyrmions, shown in . Skyrmions are observable as static black dots and the corresponding phase is coloured dark blue in the phase diagram. At the critical thickness, which is presented by a vertical broken line at
150 nm, there are two triple points: first at the coexistence point between BPI, BPIII and the dense half-skyrmion phase and the second at almost 4 K lower temperature, where the chiral nematic phase transits directly into the half-skyrmion phase. This triple point shows the relatively wide temperature stability range of half-skyrmion structures in this material below 150 nm thickness.
Figure 7. (Colour online) The temperature-thickness phase diagram and thin layer skyrmion structures of BPIII LC. In addition to the chiral nematic phase (E) four different skyrmion phases are observed: isolated half-skyrmions (a), dense half-skyrmions (b), which are quasi two-dimensional structures and the 3D structures blue phase I (d) and blue phase III (c) that form above the critical thickness ob nm. The arrow paths marked with 1, 2 and 3 denote approximate regions for which the results on dynamics in thin layers is presented below. Scale bars in the bottom row images represent 500 nm.
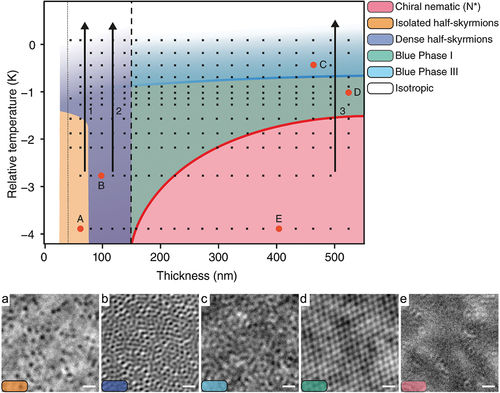
When dense half-skyrmions are confined further below the 150 nm critical thickness, the dense skyrmion phase is converted into diluted skyrmion phase below nm thickness. In this phase, half-skyrmions are isolated and embedded in a fully unwound chiral nematic surrounding, shown in . As will be discussed later (see ), each half-skyrmion, formed in the homogeneous background, or in a dense lattice, is surrounded by two
disclinations, which are not observed in experimental images of this material. However, from experiments on longer-pitch materials [Citation54], we know they indeed form but their size and distances to the half-skyrmion are in our case below the diffraction limit of
nm. Phase of isolated half-skyrmions is coloured orange in the diagram. At thicknesses below the dotted line in the phase diagram, only a unwound planar cholesteric phase is observed without other notable structures and due to very low thickness reflection can barely be observed. It is quite interesting that heating half-skyrmions below the critical thickness of 150 nm does not lead to any transition into a BPIII phase. Rather the half-skyrmions persists to the highest temperature, where they melt continuously into the isotropic phase. What does change at the transition over the dashed blue line, however, is their dynamics, as we show and discuss in Section 3.3.1. We have shown here, that both BPIII and BPI transition into the same phase of dense half-skyrmions upon their confinement. This is an important finding, as it affirms the assumption that both BPI and BPIII consist of same skyrmion constituents that are just arranged differently in these phases, but transform in the same manner when confined.
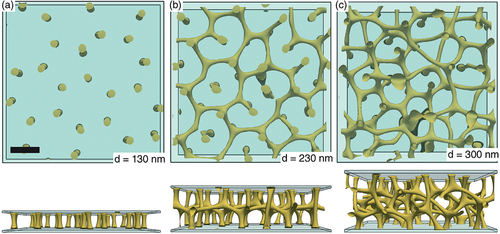
To corroborate the experimental observations in thin layers of BPIII LC, we performed additional numerical simulations, in which the BPIII phase, shown in , was confined to layer thickness that is comparable to experimental conditions. Parallel surface anchoring was considered in numerical simulations. shows the top and side views of disclinations forming at three different thicknesses, with glass plates added for clarity (not to scale). In the thinnest layers the disclinations appear as vertical connections that attach perpendicularly to the glass plates. Above the threshold thickness, which was determined to be around 180 nm in numerical simulations, in-plane connections between the disclinations begin to appear, forming 4-ended disclination junctions, with some disclinations still directly connecting the two glass plates. At increasing thickness, more junctions form and an amorphous mesh starts to appear very much like the one in .
Figure 8. (Colour online) Numerically calculated −1/2 disclination line structures in (a) 130 nm, (b) 230 nm and (c) 300 nm thick simulated cells of BPIII phase from the top (upper row) and side view (lower row). In the thinnest case (a) the disclinations connect vertically between the two plates without horizontal connections. Above the numerical critical thickness, determined around nm, horizontal connections start to form between the disclinations, forming 4 junctions with some disclinations still connecting the two plates directly. In the thickest case (c) the disclination mesh appears completely amorphous. Scale bar corresponds to 100 nm for 270 nm pitch.
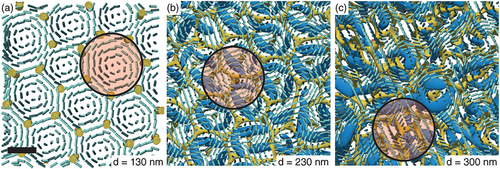
The numerical threshold thickness of 180 nm is in remarkable agreement with the experimental critical thickness of nm, below which half-skyrmions are observed in experiments. shows a top view of the numerically calculated structures for same thicknesses as in . The director profiles are shown in the plane near the glass boundary, which contribute most to the obtained optical image. For clarity, we omitted drawing the glass plates in this case. In , a lattice of half-skyrmion director profiles with each of them wedged between 5 and 7 disclination lines, can be observed. An example of a half-skyrmion profile is marked by a faint red circle. The half-skyrmions exist in ‘single layers’ and are quasi two dimensional in a sense that the director profile is mostly uniform in the out-of-plane direction. As the thickness increases, and the disclination mesh starts forming horizontal connections, quarter-skyrmion filaments can be detected (shown in blue), reaching the surfaces under oblique angles. In case of , a single layer of horizontal disclination connections is shown and we can see in that the half-skyrmion profiles, marked by faint-red circles, appear above and below the 4 junctions formed by these connections, where three quarter-skyrmions appear to intersect under an oblique angle. The same holds for thicker BPIII layers close to the surfaces, as shown in .
Figure 9. (Colour online) Same structures as in with director structure drawn in the plane near the top glass plate and detected quarter-skyrmions in thicker layers (b,c). In thinnest case (a) the structure is a lattice of half-skyrmions wedged between 5 and 7 vertical disclinations. (b, c) When horizontal disclination connections begin to form the half-skyrmions are replaced by quarter-skyrmion filaments lying obliquely to the surfaces. In all three cases, half-skyrmion director profiles are observed close to the surfaces, above the disclination junctions, with few examples marked with faint-red circles. Scale bar corresponds to 100 nm for 270 nm pitch.
To gain more details about the BPIII skyrmion structures, we performed comparative analysis of the fractional skyrmions that appear in different BP phases. It is clear from that in thin layers, the skyrmions appearing are half-skyrmions, with 90° radial twist but it is less so in thicker layers. From the full 3D director fields of the simulated structures and detected skyrmion filaments in thicker regions we were able to analyse the director twist angles inside recognised skyrmion filaments. We found that in the regions below the critical thickness, the skyrmion filaments are fractional skyrmions in which the distribution of measured director twists has a peak around 90° and the filaments can be considered as half-skyrmions. In thicker regions the peak of the radial twist distribution shifted towards lower values, peaking at
45° for the analysis of a simulation done at 230 nm thickness and
35° for the bulk BPIII structure. These results show that considering BPs as constituted of quarter-skyrmions may still be quite idealistic, because there is no single value of a DTC twist angle, but rather a distribution of radial twist angles. Much like the varying skyrmion diameter, the described twist angle distribution is a natural consequence of the soft nature of chiral nematics. More detailed results of this analysis are presented in our previous work [Citation57].
3.2.1. Optical simulations and chirality
To compare the numerically calculated structures in confined BPIII, we performed optical simulations using numerical methods described in Section 2. shows a comparison of three numerically simulated microscopic images (DTMM method) and experimental images of isolated half-skyrmions (a), dense half-skyrmions (b) and thin BPIII phase (c) taken at a comparable thicknesses with similar optical parameters (light source, NA, polarisation, etc.). The experimental images were low pass filtered in the Fourier domain to remove the high frequency pixel-to-pixel variations.
Figure 10. DTMM optical simulations of BPIII skyrmion structures compared with experimental images. Images represent from left to right a structure of isolated half-skyrmions (a), dense half-skyrmions (b) and dynamic BPIII phase (c). Note that all half-skyrmions in (a) and (b) are accompanied by the disclinations (see ) but their size and distance to the half-skyrmion are below the resolution limit of our system. Scale bar marked on (a) corresponds to 500 nm on all images.
It is important to note again, that in thinner layers the appearing objects are actually half-skyrmions, stabilised by the vertical disclinations and the surfaces, while in thicker layers, the base constituents are quarter-skyrmion filaments. The diameter of quarter-skyrmion filaments in BPIII, as calculated in simulations, varies due to the soft nature of LCs and the local environment conditions, but is approximately nm for the
nm chiral pitch. Such size is of course below the resolution limit of our optical microscope and it is reasonable to assume that individual quarter-skyrmions in BPIII cannot be observed. However, the arrangement of quarter-skyrmion filaments close to the glass-LC interface forms local half-skyrmion-like profiles (see . We have shown within the discussion of that the image optical contrast is the highest, when the microscope is focused close to glass-LC interface. This is in agreement with our optical simulations, which show that the black dots observed in experimental images of BPIII are indeed the skyrmion-like end-profiles of DTCs that are formed close to the interface. In the region of dense half-skyrmions, shown in , the simulated picture is diffraction-limited to the half-skyrmion diameter of
nm (depending on the observation wavelength), close the optical resolution of a diffraction limited microscope [Citation59].
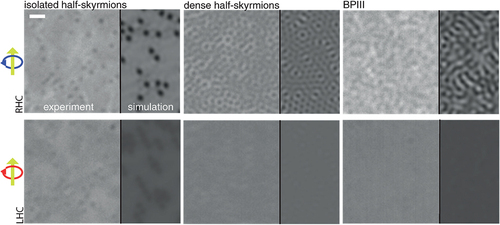
It is well known that the light propagating modes through chiral nematic are circularly polarised plane waves [Citation67]. In the experiments on BPIII LC, we found that appearance of the images in reflection strongly depends on the light polarisation, specifically on the handedness of circularly polarised light, with which the sample is illuminated. The chiral dopant in our material is right-handed CB15 and we have seen in all the skyrmion phases, but especially in BPIII, that RHC light polarisation,Footnote2 that matches the material handedness, produces higher contrast images compared to the opposite LHC light polarisation. This is demonstrated in , for three different skyrmion structures, observed in this sample. The top (or bottom) row images were taken by RHC (or LHC) polarised light, where the RHC (or LHC) polariser was positioned so, that both incoming and reflected light passed through it. This means that, for example, the sample was illuminated with RHC light and the reflected light passed again through the RHC polariser, which is labelled as the RHC/RHC setting. The same applies for LHC polarisation images. Each left sub-panel of shows the experimental image, while numerically calculated microscope image using DTMM method are shown on the right-hand side panel. For direct comparison, the experimental images were all taken using same light and camera settings and scaled to the same contrast range. We can see that in all three cases the RHC/RHC images exhibit a noticeably higher contrast compared to LHC/LHC configuration. Even in LHC/LHC images there is faint structure observed in the image of isolated half-skyrmions, where the sample is very thin and the unwound cholesteric structure with embedded half-skyrmions is slightly twisted in the direction. In the thicker BPIII case no contrast of the structure is observed. again affirms that the optical simulations of BPIII skyrmion structures and illuminating light helicities are in excellent agreement with the experiments.
Figure 11. (Colour online) Comparison of microscopic images taken with right- (top) and left-handed (bottom) circularly polarised light with simulated images. Three different structures are shown from left to right: isolated half-skyrmions at a low temperature and thickness nm, dense half-skyrmions at a low temperature and
nm and a snapshot of a dynamic BPIII phase at a thickness of
nm. Scale bar represents
nm for both experimental and numerical images. The blue and red circular arrows indicate the direction of light electric field
rotation with respect to the light travel direction (yellow arrow) in RHC and LHC case, respectively.
3.3. Dynamics of BPIII
To characterise the surprisingly slow and apparently turbulent dynamics observed in videos of BPIII structure (see Supplementary Video 1 showing the dynamics of BPIII), we first performed dynamic light scattering (DLS) measurements in bulk BPIII phase upon cooling the sample from the high temperature isotropic phase. In accordance with previous DLS measurements on chiral systems, including BPIII [Citation19], the incoming and detected light both passed through a circular polariser of same handedness, the so called RHC/RHC and LHC/LHC measurement configurations. Measurements were performed in backscattering geometry, at a relatively large wave vector q
. The temperature scale in DLS experiments is different from the temperature scale, obtained in ORP measurements, because of inevitable temperature gradients that are different for different setups. We therefore used the isotropic-nematic phase transition in 5CB as a reference temperature that helped us to put DLS and ORP measurements on the same temperature scale. Further details about our BPIII DLS experiments can be found in [Citation57].
Temperature dependence of the structural relaxation rates obtained by a DLS, performed in RHC/RHC configuration, is shown in . In the high temperature isotropic phase, a well-defined single relaxation mode is observed, shown with red filled circles. This fast mode corresponds to chiral order parameter fluctuations that are present in the isotropic phase [Citation75,Citation76]. As the temperature is reduced the mode slows down and at the transition to the BPIII phase, the measured DLS relaxation functions acquire an additional slower component. There are therefore two relaxation modes in bulk BPIII phase, both are shown in with red and blue empty circles, respectively. Both modes continue to slow down to the phase transition to the cubic BPI phase, in which they remain constant (see Supplementary Video 2 of the phase transition upon heating from BPI).
In the region of BPIII phase, the fast and slow mode relaxation rates are separated for nearly an order of magnitude, with the slow mode relaxation rates of Hz at the ISO-BPIII phase transition and
Hz close to the transition to BPI. In addition to decreasing relaxation rate of the slow mode, its amplitude gradually increases on cooling through the BPIII phase. These relaxation rates are comparable to apparent relaxation rates estimated from video microscopy. From the microscopic images taken at different temperatures in BPIII, shown at the top of , it is apparent that the structure contrast also increases upon cooling. Based on our understanding of the BPIII structure, we conclude that the slow mode corresponds to the rearrangements of BPIII structure, driven by thermal fluctuations. The fast mode in the BPIII phase corresponds to the always present director fluctuations of the structure, consisting of twist-like structural fluctuations in the quarter-skyrmion filaments themselves [Citation12,Citation19,Citation76]. By comparing the ORP and DLS measurements on BPIII, we see that the temperature, where the ORP starts increasing, matches the temperature at which the slow mode dynamics is observed. This confirms that the slow mode appears at the isotropic-BPIII transition, which is continuous. Both ORP and DLS measurements are shown in , and the range of BPIII phase in bulk is marked by a white-blue coloured gradient.
shows the relative amplitude of the slow mode close to the transition into BPIII phase in case of LHC/LHC and RHC/RHC measurement configurations (top) and the temperature dependence of the relaxation rates of the fast mode in both configurations upon cooling from the high temperature isotropic phase. At a given temperature, we observe faster relaxation in the LHC/LHC scattering configuration, compared to RHC/RHC scattering configuration. By considering that our BPIII LC is the right-handed material, we can explain this difference from previous works [Citation12,Citation19] on light scattering in highly chiral isotropic phase. The relation between the handedness of circular polarisations of incoming light, scattered light and the material handedness was explained through theoretical considerations [Citation77,Citation78]. Here, the fluctuating part of the order parameter tensor of a chiral LC is expanded in terms of five structural modes. The eigenmodes are designated by mode indices . The modes with
are spiral modes, the modes with
are conical spiral modes, and a nematic mode has an index of
[Citation12,Citation76]. Here, the sign of the mode index designates its helicity. Fluctuations of different modes contribute equally in the isotropic phase but are different in their relaxation rates, as well as the temperatures at which the mode rate becomes zero (i.e. the mode condensation temperature). However, their contribution to the light scattering signal depends strongly on the experimental geometry and light polarisation [Citation79,Citation80]. In the nearly backscattering geometry (
) of our DLS experiment, the main contributions to the signal are due to
and
modes, and by selecting either RHC/RHC, LHC/LHC or RHC/LHC combination, structural modes
,
and
, respectively, are probed [Citation80]. As we have already mentioned, another slower mode is observed in the correlation functions, once the sample transits into the BPIII phase. We see that the slow mode signal contribution is considerably stronger in the RHC/RHC case. We understand the slow mode in BPIII as a consequence of the rearrangement dynamics of the quarter-skyrmion filaments in BPIII, the higher relative amplitude in the RHC/RHC configuration compared to LHC/LHC is in accordance with .
Figure 12. (Colour online) Dynamic light scattering measurements in bulk BPIII. (a) Temperature dependency of the relaxation frequency as a function of temperature upon cooling from the isotropic phase. In BPIII phase, another slower mode appears (blue) and continues slowing down at a similar rate as the faster mode (red) until BPI is reached. Black curve is the optical rotation measurement on the same temperature scale, calibrated using the NI transition temperature of a 5CB sample. In the top row, snapshots of BPIII inside a cell at different temperatures in the BPIII phase marked schematically on the DLS graph. Images are scaled to same intensity range and the scale bars denote 500 nm. (b) Comparison of measurements using LHC and RHC light. Upper graph shown the relative amplitude of the slow mode, appearing in BPIII, for LHC/LHC (black) and RHC/RHC (red) configurations. The bottom temperature dependence shows the relaxation frequency of the fast mode in both polarisation configurations from the high temperature isotropic phase to the transition.
The measurements and discussion so far point at two considerably different phase transitions of the blue phases. The continuous condensation of the amorphous mesh of quarter-skyrmions is not a symmetry breaking phase transition, since, as was pointed out by Lubensky and Stark [Citation22], the spatially averaged alignment tensor is zero in both isotropic and BPIII phase. They suggested a different order parameter is needed to describe the phase transition. Global symmetry is broken at the first order transition to the crystalline BPI, at which both modes slow down and condense, as expected from the classical Landau mean-field theory.
3.3.1. Dynamics in thin layers
As we have seen in the phase diagram of , both BPIII and BPI transform into the same liquid of half-skyrmions upon confinement. DLS experiments have shown the difference in dynamic behaviour between the isotropic, BPIII and BPI phases in bulk, with the appearance of the slow mode as one of the key distinguishing factors between the isotropic phase and BPIII, which are of the same global symmetry but obviously of a different structure on the sub-micrometre scale. Thus, in experiments concerning phase dynamics on this system, the appearance of a slow mode is a clear signature of the presence of fluctuating skyrmions and as such should persist also in the thinnest layers, where only a single layer of these objects can exist.
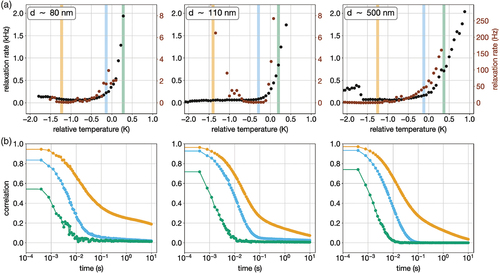
The cDDM measurements in thin skyrmion phases indeed reveal two relaxation mechanisms with different relaxation rates. Results of the cDDM measurements, taken at the wave vector projection around
, are shown in , where temperature dependencies of the fast (black markers, left axis) and slow (brown markers, right axis) relaxation rates are shown for three different thicknesses also marked on the
in . The results in the
nm thick layer, shown in , are similar to the results of the bulk DLS measurements, with appearance of two modes, with their relaxation rates an order of magnitude apart, that slow down with cooling temperature and essentially”freeze” at the transition to the BPI phase. In the two thinner cases shown in a similar slow down of the two modes was observed through the transitions however the slow mode was observed to be significantly slower compared to thicker layers. This is also apparent from the correlation functions measured at different thicknesses, examples of which are shown in the insets of at temperature positions marked with correspondingly coloured bands on the graphs. The correlation functions in the thinnest layers show a very long decay tail, reaching times of
seconds at intermediate temperatures, that disappears at higher temperatures. When looking at the videos of the same phase transitions, we realise that such long tails of the autocorrelation functions originate from the long-lived half-skyrmions. Skyrmions appear and linger for seconds in different positions on the frame before they disappear and reappear again (see Supplementary Video 3 of heating in the thinnest regions). The long tails of the correlation functions therefore describe life and death of half-skyrmions in the thinnest region.
Figure 13. (Colour online) Dynamics in thin BPIII layers. (a) Temperature dependency of the slow and fast relaxation measured in 80, 110 and 500 nm thick cells from left to right, measured along the marked vertical lines in the phase diagram of . (b) Selected correlation functions at corresponding thicknesses measured at three different temperatures marked in (a). We see that a slow decaying tail form at the at intermediate temperatures, marked with blue, a consequence of long lived half-skyrmions. Zeroes of the relative temperatures are determined by extrapolating the linear slowing down of the fast mode frequency near the isotropic phase to zero.
4. Conclusion
It would be very interesting to see whether a phase analogous to BPIII exists in any other physical system. There has been work done by Tewari, Belitz and Kirkpatrick [Citation81] on the phases observed in the pressure-temperature phase diagram of MnSi, which shows some exotic magnetic phases. Much like the phase diagram of , the
phase diagram they studied, exhibits a critical point. At pressures above the critical point, at low enough temperatures, a new phase is observed which exhibits non-Fermi liquid (NFL) behaviour. Within the NFL neutron scattering experiments gave evidence that on a large scale the NFL is disordered but possesses a degree of short-range helical order of magnetic spins. Its structure was considered a mixture between the higher temperature chiral gas and lower temperature chiral spin liquid. In that sense the authors speculated this ‘quantum fog phase’ may be an analogue of BPIII found in LCs. If this were true, measurements of its dynamics should also show a two mode behaviour. A dynamically disordered phase was found in MnSi just above the
at an ambient pressure using neutron spin echo spectroscopy [Citation82] and measurements show relaxation times in the order of nanoseconds, most likely a signature of the soft mode relaxation.
Temperature instability of magnetic skyrmions is one of the major drawbacks in realisation of computer memory devices and logic systems based on them. Although they are able to exist at room temperature in certain thin ferromagnets, some of magnetic skyrmion most useful properties have only been demonstrated on skyrmions stable at lower temperatures and/or on skyrmions in lattices, rather than on single skyrmions at room temperature. Additionally the control of the magnetic skyrmion sizes and size dispersion is challenging [Citation43]. In comparison LC skyrmions may be just as easily controlled, due to the strong response of LCs to the external fields. This was demonstrated recently by Smalyukh group [Citation83] where they showed controlled squirming motion of nematic full-skyrmions due to the oscillating external electric field. The skyrmions presented in this work are fractional and stable only in confinement but they proved very stable with respect to temperature – observe the region of dense half-skyrmion in the phase diagram of . Such temperature stability combined with possible ease of their control may be enough for LC skyrmions to be considered in realisation of future (LC) skyrmion-based devices.
In conclusion we offered in this work a novel view on the highly chiral blue phases of liquid crystals by understanding its long conjectured constituents, the DTCs, as skyrmionic filaments in analogy to magnetic systems. The connection becomes especially clear in confinement, where their skyrmionic nature is clearly revealed. Using a combination of direct experimental observations, numerical and optical simulations, we explained the structure of the amorphous bulk BPIII in detail. We have shown the structure is special in its static appearance and that it is more so unique in its dynamics, which we were able to observe in real time under an optical microscope. It is our hope that this work encourages researchers in the search of phases in other systems exhibiting analogous behaviour of thermally driven fluctuations of skyrmions or other topological objects, and of a definite proof of quantum blue fog existence.
Supplemental Material
Download PDF (69.3 KB)Acknowledgements
I.M. wishes to thank Ivan I. Smalyukh for discussion on the occasion of the Colloidal Mikado workshop in Oxford that inspired this study. We acknowledge discussions with Jun-ichi Fukuda at early stages of this work. We also acknowledge the support and discussions with S. Žumer and Ž. Kos.
Disclosure statement
No potential conflict of interest was reported by the author(s).
Supplementary material
Supplemental data for this article can be accessed online at https://doi.org/10.1080/02678292.2023.2188613
Additional information
Funding
Notes
1. This kind of twisting in all polar directions was somewhat misleadingly named double-twist to imply being more twisted than a single-twisted spiral structure of usual cholesterics.
2. RHC polarised light is defined, according to de Gennes [67] as the light component reflected of a right-handed helical structure. In our experiments RHC was obtained by passing light through a plate with its fast axis at an
angle with respect to the linear polariser. See insets on the left of for directions of
rotation sense with respect to the light
vector in both cases.
References
- Crooker PP. Blue phases: Springer New York; 2001.
- Selinger JV. Interpretation of saddle-splay and the oseen-frank free energy in liquid crystals. Liq Cryst Rev. 2018 Jul;6(2):129–142.
- Saupe A. On molecular structure and physical properties of thermotropic liquid crystals. Mol Cryst. 1969;7(1):59–74.
- Bergmann K, Stegemeyer H. Optical properties of the isotropic mesophase formed by cholesteryl esters. Berichte der Bunsen Gesellschaft für Physikalische Chemie. 1978 Dec;82(12):1309–1311.
- Marcus M. Quasi crystalline behaviour and phase transition in cholesteric blue phase. J Phys. 1981;42(1):61–70.
- Finn PL, Cladis PE. Cholesteric blue phases in mixtures and in an electric field. Mol Cryst Liq Cryst. 1982 Apr;84(1):159–192.
- Johnson DL, Flack JH, Crooker PP. Structure and properties of the cholesteric blue phases. Phys Rev Lett. 1980 Aug;45(8):641–644.
- Stegemeyer H, Blümel T, Hiltrop K, et al. Thermodynamic, structural and morphological studies on liquid-crystalline blue phases. Liq Cryst. 1986 Jan;1(1):3–28.
- Miller RJ, Gleeson HF. Lattice parameter measurements from the kossel diagrams of the cubic liquid crystal blue phases. Journal de Physique II. 1996 Jun;6(6):909–922.
- Miller RJ, Gleeson HF, Lydon JE. Novel features in blue phase kossel diagrams. Mol Cryst Liq Cryst. 1997 Aug;302(1):145–150.
- Kikuchi H, Hirata S, Uchida K. Confocal laser scanning microscopic observation of polymer-stabilized blue phase i. Mol Cryst Liq Cryst. 2007;465(1):283–288.
- Collings PJ. Optical activity and light scattering in highly chiral liquid crystals. Mod Phys Lett B. 1992;6(8):425.
- Brog TK, Collings PJ. Optical activity in the blue phase of a cholesteric liquid crystal. Mol Cryst Liq Cryst. 1980;60(1–2):65.
- Becker JB, Collings PJ. Optical measurements on the bp iii to isotropic phase transition in highly chiral liquid crystals. Mol Cryst Liq Cryst. 1995;265(1):163–170.
- Kutnjak Z, Garland CW, Passmore JL, et al. Supercritical conversion of the third blue phase to the isotropic phase in a highly chiral liquid crystal. Phys Rev Lett. 1995;74(24):4859.
- Thoen J. Adiabatic scanning calorimetric results for the blue phases of cholesteryl nonanoate. Phys Rev A. 1988;37(5):1754–1759.
- Kutnjak Z, Garland CW, Schatz CG, et al. Critical point for the blue phase III–isotropic phase transition in chiral liquid crystals. Phys Rev E. 1996;53(5):4955.
- Koistinen EP, Keyes PH. Light-scattering study of the structure of blue phase III. Phys Rev Lett. 1995 May;74(22):4460.
- Singh U, Collings PJ, Booth CJ, et al. Static and dynamic light scattering near the liquid crystalline blue phase III - isotropic liquid critical point. J Phys II. 1997;7(11):1683.
- Yang DK, Crooker PP. Chiral-racemic phase diagrams of blue-phase liquid crystals. Phys Rev A. 1987;35(10):4419.
- Anisimov MA, Agayan VA, Collings PJ. Nature of the blue-phase-III-isotropic critical point: an analogy with the liquid-gas transition. Phys Rev E. 1998;57(1):582.
- Lubensky TC, Stark H. Theory of a critical point in the blue-phase-III-isotropic phase diagram. Phys Rev E. 1996;53(1):714–720.
- Hornreich RM, Shtrikman S. Broken icosahedral symmetry: a quasicrystalline structure for cholesteric blue phase III. Phys Rev Lett. 1986;57(15):1963.
- Longa L, Fink W, Trebin HR. Liquid-crystalline blue phase III and structures of broken icosahedral symmetry. Phys Rev E. 1993;48(3):2296.
- Rokhsar DS, Sethna JP. Quasi crystalline textures of cholesteric liquid crystals: Blue phase III? Phys Rev Lett. 1986;56(16):1727.
- Longa L, Trebin HR. Bond orientational order in the blue phases of chiral liquid crystals. Phys Rev Lett. 1993;71(17):2757.
- Collings PJ. Optical rotatory dispersion measurements in the third cholesteric blue phase. Phys Rev A. 1984 Oct;30(4):1990.
- Hornreich RM, Kugler M, Shtrikman S. Localized instabilities and the order-disorder transition in cholesteric liquid crystals. Phys Rev Lett. 1982 May;48(20):1404–1407.
- Henrich O, Stratford K, Marenduzzo D, et al. Ordering dynamics of blue phases entails kinetic stabilization of amorphous networks. Proc Nat Acad Sci. 2010;107(30):13212.
- Henrich O, Stratford K, Cates ME, et al. Structure of blue phase III of cholesteric liquid crystals. Phys Rev Lett. 2011;106(10):107801.
- Zasadzinski JAN, Meiboom S, Sammon MJ, et al. Freeze-fracture electron-microscope observations of the blue phase III. Phys Rev Lett. 1986;57(3):364.
- Gandhi SS, Kim MS, Hwang JY, et al. Electro-optical memory of a nanoengineered amorphous blue phase III polymer scaffold. Adv Mat. 2016;28(40):8998.
- Skyrme THR. A unified field theory of mesons and baryons. Nucl Phys. 1962;31:556–569.
- Rho M, Zahed I. The multifaceted skyrmion. World Scientific; 2016.
- Barrett SE, Dabbagh G, Pfeiffer LN, et al. Optically pumped NMR evidence for finite- size skyrmions in GaAs quantum wells near landau level filling v=1. Phys Rev Lett. 1995;74(25):5112–5115.
- Leanhardt AE, Shin Y, Kielpinski D, et al. Coreless vortex formation in a spinor bose- Einstein condensate. Phys Rev Lett. 2003;90(14):140403.
- Mermin ND, Ho TL. Circulation and angular momentum in the a phase of superfluid helium-3. Phys Rev Lett. 1976;36(11):594–597.
- Bogdanov AN, Rößler UK. Chiral symmetry breaking in magnetic thin films and multi- layers. Phys Rev Lett. 2001 Jun;87(3):037203.
- Rössler UK, Bogdanov AN, Pfleiderer C. Spontaneous skyrmion ground states in magnetic metals. Nature. 2006;442(7104):797–801.
- Mühlbauer S, Binz B, Jonietz F, et al. Skyrmion lattice in a chiral magnet. Science. 2009;323(5916):915–919.
- Dzyaloshinsky I. A thermodynamic theory of “weak” ferromagnetism of antiferromagnetics. J Phys Chem Solids. 1958;4(4):241–255.
- Moriya T. Anisotropic superexchange interaction and weak ferromagnetism. Phys Rev. 1960;120(1):91–98.
- Fert A, Reyren N, Cros V. Magnetic skyrmions: advances in physics and potential applications. Nat Rev Mat. 2017;2(7):17031.
- Nagaosa N, Tokura Y. Topological properties and dynamics of magnetic skyrmions. Nature Nanotechnol. 2013 Dec;8(12):899–911.
- Bogdanov AN, Shestakov AA. Inhomogeneous two-dimensional structures in liquid crystals. JETP. 1998;86(5):911–923.
- Bogdanov AN, Rößler UK, Shestakov AA. Skyrmions in nematic liquid crystals. Phys Rev E. 2003 Jan;67(1):016602.
- Leonov AO, Dragunov IE, Rossler UK, et al. Theory of skyrmion states in liquid crystals. Phys Rev E. 2014;90(4):042502.
- Ackerman PJ, Trivedi RP, Senyuk B, et al. Two-dimensional skyrmions and other solitonic structures in confinement-frustrated chiral nematics. Phys Rev E. 2014;90(1):012505.
- Foster D, Kind C, Ackerman PJ, et al. Two-dimensional skyrmion bags in liquid crystals and ferromagnets. Nat Phys. 2019;15(7):655–659.
- Sohn HRO, Liu CD, Smalyukh I. Schools of skyrmions with electrically tunable elastic interactions. Nat Commun. 2019;10(1):4744.
- Wu JS, Smalyukh II. Hopfions, heliknotons, skyrmions, torons and both abelian and nonabelian vortices in chiral liquid crystals. Liq Cryst Rev. 2022 Mar:1–35.
- Lin SZ, Saxena A, Batista CD. Skyrmion fractionalization and merons in chiral magnets with easy-plane anisotropy. Phys Rev B. 2015;91(22):224407.
- Yu XZ, Koshibae W, Tokunaga Y, et al. Transformation between meron and skyrmion topological spin textures in a chiral magnet. Nature. 2018;564(7734):95–98. DOI:10.1038/s41586-018-0745-3
- Nych A, Fukuda J, Ognysta U, et al. Spontaneous formation and dynamics of half- skyrmions in a chiral liquid-crystal film. Nat Phys. 2017;13(12):1215.
- Fukuda J, Žumer S. Quasi-two-dimensional skyrmion lattices in a chiral nematic liquid crystal. Nat Commun. 2011 Mar;2(1).
- Duzgun A, Selinger JV, Saxena A. Comparing skyrmions and merons in chiral liquid crystals and magnets. Phys Rev E. 2018 Jun;97(6):062706.
- Pišljar J, Ghosh S, Turlapati S, et al. Blue phase III: topological fluid of skyrmions. Phys Rev X. 2022 Jan;12(1):011003.
- Khan RK, Turlapati S, Rao NVS, et al. Novel achiral four-ring bent-shaped nematic liquid crystals with trifluoromethyl and methyl substituents in the central molecular core: an unusually large Kerr constant in blue phase III of nematic-chiral dopant mixture. Jour Mat Chem C. 2017;5(27):6729–6737.
- Pišljar J, Posnjak G, Pajk S, et al. Comparison of sted, confocal and optical microscopy of ultra-short pitch cholesterics. Liq Cryst. 2020 Jan;47(9):1303–1311.
- Škarabot M, Čepič M, Žekš B, et al. Birefringence and tilt angle in the antiferroelectric, ferroelectric, and intermediate phases of chiral smectic liquid crystals. Phys Rev E. 1998 Jul;58(1):575–584.
- Berne P Robert Pecora BJ. Dynamic light scattering: with applications to chemistry, biology, and physics. Dover Pubn Inc.; 2000.
- Harada T, Crooker PP. Light scattering through the isotropic-cholesteric phase transition of a cholesteric liquid crystal. Phys Rev Lett. 1975;34(24):1540.
- Mahler DS, Keyes PH, Daniels WB. Light-scattering study of the pretransitional phenomena in the isotropic phase of cholesteryl oleyl carbonate (COC). Phys Rev Lett. 1976;36(9):491.
- Cerbino R, Trappe V. Differential dynamic microscopy: probing wave vector dependent dynamics with a microscope. Phys Rev Lett. 2008;100(18):188102.
- Arko M, Petelin A. Cross-differential dynamic microscopy. Soft Matter. 2019;15(13):2791–2797.
- Petelin A. Cross-differential dynamic microscopy, v. 0.1.2; 2020.
- de Gennes PG, Prost J. Physics of liquid crystals. Oxford University Press; 1995.
- Ravnik M, Alexander GP, Yeomans JM, et al. Mesoscopic modelling of colloids in chiral nematics. Faraday Discuss. 2010;144:159–169–81467–81. discussion 203–22.
- Goossens WJA. Order electricity reconsidered. Liq Cryst. 1989;5(4):1083–1097.
- Petelin A. Diffractive transfer matrix method, v. 0.6.2. 2020.
- Bregar A, White TJ, Ravnik M. Refraction of light on flat boundary of liquid crystals or anisotropic metamaterials. Liq Cryst Rev. 2017 Jan;5(1):53–68.
- Oskooi AF, Roundy D, Ibanescu M, et al. Meep: a flexible free-software package for electromagnetic simulations by the fdtd method. Comp Phys Comm. 2010;181(3):687–702.
- Allan D, van der Wel C, Keim N, et al. Soft-matter/trackpy: trackpy v0.4.2; 2019.
- Kleman M, Friedel J. Disclinations, dislocations, and continuous defects: a reappraisal. Rev Mod Phys. 2008 Jan;80(1):61–115.
- Fan C, Kramer L, Stephen MJ. Fluctuations and light scattering in cholesteric liquid crystals. Phys Rev A. 1970 Dec;2(6):2482–2489.
- Pantea MA, Keyes PH. Fluctuations of the tensor order-parameter modes in a cholesteric liquid crystal. Phys Rev E. 2005 Mar;71(3):031707.
- Brazovskil SA, Dmitriev SG. Phase transitions in cholesteric liquid crystals. Zh Eksp Teor Fiz. 1975;69:979–989.
- Brazovskii Vmf SA. Critical phenomena in cholesteric liquid crystals. Zh Eksp Teor Fiz. 1978;75:1140.
- Hornreich RM, Shtrikman S. Theory of light scattering in cholesteric blue phases. Phys Rev A. 1983 Sep;28(3):1791–1807.
- Wyse JE, Collings PJ. Light scattering in the isotropic phase of highly chiral liquid crystals. Phys Rev A. 1992 Feb;45(4):2449–2454.
- Tewari S, Belitz D, Kirkpatrick TR. Blue quantum fog: chiral condensation in quantum helimagnets. Phys Rev Lett. 2006;96(4):047207.
- Pappas C, Lelièvre-Berna E, Falus P, et al. Chiral paramagnetic skyrmion-like phase in MnSi. Phys Rev Lett. 2009 May;102(19).
- Ackerman PJ, Boyle T, Smalyukh II. Squirming motion of baby skyrmions in nematic fluids. Nat Commun. 2017 Sep;8(1).