
 ?Mathematical formulae have been encoded as MathML and are displayed in this HTML version using MathJax in order to improve their display. Uncheck the box to turn MathJax off. This feature requires Javascript. Click on a formula to zoom.
ABSTRACT
In this article, we report on the synthesis of chiral bimesogens that possess silyloxy central linking groups. On first examination of the mesomorphic properties of the materials by X-ray diffraction and electrical field studies we came to the conclusion that the materials exhibit ferroelectric and antiferroelectric smectic C* phase behaviour. However, detailed investigations of the bimesogens indicated that the phases were not conventional smectics, but in addition strange phases that exhibited natural helical filaments on cooling from the isotropic liquid were formed. Indications are that these phases are possibly related to twist-bend structures or in-plane, modulated bent-core phases.
GRAPHICAL ABSTRACT
Introduction
In our studies on nanophase-segregated chiral systems, the chiral bimesogens (I and II) shown in were prepared with a view of examining their potential ferro- and antiferro-electric properties. Upon melting at 34.1°C bimesogen I [Citation1,Citation2] was found to exhibit an antiferroelectric phase, which existed up to 103.6°C before forming the isotropic liquid. In comparison, materials possessing rigid aromatic terphenyl units, based on bimesogen II, were thought to exhibit both ferro- and antiferro-electric phases [Citation3,Citation4]. However, these materials also exhibited unusual microscopic defect textures near to the clearing point which required further investigation.
Figure 1. Structures of bimesogens possessing silyloxy central connecting groups. Bimesogen I has been reported to exhibit an antiferroelectric smectic CA* phase, whereas bimesogens II are the focus of this article.
The bimesogen materials II were designed to possess central nanosegregating siloxane linking units between methylene-oxy chains of varying lengths, to which were attached laterally difluoro-substituted p-terphenyl moieties possessing terminal chiral (S)-2-octyloxy-groups as shown in . Details of the structural units that were used to build up the molecular architecture are given in . Three methyleneoxy-chains were prepared having 3, 8 and 9 methylene units attached to ethylene groups present from synthesis, as shown in . This means that the methylene spacer units were of 5, 10 and 11 in length. Thus, di- and tri-silyloxy central units were located either in a position whereby they were closely linked to the overall molecular architectures or effectively decoupled for the longer methyleneoxy chains. As a consequence, nanosegregation of the central linking groups was of a higher degree as the series of bimesogens was ascended for greater values of n as shown in .
Figure 2. The structural designs of the bimesogens targeted for preparation.
The terminal chiral groups for the bimesogens were derived from (R)-2-octanol of high enantiopurity, <0.95 ee, which was reacted under Mitsunobu conditions with 4-bromo-4’-hydroxybiphenyl to yield the intermediate 4-bromo-4’-((S)-1-methylheptyloxy)biphenyl. Inversion of the stereochemical centre occurred during this reaction, with retention of a relatively high degree of optical purity [Citation5]. A single production of the intermediate was subsequently used in the pathway to all of the final products, thereby ensuring their relative enantiopurities, and consistency across the homologous series.
In the following, the bimesogens are labelled as follows. All are numbered as 2 to differentiate them from the starting material 1 shown in . The different bimesogens are lettered a for disiloxanes, and b for trisiloxanes, and numbered by the value of n for the methylene linking group attached to the ethylene unit of the terminal group of the terphenyl moieties. Therefore, the total number of methylene groups on either side of the siloxanes is n + 2.
Scheme 1. Pathway to the syntheses of six dimers 2a(3, 8, 9) and 2b(3, 8, 9).
Characterisations of the mesophases formed were investigated and achieved by differential scanning calorimetry, X-ray diffraction, electrical field studies, and also molecular dynamics simulations. Finally, in this article we compare the results obtained with those achieved via polarised light microscopy (POM).
Synthetic pathway to the preparation of the bimesogens [2(a) and 2(b)]
The alkenic precursors, 1 (n = 3, 8, 9), which were prepared starting from difluoro-hydroxyterphenyl [Citation3], were hydrosilylated to give bimesogens with two or three dimethyl siloxy units as the linking groups, as shown in . The syntheses were performed using either tetramethyldisiloxane (a) or heptamethyl trisiloxane (b) to produce dimers with selected central spacer units. The hydrosilylation reactions [Citation6,Citation7] were carried out in dry toluene at room temperature in the presence of Karstedt’s catalyst [Citation8]. Detailed syntheses for the six dimers 2a(3, 8, 9) and 2b(3, 8, 9) and analytical data confirming their structures are given in the Supplementary Information SI section S.1.
Results and discussion
Transition temperature and phase behaviour
Phase identifications and determination of transition temperatures of the pure materials [Citation9] were carried out by thermal polarised light microscopy (POM) and differential scanning calorimetry (DSC), which were used to determine melting points and to confirm transition temperatures from microscopy. Details of their uses are given in the Supplementary Information (SI) section S.2. The transition temperatures and the phase assignments made from these observations are given together in . The assignments also relied on electrooptic investigations for the definitive classifications of mesophase type as described later.
Table 1. Transition temperature (°C) and associated enthalpies [kJ mol−1] for the bimesogens determined by POM and DSC.
Both series were found from the defect textures, observed by POM, to exhibit tilted smectic variants on cooling from the isotropic liquid. The series with an even number of silicon atoms exhibited synclinic phases (see later), whereas the series with an odd number of silicon atoms preferentially exhibited anticlinic phases. Obviously, these results indicate that the type of tilted phase formed can be controlled to a large extent by the structure of the internal linking or bridging unit. Bimesogen 2b8, however, is the only material to exhibit both synclinic (SmSyn ferroelectric) and anticlinic (SmAnti antiferroelectric) properties, which were identified from the hysteresis loops found in the electrooptic studies, and from defect textures observed by POM. The synclinic temperature range was found to be relatively short when compared with that of the anticlinic phase, which may be due to a change in molecular conformation from linear to a bent shape.
Within each series of materials, there is a clear effect with respect to the melting points, with bimesogens containing an even number of silicon atoms giving higher melting points than the corresponding series with an odd number of silicon atoms. However, the clearing points for the analogues of both series of materials exhibit similar values. This suggests that differences in the volumes of the disiloxane versus the trisiloxane units in the centres of the chain may affect the packing of the molecules with respect to the solid state more so than for the liquid crystal phases. This trend also seems to be irrespective of when the methylene spacer has an odd or even number of methylene units. Moreover, across both series, there is only a slight dependence of the clearing points on the lengths of the flexible methylene spacers (n = 3, 8 or 9). Overall, it appears that there is a greater influence of the parity of the number of silicon atoms in the molecular architecture on the mesophase type [Citation10–24]. It is thought that the differing mesophase behaviour could be due to potential helical conformations of the oligo(dimethylsiloxane) chains. For even numbers of silicon atoms, this may give rise to a nearly linear shape for the bimesogens, whereas for the odd silicon parity an overall bent molecular shape may be possible. Hence, -SiOSi- units of even Si parity appear to stabilise a synclinic correlation between adjacent layers, whereas -SiOSiOSi- of odd Si parity stabilise anticlinic interlayer correlations.
shows potential structures for the synclinic (a) and anticlinic (b) structures of the bimesogens, where the silicon-based moieties and the aromatic units separately group together to form nanosegregated -Si-C- lamellar structures. The resulting layering can be a repeat of the individual molecules in monolayers to give a synclinic tilted smectic C phase, as shown in , or an anticlinic structure of a bilayer smectic CA phase as shown in . Alternatively, there can be interdigitation of the dimers between the layers for both types of phase, thereby giving the possibility of intercalation of the molecules. In this case, the mesophase labelling can be identified as a Cd phase, where d indicates interdigitation.
Figure 3. (Colour online) Potential synclinic (a) and anticlinic (b) nanosegregated molecular layered structures of the smectic C phases of bimesogens, and the potential interdigitated synclinic intercalated structures of a smectic Cd phase of a bimesogen.
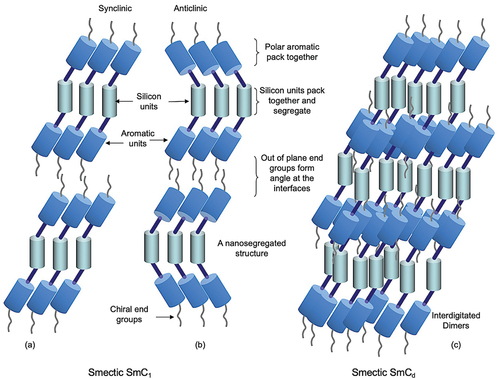
In the following studies, we show that there are possibilities for the bimesogens to exhibit either SmC or SmCA phases. In addition, for monolayer systems, due to the chiral nature of the end groups, molecular interpenetration of the layer interfaces can have a twist angle with respect to the layer planes due to the asymmetric structuring of the terminal groups.
Modelling of molecular shape
Computational molecular modelling was performed with the desktop modelling software Chem3D from Cambridge Scientific in order to investigate the shapes of individual molecules. A trial molecular structure with alkyl chains in the all-trans-conformation was built and energy-minimised using the MM2 force field. The local energy minima were identified and individually optimised using MOPAC/PM3 in the gas phase at absolute zero. Quantum chemical calculations were also performed using the Gaussian 09 revision e.01 suite of programmes.
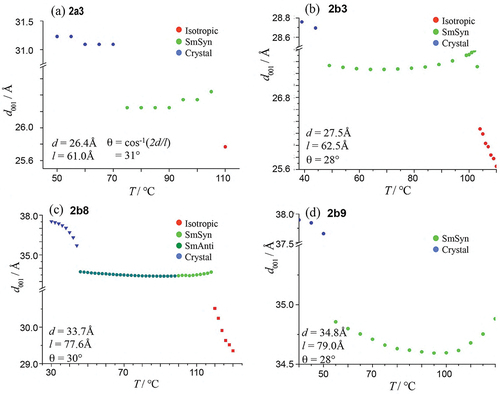
The simple modelling of bimesogen 2a3, shown in , resulted in a rod-like conformation (a) and a bent-like structure (b) depending on the conformational structure of the bimesogen at the starting point of the simulation. These two extremes, however, allowed us to determine molecular distances and bend angles as shown in the figure (note these are only models). The bend angle for structure (b) was determined by measuring the lateral distance between the ends of the molecule. Using the lengths of the two halves of the molecule provided a molecular triangle from which the bend angle was found to be approximately 120°. For the other bimesogens in this family, the bend angle was found to be approximately the same. From these two models, there are various possible mesophase structures where the molecules are nanosegregated (as shown in ) or intercalated via the halves of the molecules overlapping. For the tilted analogues, there are two possibilities of synclinic and anticlinic arrangements of the molecules. In the following, we describe the results obtained from X-ray diffraction for the layer spacings and tilt angles as a function of temperature (°C), see . Subsequently, we perform calculations of the tilt angles (θ) from the layer spacing (d) and the molecular length (l), which allowed comparisons to be made between a number of the compounds, as shown in .
Figure 4. (Colour online) Minimum energy conformations for molecules of the bimesogen 2a3, modelled using Chem3D from Cambridge scientific, and DFT theory at the MO62-X/6-31 G level of theory.
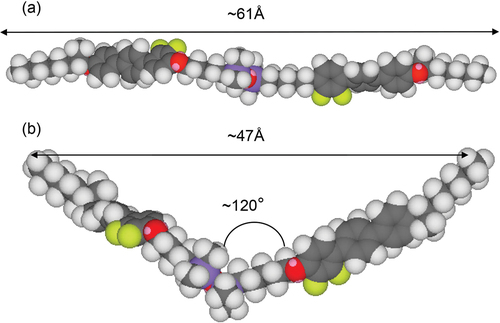
Figure 5. (Colour online) (a) 2-D powder diffraction patterns in each phase of matter, and (b) diffraction profiles as a function of temperature for bimesogen 2a3.
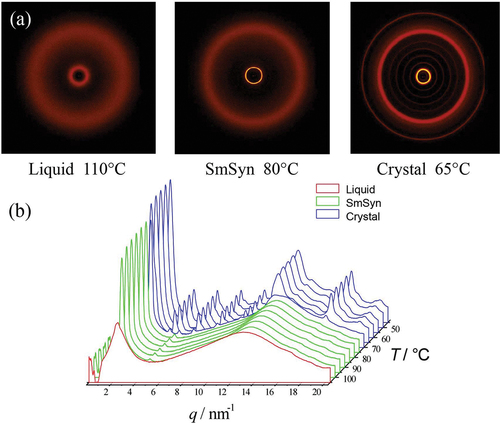
Figure 6. (Colour online) (a) 2-D powder diffraction patterns in each phase of matter, and (b) diffraction profile as a function of temperature for bimesogen 2b3.
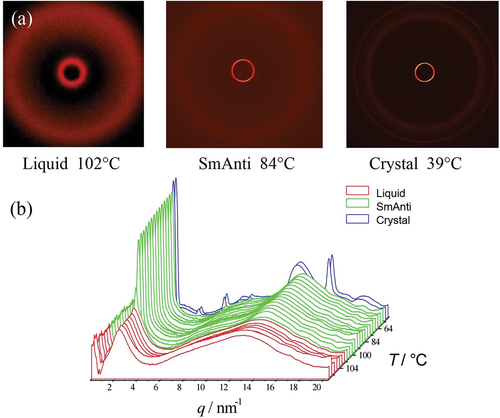
Figure 7. (Colour online) (a) 2-D Powder diffraction patterns in each phase of matter, (b) diffraction profiles as a function of temperature for bimesogen 2b8.
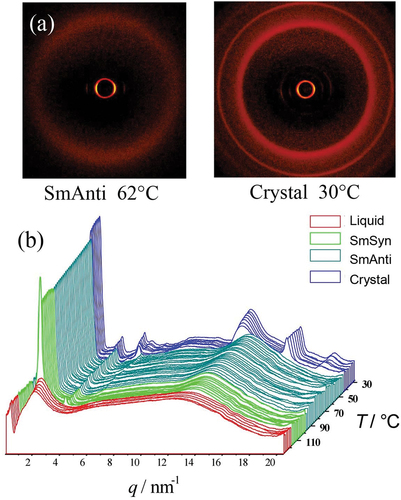
Figure 8. (Colour online) Expanded graph of the layer spacing in the synclinic and anticlinic phases as a function of temperature (°C) for bimesogen 2b8.
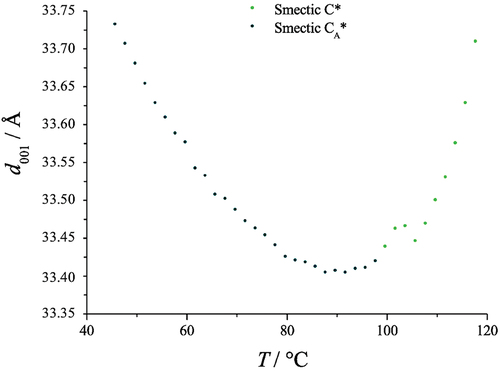
Figure 9. (Colour online) (a) 2-D powder diffraction patterns in each phase of matter, and (b) diffraction profiles as a function of temperature for bimesogen 2b9.
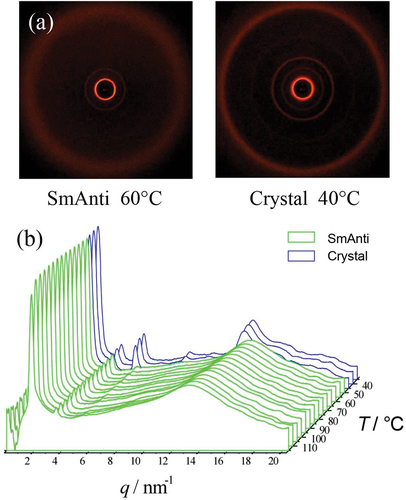
Figure 10. (Colour online) Values of the layer spacings, d, as a function of change in temperature for all four bimesogens.
X-ray diffraction studies
In the following, the structures of the mesophases exhibited by four bismesogens, starting with compound 2a3, were investigated via 2-D ‘powder’ diffraction along with their diffraction profiles as a function of temperature (°C) (further details for the X-ray measurements are given in the SI section S.3). The layer spacings of d for each material were combined for the purposes of comparison in a subsequent section.
Bimesogen 2a3
shows the 2-D powder diffraction patterns (a), and diffraction profiles versus temperature (b), for compound 2a3. The powder diffraction pattern (a) shows a synclinic smectic phase that possesses a first-order Bragg reflection in the small-angle region, which corresponds to the layer ordering of the molecules. Whereas picture 5(b) shows a small second-order diffraction peak in the small angle, and a wide-angle peak that is quite sizeable compared to what might be normally expected for a SmC phase. The solid state shown in 5(b) indicates a very well-packed arrangement of the molecules as up to the fifth-order reflection can be seen. The diffuse wide-angle peak in the mesophase is characteristic of the liquid-like arrangement of the side-to-side packing of the molecules within the layers. The X-ray tilt angle for the synclinic phase was determined to be 31.0° from the layer spacing and the molecular length.
Bimesogen 2b3
X-ray diffraction studies on bimesogen 2b3, which is thought to exhibit an anticlinic phase, are shown together in ). In the anticlinic phase, the sharp small-angle reflection shows positional order in the Z-direction. In comparison, the wide-angle reflection is diffuse as there is no positional order of the molecules within the layers. These results are characteristic for a smectic phase with only short-range positional ordering of the molecules.
The layer periodicity of the anticlinic phase was determined from the first-order reflection and is plotted as a function of temperature in . Upon cooling, the layer spacing decreases slightly over the temperature range from the onset of the phase formation. This reflects the molecular tilting, which increases as the temperature is reduced. The maximum layer spacing measured was ~27.5 Å for the estimated all trans molecular length of 62.5 Å. By making the assumption using the method shown at the bottom left in , in the previous X-ray study the tilt angle was found to be approximately 28°, which is considerably smaller than the tilt angle determined from electrooptic studies, see later. Approaching the anticlinic phase on cooling, it can be seen that there is considerable structural organisation over a temperature of 10 °C in the liquid phase, such that this state may be described as a structured liquid phase. Examination of the wide-angle reflection shows that it is quite a sizeable, and broad liquid-like peak with a bowing of the baseline around 6q. This cannot be a second-order diffraction peak and so must come from the interactions of the trisiloxane central linking group. Note also that the broad peak in the mid-region, which is associated with the siloxane units, is more pronounced than for -SiOSi- moieties.
Bimesogen 2b8
This material was found to have a relatively low viscosity, and thus it was difficult to retain the sample in a Lindeman tube during measurements taken in the isotropic state. Therefore, the experiments were performed via heating the sample from crystal into isotropic liquid. Using this method, the material was found to exhibit both synclinic and anticlinic mesophases as shown in . The powder diffraction patterns for the anticlinic phase, at a temperature of 62°C, and the crystal phase at 30°C is shown in , and the scattering profiles as a function of temperature for all of the phases are shown in .
In up to third-order Bragg reflections are visible in the anticlinic phase indicating that the mesophase has relatively long-range out-of-plane order with possibly the layers being well defined, thereby giving a strongly correlated structure. In addition, there is a weak liquid-like reflection around 10 nm−1, which is probably due to a clustering of the siloxane moieties around 6q that have different intensities, albeit much weaker, in comparison to the methylene segments of the central linking groups. On the other hand, the broad wide-angle reflection corresponds to a lack of long-range order within the planes of the layers.
A typical expanded view of the layer spacing of the synclinic and anticlinic phases, as a function of temperature, is shown in . There is a small step in the curve, at a temperature near the transition between synclinic and anticlinic phases, showing that there is a phase change. Fluctuations indicate a slight increase in the layer spacing at ~105°C, which might be due to the change in tilt direction in adjacent molecular layers. From the onset of the synclinic phase to the disappearance of the anticlinic phase, the layer spacing first decreases from 33.7 Å to a minimum value of 33.4 Å and then increases back to 33.7 Å. However, the change involved in the layer spacing is only 0.3 Å, this is of comparable magnitude to the experimental error.
Closer examination of the transition at 100.3°C for the anticlinic to synclinic structures of bimesogen 2b8 shows on heating there are no step changes in the data and in effect, there are no major changes in structure at the phase transition, which is continuous. Thus, it appears that there is a lack of a first-order transition, and at best, a weak second-order transition might be possible. This observation suggests that the two possibilities for the structures of the synclinic and anticlinic phases (nanosegregative or intercalated) can be decided upon. Where the dimers intercalate, as shown in , overlapping by around 50%, at the transition there would be massive fluctuations and entanglements of the molecules as the tilt reorients in and between adjacent layers. Whereas for the monolayer nanostructured system, as shown in ), tilt reorientation without layer rupture would be possible. Thus, the results shown in could possibly favour a monolayer structuring for the bimesogens where the silicon units pack together and layering occurs between the ends of the molecules.
Conversely, at the start of this section we noted that bimesogen 2b8 possesses a low viscosity, which could favour interdigitated arrangements. Therefore, it is important that we should also consider further the local interactions between the different segments of the molecules. For instance, the lateral interactions of the polar fluoro-terphenyl moieties would be strong, and with their segments being relatively rigid they would form well-organised layers, with the rod-like molecules still being able to slide between their layers. Conversely, although siloxane nanosegregated layers may form clearly distinct layers, the layers themselves would be composed of flexible groups that are less organised, and with adjacent non-polar liquid-like methylene chains separating them from the terphenyl layers. Potentially, the mesophase structure could therefore comprise strong terphenyl layers separated by low viscosity liquid-like layers, giving an overall interdigitated structure as shown in . Later, we describe another methodology involving computer simulations which were used to elucidate further upon the packing/layering possibilities.
Bimesogen 2b9
This bimesogen was found to exhibit only one mesophase, which was determined to be an anticlinic phase. The powder diffraction patterns for this phase, along with those of the crystal, are depicted together in . The scattering profiles as a function of temperature are shown in the accompanying figure (b). The small-angle region demonstrates that there is very long-range out-of-plane ordering for the mesophase, whereas the wide angle regions show that within the planes of the layers, like the other bimesogens, the ordering is short-range and liquid-like.
The scattering profiles show that near the transition of the liquid to the layered phase first and second-order reflection maxima occur, and upon transition into the anticlinic phase a third-order Bragg reflection becomes visible. This implies that a well-packed system is formed, where the sample has long-range out-of-plane ordering, with liquid-like ordering of the molecules within the layers, potentially with nanosegregation forming. The layer spacing as a function of temperature is also interesting as it first falls and then it increases again as the sample is heated. As this occurs over a change in spacing of only 0.5 Å, it is difficult to say if this variation in spacing is significant or not.
Layer spacings
The values of the layer spacings, d, as a function of change in temperature for all four of the bimesogens have been collected in . The change in the layer spacing is also linked to the potential tilt angle. For bimesogens 2b3 and 2b9, which exhibit just an anticlinic mesophase, there is a fall in d near the mid-point of the temperature range of the phase. For 2a3 there appears to be a similar change for the synclinic phase with the layer spacing increasing with temperature, but with a levelling off as the temperature is lowered. Interestingly, for bimesogen 2b8, which exhibits both anticlinic and synclinic phases, the layer spacing is almost invariant with respect to temperature even though there is a transition between the two phases. This means that the tilt in the two phases is the same, and therefore the transition probably involves a rotation of about 180° of one-half of the bimesogen about the centre of the molecule and perpendicular to the layers, thereby creating a bent molecular shape without breakage of the layers. The implication being that the out-of-plane organization of the layers dominates, whereas the in-plane packing is liquid–liquid enough to allow easy rotation of the tilt.
It should also be noted that the calculated tilt angles are only to be used as guidance. This is because the determinations were made based on assumptions that the molecules are fully intercalated. There is a difference between the measured layer spacings and the estimated half molecular length. This difference can result not only from the molecular tilt but also from the orientational fluctuations of the molecules, the conformational distribution of the chains, the interdigitation, and the zig-zag molecular structure [Citation21–23].
Electrooptic studies
Electrical field studies were carried out with the bimesogens contained within cells of either 1 or 5 µm spacings, which were internally coated with parallel or antiparallel buffed polyimide alignment layers, details for which are given in the SI section S.4.
The spontaneous polarisations (Ps) for the synclinic phases of bimesogens 2a(3, 8, and 9), determined from the electric field studies, are shown together in , and for the synclinic/anticlinic phases of bimesogens 2b(8 and 9) in . It can be seen for the 2a series that material 2a3 has the highest value of the spontaneous polarisation (120 nCcm−2), whereas the spontaneous polarisation values for the other bimesogens in the series decrease as the methylene spacer length (n) is increased. As the value of the polarisation is measured as charge per unit area (Ccm−2) for three bimesogens which have the same stereogenic centres and similar values of ee and identical lateral polar groups associated with the terphenyl units, the only variable is the number of methylene units in the linking groups. The spacer unit also determines the relative molecular sizes, consequently the charge density is greater for the smaller molecules, and hence the polarisation should fall as the series is extended. Moreover, the magnitude of the polarisation is dependent on the tilt angle, the greater the magnitude of which the larger the polarisation (see later)
Figure 11. (Colour online) Spontaneous polarisation (nC cm−2) measured as a function of the reduced temperature for bimesogens (a) 2a(3, 8, and 9), and (b) 2b(8 and 9).
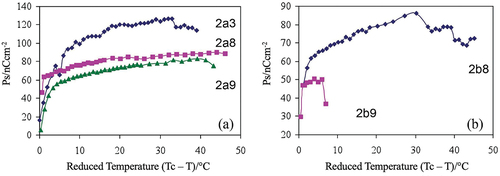
The spontaneous polarisation values for series 2b were similarly investigated, with the results for the anticlinic materials 2b8 and 2b9 being exhibited in . Unfortunately, the spontaneous polarisation value for compound 2b3 could not be evaluated due to the high threshold voltage required to fully switch the material in the antiferroelectric state. This indicates that the molecules in the anticlinic phase are potentially more strongly organised than for the other two bimesogens, possibly due to the potential formation of intercalated layers.
The spontaneous polarisation value for compound 2b8 was also measured from the ferroelectric, synclinic phase into the antiferroelectric, anticlinic phase. As the temperature was lowered, the voltage was increased at 80°C (Tc-T = 33.2°C) to 100 V (20.0 V μm−1) to ensure complete switching occurred in the antiferroelectric phase. However, the spontaneous polarisation could not be determined at temperatures lower than 68°C (Tc-T = 45.2°C) because only partial responses were obtained. For similar reasons, the spontaneous polarisation measurements for compound 2b9 could not be performed very far into the antiferroelectric phase.
In addition, the stabilities of the switched ferroelectric states for 2b8 were only evident with applied fields of relatively low frequency (<5 Hz), as shown in the optical hysteresis loops in ). The studies were made in the thin device cells, which allowed for slightly higher temperatures to be achieved for the clearing point than observed for the bulk specimens reported in .
Figure 12. (Colour online) Switching profiles for bimesogen 2b8, (a) at a temperature of 114.5°C and a frequency of 100 mHz, and (b) at a temperature of 113.5°C and a frequency of 50 mHz.
Apart from determining the value of the spontaneous polarisation, the electrical field studies can also determine the switched tilt angle for the molecules. However, the values determined in this way are different from those determined via X-ray diffraction. This is because the ones driven in electrical field studies are associated with the optic axes and hence electron density, whereas those found by diffraction are linked to the rod-like molecular shape. Thus, the tilt angle is also related to the magnitude and direction of the spontaneous polarisation. Consequently, the bimesogens with larger tilt angle also have higher values of the spontaneous polarisation.
Following on from the polarisation studies, bimesogen 2a3, with the short methylene spacers (n = 3), was found to exhibit a temperature-independent tilt angle of 45°, whereas the tilt angles for the other materials are dependent on the methylene unit, i.e., the tilt angle drops rapidly when n is increased to 8 and 9. Therefore, bimesogen 2a9 has the smallest tilt of 34.5°, slightly less than that of compound 2a8 as shown in . The values of the tilt angles for the two bimesogens, as determined from structural studies, were approximately 29° to 31°.
Figure 13. (Colour online) Tilt angle (°) as a function of the reduced temperature for bimesogens (a) 2a(3, 8, and 9), and (b) 2b(8 and 9).
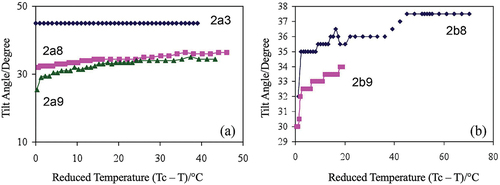
For the second family of bimesogens, the tilt angle measurements were carried out at different fields so as to drive the tilt to its maximum value and to diminish the domains in the specimens, i.e., 50 V, 20 mHz for compound 2b8 and 100 V, 50 mHz for compound 2b9, see . The tilt angles measured were found to have similar trends as for the spontaneous polarisation curves (as Ps ~ Ps(0)sin where
is the tilt angle), with the bimesogen 2b8 having the larger spontaneous polarisation with the higher tilt angle of 37.5°. The tilt angle for compound 2b9 was found to be lower at 34.0°, i.e., similar in behaviour to that found for the spontaneous polarisation measurements. In comparison, the measurements found via X-ray diffraction were 28°. Again, the tilt angles for the electrooptic studies were higher than those found from the molecular architectures. This is quite common for similar studies on synclinic chiral smectic C* phases, where the differences in tilt angles determined by the two techniques are not unusual [Citation25–27].
Microphase segregation
Previous studies show that the bimesogens are tilted in layers where there are two possible arrangements of the molecules, either synclinic or anticlinic. Modelling and experimental studies both show that the molecules are rod-like in the synclinic modification and potentially bent in the anticlinic form, thereby producing two possible mesophase structures. The combined measurements of the layer spacings and observations from the electrical switching appear to indicate that the molecules are intercalated. Electrical field studies also demonstrate that the synclinic phase is ferroelectric, whereas the anticlinic phase is antiferroelectric. The liquid-like nature in the planes of the layers also shows that both mesophases are subgroups of the smectic C class and the selection of the starting materials for the syntheses of the materials being chiral means that the phases can be classified as SmC* and SmCA*.
In terms of the components of the molecular structures of the bimesogens, it appears that the siloxane moieties segregate to give predominant bands of aromatic and silyloxy segments bounded by aliphatic regions. As a consequence, the structures of the phases can be either monolayer or bilayer where the layer spacing is less than half of a molecular length, as shown in .
Figure 14. (Colour online) Proposed conformations and nanosegregation of the molecules in the synclinic and anticlinic phases of the bimesogens.
Similar studies on siloxane dimers have been reported by Coles et al. [Citation10–13] and it was claimed that such segregation was the main driving force for the formation of intercalated smectic C* phases. Segregation, however, is probably not of singular importance for the bimesogens 2b(3, 8 and 9) where clean formation of siloxane layers is not evident because the siloxane units appear to overlap somewhat with the terminal alkyl chains. The siloxane units do not appear to be totally incompatible with hydrocarbon units as claimed by Coles and Tschierske [Citation28], and therefore it is possible that segregation does not affect the packing system in this case. Rather, it is the bulkiness and shape [Citation29] of the dimethyl silyloxy units in this case that induces steric packing effects that affect the overlapping of the molecules, and thereby the nature of the interdigitation. After all, in simple systems siloxanes tend to be miscible with hydrocarbons.
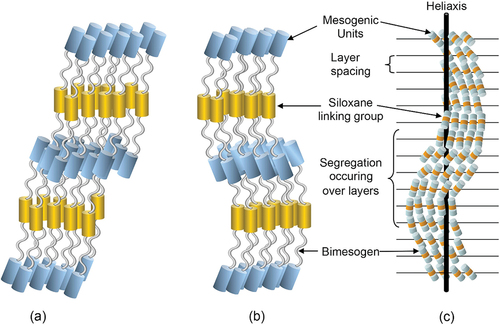
Assuming that the bimesogens are rod-like for synclinic phases and bent for anticlinic and that the molecules intercalate, shows a depiction of a nanosegregated structure for the synclinic phase in (a) and the anticlinic structure in (b). As the siloxane centres are soft and as the ends of the molecules are chiral, due to the 2-octyloxy substituent, both ends will twist in the same way to give a helix as expected, as shown in (c) for the synclinic phase. However, the twist about the heliaxis for the anticlinic phase means that as the bent molecules rotate about the main-axis they will appear to point in the opposite directions for a 180° rotation about the axis, thereby exhibiting rectangular patterns when viewed across the heliaxis. Consequently, the structure is that of a double twist cylinder, typical of those found for chiral nematics and smectic phases. As the axis of the helix is approached, for chiral smectics the magnitude of the tilt angle decreases. Moving away from the axis of the helix, the tilt angle increases and reaches its maximum value for the material. However, a point will be reached where further tilt is not possible due to defect stability, after which growth will cease resulting in the formation of filaments. These defect structures where unusual filaments tend to dominate are found for both synclinic and anticlinic phases, and the focus of the next POM sections of this article.
It should also be noted that there is an alternative conformation, which the dimeric systems could adopt. Instead of being stretched out, the molecules could bend into U-shaped conformations like hairpins. Such conformations have been found by Eremin et al. [Citation30] in their studies of dimeric systems. This possibility could be taken into consideration because the siloxane units are very flexible. The flexibility comes from the fact that the bond angle of Si-O-Si unit can bend between 100° to 180°. Thus, this might give the dimers more mobility and freedom to arrange themselves in various conformations in liquid crystal environments. In such cases, the molecules might still nanophase segregate with distinct layers or segments of siloxane units, aromatic cores and aliphatic chains.
Molecular dynamics in the exploration of mesophase formation
In order to elucidate the structures of the synclinic and anticlinic mesophases of the bimesogens, we chose to perform molecular dynamics (MD) simulations of both of the two mesophase types. Thus, fully atomistic MD simulations were performed on bimesogens 2a3 and 2b3 to explore the structures of the phases formed under different conditions. Initial test simulations showed that phase formation from a randomised (isotropic) state was very slow. Further test simulations performed from a pseudo-nematic state, where the molecules had some orientational order, gave rise to some positional order, but too slowly for simulations on larger systems to be practicable within a reasonable timeframe. Consequently, full simulations were performed on a number of pre-formed phases to assess their plausibility, initially via the extent to which these phases were stable in the simulations and then by obtaining parameters such as layer spacings for comparison with experimental values. SI Section S.5 gives full details of the methods and the simulations performed in these studies, including additional snapshots and plots of order parameters, layer spacings, and tilt angles from all the simulations.
In each case, the box at the start of the full simulation comprised 12 layers with 100 molecules in each layer, with the aim of simulating systems with enough layers to allow complex layer structures to develop, and large enough to avoid the layering or orientational ordering being affected too strongly by the periodic boundary conditions that were used. The simulations used anisotropic pressure coupling that enabled the box dimensions to vary freely, although in practice the pre-formed phases generally retained the approximate dimensions of the starting simulation box. All of the simulated phases evolved to some extent from the pre-formed phases used as the starting point, typically by relatively small changes in orientational order, positional order and layer spacing, and in the self-organisation of the groups comprising the molecules, as could be seen by analyses of the simulations and by visual inspection of the simulation frames over time.
Both synclinic and anticlinic smectic C phases were found to be stable in our simulations of 2a3 and 2b3, in contrast to experimental samples where 2a3 was observed to form a synclinic smectic C phase and 2b3 an anticlinic smectic C phase. Hence, the simulations suggest that there might be a subtle balance between which of these phases form for each compound, and this suggestion is supported to some extent by 2b8 showing both synclinic and anticlinic smectic C phases experimentally, with a very low transition enthalpy (0.1 kJ mol−1) at the phase change between them.
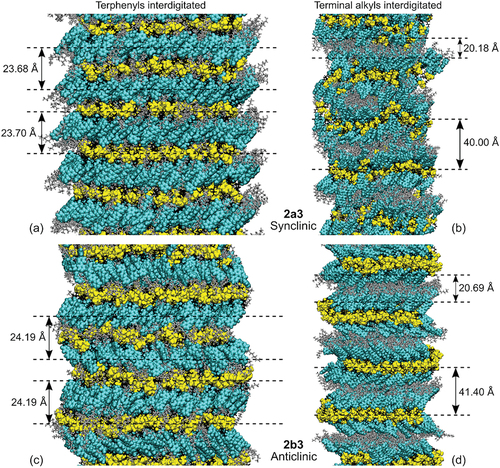
The pre-formed phases of 2a3 and 2b3 were simulated with two different levels of initial interdigitation, which we found were then essentially retained during the respective simulations, and as illustrated by the snapshots shown in . In one type of simulation only the terminal alkyl chains were interdigitated, as shown in the right column of . In the other type of simulation, the terphenyls were interdigitated, as shown in the left column of . These two types of interdigitated phases were found to be stable in the simulations of both synclinic and anticlinic phases of 2a3 and 2b3. shows frames from the simulations that match the respective phases found experimentally, namely synclinic smectic C for 2a3 and anticlinic smectic C for 2b3, and it is these simulations that we discuss in detail below.
Figure 15. (Colour online) Snapshots taken from the MD simulations of synclinic 2a3 at 363 K (a and b) and anticlinic 2b3 at 359 K (c and d) with terphenyls interdigitated (a and c) and only terminal alkyl chains interdigitated (b and d), and showing approximately five selected layers from the centres of the full simulation boxes. Siloxane moieties are shown in yellow, terphenyls in cyan, terminal alkyl chains in grey, and internal alkyl chains in black. The layer spacings shown are for illustration, with the d values having been determined from a full analysis when calculating the respective τ values, and as listed in .
lists two different types of positional order parameter and associated layer spacing that were obtained by analysing these simulations, and the layer spacings are also illustrated in . One analysis used the central atom of the siloxane (O for 2a3; Si for 2b3) to determine the positional order parameter, τs, and associated layer spacing, ds, based on the siloxane group. The other analysis used the centre of the middle ring of each of the two terphenyls in each molecule to determine a positional order parameter, τt, and associated layer spacing, dt, based on the terphenyl group. In all the analyses, the orientation of the layers was defined by the layer normal obtained from the siloxane group analysis, which provided a consistent definition based on the most ordered type of layer across all the simulations that were run.
Table 2. Values of positional order parameters (τs and τt) and layer spacings (ds and dt) determined from the MD simulations and averaged over the final 100 ns.
For the simulations where the terphenyls were interdigitated, the system comprised alternating, well-defined siloxane and terphenyl layers, as shown by the high values of τs and τt (), and with a partial interface comprising both terminal and internal alkyl chains between them, as shown in (left column). The layer spacing determined from either the siloxane groups or the terphenyl groups is, essentially, the same within each simulation, and is ca. 23.7 Å for 2a3 and ca. 24.2 Å for 2b3, with that for 2b3 being slightly larger than that for 2a3. The terphenyl layers of 2a3 and 2b3 were found to have a tilt angle of ca. 45° relative to the layer normal vector, with no alternation in the tilt direction for the synclinic phase of 2a3 and the tilt alternating either side of the layer normal for most alternate layers in the anticlinic phase of 2b3.
For the simulations where only the terminal alkyl chains were interdigitated, the layer structure again comprised siloxane layers, but in this case with two partially distinct layers of terphenyls between each siloxane layer, with a terminal alkyl layer between these two terphenyl layers, and with a partial alkyl interface comprising mainly internal alkyl groups between the siloxane and terphenyl layers, as shown in ) (right column). As a result, each of these simulated systems has two distinct layer spacings, namely a siloxane layer spacing that is ca. 40.0 Å for 2a3 and ca. 41.4 Å for 2b3, and a terphenyl layer spacing that is approximately half the respective size, at ca. 20.2 Å for 2a3 and ca. 20.7 Å for 2b3. The terphenyl groups were tilted at ca. 30 − 50° to the layer normal for most layers of 2a3, and there was no alternation in the tilt direction in this synclinic phase. For 2b3, the two terphenyl layers between each siloxane layer tilted in the same direction, at ca. 55° to the layer normal, with the angle direction for these pairs alternating left and right either side of a siloxane layer for this anticlinic phase structure.
A comparison between the simulations with the two types of interdigitation indicates that the siloxane groups are highly ordered in both, with a value of τs≈0.8 when the terphenyls are interdigitated and τs≈0.6–0.8 when only the terminal alkyls are interdigitated. By contrast, the terphenyl groups are highly ordered when the terphenyls are interdigitated, with τt≈0.8, but are significantly less ordered when only the terminal alkyls are interdigitated, with τt≈0.3–0.6. Hence, these simulations have well-ordered layers throughout the phase when the terphenyls are interdigitated, but significantly less ordering, specifically in the alkyl-terphenyl layers, when only the terminal alkyl groups are interdigitated.
The simulations with the terphenyls interdigitated give a layer spacing that is essentially the same when based on either the siloxane group or the terphenyl group, and the values of ca. 23.7 and 24.2 Å for 2a3 and 2b3, respectively, are reasonable matches for the experimental X-ray diffraction values of ca. 26.4 and 27.5 Å. In contrast, the simulations with only the terminal alkyls interdigitated give two different layer spacings of ca. 40 Å for the siloxane groups and ca. 20 Å for the terphenyl groups, neither of which are a good match for the experimental values.
In principle, the simulations with only the terminal alkyls interdigitated may result in two types of adjacent terphenyl layer spacing, one between the two terphenyl layers within the same inter-siloxane layer and the other between adjacent terphenyl layers in different inter-siloxane layers; and two slightly different layer spacings might also contribute partly to the lower positional order parameters based on the terphenyl groups, τt. In practice, the analysis suggested that these types of terphenyl layer spacing have comparable values, as can also be seen illustratively from the frames shown in (right column).
The simulations with the terphenyls interdigitated gave a terphenyl tilt angle of ca. 45° versus the siloxane layer normal for 2a3, which is a good match for that of ca. 45° from the experimental electrooptic studies, and a simulated terphenyl tilt angle of 45° for 2b3 that is plausible although an equivalent experimental value is not available for comparison. The simulations with the two different types of interdigitation gave broadly similar values for these tilt angles.
Taken together, the information from the MD simulations suggests that the more plausible phase structures are those with the terphenyls interdigitated, as shown in and .
Microscopic defect textures
It appears that mesomorphic properties of the bimesogens are effectively delineated via advanced experiments and MD simulations, and the classifications of the phases and their structures appear appropriate, i.e., synclinic and anticlinic and interdigitated. We now turn to studies made, via thermal polarised light microscopy (POM), at the transitions to the mesophases from the isotropic liquids. These transitions and associated defect textures do not appear to be typical for the classifications that were made on the bulk mesophases. Paramorphotic phase behaviour appeared to occur at the transitions, as discussed here in more detail.
For the synclinic phases, we should see focal-conic and schlieren defect textures (with s = ±1 defects), and for the anticlinic phases focal-conic and schlieren defect textures (with s = ±1/2 and s = ±3/2 dispirations [Citation31,Citation32]). However, it appears that focal-conic defects are suppressed, but schlieren textures are present, and new filament and zigzag defects appear, which are not seen for synclinic, anticlinic, SmC*or SmCA* phases or tilted hexatic phases.
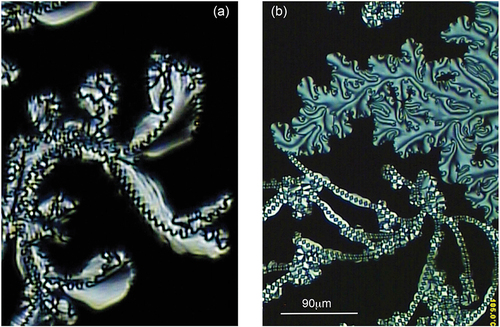
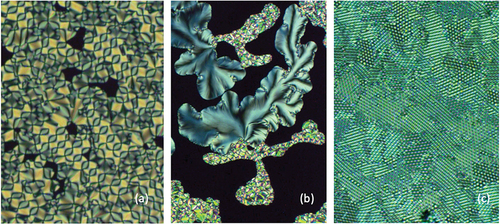
For the bimesogens, the 2a and 2b series exhibit transitions to their respective mesophases directly from the isotropic liquid, and therefore the textures observed do not possess paramorphosis from any preceding phase upon cooling. Therefore, the defect textures that are observed are the natural ones for both phases. The textures we observe are shown together in . shows the texture produced from POM with crossed polars at a magnification of x125. The preparation shows no focal-conic or schlieren defects. Instead, there is a growth that might be associated with focal-conics, but instead it is crossed with wave-like defect lines, which are likely to be as a result of a helical structure. For again there appears to be no focal-conic defects in the specimen, however, there appears to be a schlieren texture and a novel filament-like texture patterned with rectangles along the filamentary axis.
Figure 16. (Colour online) Defect textures formed on cooling from the isotropic liquid for bimesogens 2a3 (a) and 2b3 (b).
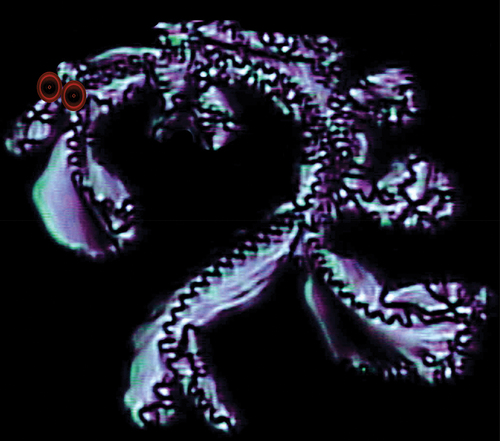
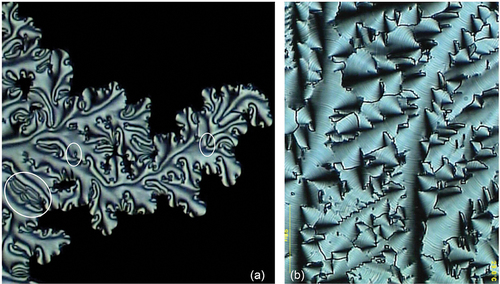
Closer examination of the schlieren texture of bimesogen 2b3 in , shows circled mixed s = 3/2 dispirations (left), s = 1/2 (middle), and s = 1 (right) singularities. This combination of defects in a schlieren texture is indicative of the mesophase being anticlinic in structure, but because of the filamentary texture shown in , the mesophase may not be SmCA*. Additionally, bimesogen 2b8 forms another type of texture as shown in . This texture may be focal-conic, but there is no evidence of elliptical and/or hyperbolic lines of optical discontinuity being present. This may be an effect produced via the formation of a paramorphotic texture on cooling from the synclinic phase. In the photomicrograph in 17(b) one can also observe curved parallel lines, which are probably associated with the helical periodicity of an anticlinic phase. The faint lines across the fan, however, are not visible at higher temperatures, when the compound is in its synclinic, ferroelectric phase, possibly because the pitch is too short for them to be visible. The formation of the lines serves to point out the change in the tilt direction from a ferroelectric to an antiferroelectric structure. Furthermore, initial observations from X-ray diffraction indicate that the molecules align perpendicular to the magnetic field indicating that the bimesogen has a negative diamagnetic susceptibility. Under normal circumstances for smectic materials, the molecules tend to align parallel to the magnetic field. This alignment therefore might be related to the formation of the helical ordering of the tilt of the molecules.
Figure 17. (Colour online) Defect textures exhibited by bimesogen 2b3 and 2b8. (a) Shows the schlieren texture of 2b3 where the defects in the left circle are possibly mixed disperations of s = 3/2, the centre circle possesses a s = ½ disperation, and the right circle a s = 1 singularity (x125). (b) a conical defect texture of 2b8 in the anticlinic phase showing parallel pitch lines, which are linked to a helical structure (x125).
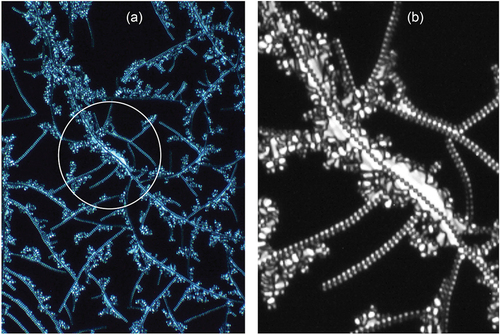
If we now examine the formation of the defect textures of bimesogen 2b3 on cooling from the isotropic liquid we can see the growth of filaments, as shown in ). shows the texture at a magnification of (x125), whereas shows a black/white blow-up of the central region of (a). The nucleating filaments appear to be helical in structure. However, they are not independent or coalesce together, instead they nucleate the growing textural form as shown diagonally (left top to bottom right) across the black/white photomicrograph. The centre line down this section appears to have dark rectangles linked together to form the filamentary axis. However, the rectangular domains are probably zigzag lines seen at different depths of the picture indicating that the structure has a double helix. If this is the case, then for the bimesogen 2a3 the wave-like lines in the synclinic phase are single helices.
Figure 18. (Colour online) (a) Growth of the filaments of bimesogen 2b3 as they form from the isotropic liquid (x125), (b) a black/white blow-up of the central region of (a), showing growth around the central axis of a filament.
Expansion of the texture in and inversion of the colours and transformation to black/white gave two images shown in ), where (b) is again an expansion of (a). One has to be careful about reading too much into these two images, but they provide for some contrast along the filamentary axis. It appears that the rectangles may be made up of two offset zigzag lines, with one towards the back of the filaments and the other towards the front. The result is that the zigzag lines are formed by a double helical structure. For the zigzag lines at the front of the filaments are relatively clear in the longer filaments, and in the expansion in figure (b) the z-line has been drawn to exemplify the situation and also to give contrast to the lighter lines towards the back. If these hypotheses are correct, the synclinic phase has a single helix as shown by the single zigzag defect line, whereas the anticlinic phase has a double helix with two zigzag lines, one to the rear and the other to the front. The lines are off-set along the filament axis by one-half a step such that a diamond pattern is formed.
Figure 19. (Colour online) (a) A colour inverted and black/white expansion of . (b) An expansion of the central filament in . The black lines are to emphasise the dark lines along the centre of the filament.
Turning now to textures formed by the dimers that exhibit the chiral smectic C* phase. The defects formed again occur through filaments, but then they coalesce to give domains of looped dark lines, which are possibly linked to single helices wrapped around heliaxes producing elliptical-like disclinations of optical discontinuity, as shown in for compound 2a3. The lines change relatively smoothly unlike those produced by anticlinic phases, indicating that the synclinic phase has a more fluid nature than that of the anticlinic phase. In addition to the looped texture, the synclinic phase also exhibits a schlieren texture as shown in , which is similar to textures exhibited by the monomeric starting materials, 1. Again, these textures are not classical for the chiral smectic C* phase, but they indicate that the phase has a relatively low viscosity and that there is a reasonable degree of periodic disorder in the phase. However, the photomicrograph shown in indicates that there is a degree of periodic hexagonal ordering in the phase, as well as parallel ordering. The parallel arrangements may be due to parallel alignment of the filaments, whereas the hexagonal periodic defects could arise from overlapping sets of tilted filaments located at different depths in the preparation (set in different planes), which when superimposed look like a hexagonal array of bright and dark defects. These results from optical microscopy seem to indicate that there are filaments present and that they may be similar to those found for twist grain boundary and/or twist bend nematic phases.
Figure 20. (Colour online) (a) Looped defect texture of dimer 2a3 at 78 °C, (b) schlieren and looped texture shown together for 2a3, and (c) the hexagonal periodic defect texture of 2a3, all at x100 magnification.
The unusual growth of the filaments for the synclinic and anticlinic phases therefore appears to be spiral, and if we examine similar textures for other mesophases we find that the B7 phase of bent core materials also exhibits a spiralling texture [Citation32]. This texture is due to the molecules having relatively rigid structures about the centre of the molecular architectures. When packing together, the mesophase can possess in-plane modulations determined by the directional packing of the V-shaped molecules in parallel versus antiparallel arrangements. In this case, the polarity at the apex of the bent core is required to be quite strong in order to induce the modulation where the directions of the polarities alternate. Consequently, the strengths of the lateral polar groups are important for compounds to exhibit the B7 phase. However, there are two distractions to this argument for bimesogens, one is that both the synclinic and anticlinic phases would need to have bent molecular architectures, which is not necessarily the case, and secondly bimesogens are flexible at the centre and are not particularly polar. These arguments would therefore discount the phases being B7 [Citation33].
This leaves the synclinic and anticlinic phases being potentially related to twist bend phases. We know that both phases are tilted, chiral and have an in-plane disorganisation of the molecular dimers indicating that they are subgroups of the chiral smectic C phase [Citation34]. We also know that bent-shaped dimers and oligomers [Citation35,Citation36] readily form nematic twist bend phases, which exhibit spiralling defects of opposing hands, and in some cases exhibit double helices [Citation37]. Spiralling defect textures are also found for the two new phases, as shown in ), and like the NTB phase they too are incorporated within the main texture. Under certain circumstances, the twist bend nematic phase can be exhibited in mixtures where one of the compounds is chiral [Citation38]. The comparisons and similarities of the arguments above indicate that the synclinic and anticlinic phases of the bimesogens are potentially twist bend variants of chiral smectic C phases and therefore could be labelled SmC*TB and SmCA*TB respectively.
By expanding our search for other systems that exhibit spiral filaments for chiral mesogens at transitions from the liquid to liquid-crystal phases, we could consider the formation of the twist grain boundary (TGB) phases for materials such as (R)- and (S)-enantiomers of 1-methylheptyl 4 -(4-n-tetradecyloxyphenylpropioloyloxy)-biphenyl-4-carboxylates. These phases were also discovered for many other low molar mass chiral derivatives of S- and R-2-octanol, where filamentary defect textures were seen at transitions from the liquid to TGBA phases [Citation39,Citation40]. Subsequently, similar filamentary defects were found at transitions to the commensurate and incommensurate synclinic (TGBC) and anticlinic (TGBCA) [Citation41] twist grain boundary phases [Citation41–44]. Although filamentary, the defect textures of the TGB phases do not usually exhibit periodic lines perpendicular to their heliaxes as theorised by Gilli and Kamay [Citation45]. The structures for the various TGB phases have been reported in detail [Citation46] to possess lattices of screw dislocations. As we approach the cores of the screw defects in these phases, it is possible for the mesophase structure to change from, say, being an orthogonal arrangement of the molecules to being tilted [Citation47]. In doing so, as we move away from the cores of the defects the texture changes to being normal, and the filaments become embedded within the overall specimen. This is similar to the textures seen for the bimesogens. Therefore, in the case of the bimesogens there is also the possibility of the phases being analogues of the twist-bend and TGB phases or a combination of the both, and a lattice of defects may be observed as shown in .
Concluding remarks
The compilation of results on the synthesised 2a and 2b families of bimesogens infers that the phases exhibited by the compounds are smectic C in type with synclinic and/or anticlinic orientations of the molecules relative to the layer planes. As the materials are chiral, they exhibit ferroelectric and/or antiferroelectric properties. Structural studies using X-ray diffraction and electrooptic responses to applied electric fields, coupled with molecular dynamics simulations, indicate that there is a preference for the molecules in the mesophase structures to be intercalated. The presence of silyloxy-linked groups and relatively rigid aromatic terphenyl units cause microphase segregation, thereby supporting a lamellar organisation.
Polarised light microscopy somewhat contradicted the overall conclusions, in that unique filamentary defect textures were found that occurred at transitions from the liquid to the liquid crystal phases. The defect textures that were exhibited at the phase transitions were filamentary at micron length-scales, possessing either helical or double helical structures. The defect textures were unusual and had not been observed before for either of the synclinic or anticlinic phases. No extra transitions were observed at the clearing points, which indicated that the filamentary phase was the same as the liquid crystal phase that it was transferring to, thus the observations were transient, with the filamentary defects becoming included in the bulk textures of the resulting bulk phases.
There are few phases that exhibit filamentary defect textures at transitions from the liquid into the mesophases, two sets that have been extensively explored are the twist grain boundary phases (TGB), and the twist-bend phases (T-B). Both have filaments, but with different textures and stabilities. The TGB phases have filaments that curve and become adsorbed into the bulk textures on cooling, whereas the T-B phases exhibit single and double helical filaments [Citation37]. The TGB family of phases also exhibited phase transitions from TGBC to smectic C etc., and so these materials did not fit with the observations made on the bimesogens.
This leaves the twist-bend family. There are few smectic twist-bend phases, and there are even fewer chiral analogues, but as we have observed helical filaments embedded in the textures of achiral twist-bend phases [Citation47] it appears that the twist-bend structuring is a possibility for chiral variants. We note that Imrie and Gorecka et al. have previously reported in their studies on twist bend phases beautiful results on heliconical smectic phases formed by achiral molecules [Citation48], and Vij and Tschierske have described their physical studies on heliconical smectic SmCSPFhel phase in achiral bent-core mesogens [Citation49]. Most notably, however, is the similarity between the lattice textures shown in , and those reported by Walker et al. [Citation50] for the chiral N* to twist bend N* sequence. Magnification of the patterns shows that there are small differences in textural orientations within the hexagonal domains and between grain boundaries, possibly due to different tilt domains, in , whereas they are less prevalent, as might be expected, for the nematic variant as reported by Walker. Nevertheless, both textures appear to indicate that the lattice patterns may be associated with long-range ordering in twist bend systems.
Time will tell if all of these discoveries will meld together to yield a fuller understanding of such systems in liquid crystals, along with a realisation that twist bend mesophases are separate and definable entities with their own classifications with respect to conventional liquid crystals.
Supplemental Material
Download PDF (8.3 MB)Supplemental Material
Download MS Word (41.7 KB)Supplemental data
Supplemental data for this article can be accessed online at https://doi.org/10.1080/02678292.2023.2196541.
Disclosure statement
No potential conflict of interest was reported by the author(s).
Correction Statement
This article has been corrected with minor changes. These changes do not impact the academic content of the article.
Additional information
Funding
References
- Nishiyama I, Yamamoto J, Yokoyama H, et al. Antiferroelectric siloxane twin liquid crystal. Trans Mats Res Soc Jpn. 2004;29:785–788.
- Saez IM, Goodby JW. Supermolecular liquid crystals. In: Mingos DMP, Kato T, editors. Liquid crystalline functional assemblies and their supramolecular structures, structure and bonding. Vol. 128, Berlin Heidelberg: Springer-Verlag; 2008. p. 1–62.
- Sia S. Molecular crowding and microphase segregation in supermolecular liquid crystals [ PhD Thesis]. University of Hull; 2004.
- Goodby JW, Saez IM, Cowling SJ, et al. Molecular complexity and the control of self-organising processes. Liq Cryst. 2009;36(6–7):567–605.
- Goodby JW. Twisted and frustrated states of matter. Proc R Soc A. 2012;468(2142):1521–1542.
- Lewis LN. Metal colloid morphology and catalytic activity - further proof of the intermediacy of colloids in the platinum-catalyzed hydrosilylation reaction. J Am Chem Soc. 1990;112:5998–6004.
- Moran M, Casado CM, Cuadrado J, et al. Ferrocenyl substituted octakis(dimethylsiloxy)octasilsesquioxanes - a new class of supramolecular organometallic compounds. Synthesis, characterization, and electrochemistry. Organometallics. 1993;12(11):4327–4333.
- Karstedt BD. General electrics. US-PS 3.814.730. 1974.
- Goodby JW. Phase transitions: general and fundamental aspects. In: Goodby JW, Collings PJ, Kato T, Tschierske C, Gleeson HF, Raynes P, editors. Handbook of liquid crystals. Vol. 1, Weinheim: Wiley-VCH; 2014. p. 59–76.
- Robinson WK, Carboni C, Kloess P, et al. Ferroelectric and antiferroelectric low molar mass organosiloxane liquid crystals. Liq Cryst. 1998;25(3):301–307.
- Perkins SP, Shoosmith DE, Coles HJ. Novel room temperature fluorinated ferroelectric organosiloxane liquid crystal mixtures. Mol Cryst Liq Cryst. 2001;364(1):943–950.
- Noot C, Perkins SP, Coles HJ. Tilt angle measurement of low molar mass organosiloxane liquid crystals. Ferroelectrics. 2000;244(1):631–638.
- Kloess P, McComb J, Coles HJ. Synthesis and properties of a new series of low molar mass organosiloxane derivatives. Ferroelectrics. 1996;180(1):233–243.
- Mehl GH, Goodby JW. Substituted siloxysilanes and the structure of oligomeric liquid crystals. Chem Commun. 1999;1:13–14.
- Ibn-Elhaj M, Skoulios A, Guillon D, et al. Structural characterization of linear dimeric and cyclic tetrameric liquid-crystalline siloxane derivatives. Liq Cryst. 1995;19(3):373–378.
- Lehmann P, Robinson WK, Coles HJ. Bi-mesogenic fluorinated organosiloxanes: synthesis and mesomorphic properties of a novel type of ferro- and antiferroelectric liquid crystal. Mol Cryst Liq Cryst. 1999;328(1):221–228.
- Robinson WK, Kloess PS, Carboni C, et al. Bi-mesogenic organosiloxane liquid crystal materials exhibiting antiferroelectric phases. Liq Cryst. 1997;23(2):309–312.
- Kaeding A, Zugenmaier P. Investigations of a homologous series of chiral siloxane based dimesogenic compounds. Liq Cryst. 1998;25(4):449–457.
- Wischerhoff E, Zentel R. Dimesogenic liquid-crystalline oligosiloxanes. Liq Cryst. 1995;18(5):745–749.
- Díaz AF, Valdebenito MN, Tagle LH. Synthesis and characterization of twin mesogens containing siloxane units as central spacers. Liq Cryst. 1994;16(1):105–113.
- Racles C, Cozan V. Siloxane-containing thermotropic liquid crystals based on new azomethine dimesogens. High Perform Polym. 2002;14(2):169–181.
- Hardouin F, Richard H, Achard MF. Analogy between liquid-crystal side-chain polysiloxanes and liquid-crystal twins with siloxane spacers. Liq Cryst. 1993;14(4):971–979.
- Ganicz T, Stańczyk WA, Białecka-Florjańczyk E, et al. Liquid crystal dimers with organosilicon spacers as models for side chain LC polymers. Polymer. 1999;40(17):4733–4739.
- Guillon P, Osipov MA, Méry S, et al. Synclinic-anticlinic phase transition in tilted organosiloxane liquid crystals. J Mater Chem. 2001;11(11):2700–2708.
- Bartolino R, Doucet J, Durand G. Molecular tilt in the smectic C phase: a zigzag model. Ann Phys. 1978;3:389–395.
- Martinot-Lagarde PH, Duke R, Durand G. Temperature-dependence of tilt, pitch and polarization in ferroelectric liquid-crystals. Mol Cryst Liq Cryst. 1981;75(1):249–286.
- Goodby JW, Chin E, Leslie TM, et al. Helical twist sense and spontaneous polarization direction in ferroelectric smectic liquid crystals 1. J Am Chem Soc. 1986;108(16):4729–4735.
- Tschierske C. Micro-segregation, molecular shape and molecular topology partners for the design of liquid crystalline materials with complex mesophase morphologies. J Mater Chem. 2001;11(11):2647–2671.
- Mandle RJ, Abbott LC, Fritsch L, et al. Engineering mesophase stability and structure via incorporation of cyclic terminal groups. J Mater Chem C. 2022;10(15):5934–5943.
- Eremin A, Diele S, Pelzl G, et al. Polymorphic smectic a phases in perfluoroalkylated mesogenic dimers. Liq Cryst. 2001;28(10):1451.
- Takanishi Y, Takezoe H, Fukuda A, et al. Simple method for confirming the antiferroelectric structure of smectic liquid-crystals. J Mater Chem. 1992;2(1):71–73.
- Slaney AJ, Takatoh K, Goodby JW. Defect textures in liquid crystals. In: Elston S Sambles J, editors. The optics of thermotropic liquid crystals. London: Taylor and Francis; 1998. p. 307–372.
- Coleman DA, Fernsler J, Chattham N, et al. Polarization-modulated liquid crystal phases. Science. 2003;301(5637):1204–1211.
- Collings PJ, Goodby JW. Introduction to liquid crystals: chemistry and physics. Florida, USA: CRC Press (T&F), Boca-Ratan; 2019. p. 53.
- Mandle RJ, Goodby JW. Progression from nano to macro science in soft matter systems: dimers to trimers and oligomers in twist bend liquid crystals. RSC Adv. 2016;6(41):34885–34893.
- Mandle RJ, Stevens MP, Goodby JW. Developments in liquid-crystalline dimers and oligomers. Liq Cryst. 2017;44:2046–2059.
- Goodby JW, Cowling SJ, Bradbury CK, et al. Janus mesophases of matter. Liq Cryst. 2021;49(7–9):908–933.
- Archbold CT, Davis EJ, Mandle RJ, et al. Chiral dopants and the twist-bend nematic phase – induction of novel mesomorphic behaviour in an apolar bimesogen. Soft Matter. 2015;11(38):7547–7557.
- Goodby JW, Waugh MA, Stein SM, et al. Characterization of a new helical smectic liquid crystal. Nature. 1989;337(6206):449–452.
- Goodby JW. Twist Grain Boundary (TGB) phases. In: Mingos D, editor. Structure and bonding - liquid crystals II. Vol. 95, Berlin Heidelberg: Springer, Verlag; 1999. p. 83–147.
- Navailles L, Pindak R, Barois P, et al. Structural study of the smectic-C twist grain boundary phase. Phys Rev Lett. 1995;74(26):5224.
- Isaert N, Navailles L, Barois P, et al. Optical evidence of the layered array of grain boundaries in TGBA and TGBC mesophases. J Phys II France. 1994;4(9):1501–1518.
- Petit M, Barois P, Nguyen HT. Structural study of the smectic-C twist grain boundary phase (TGBC) under external electric field. J Phys II (Paris). 1996;36(3):185–190.
- Meier JG, Nobili M, Carlsson T, et al. Possible model of an antiferroelectric twist grain boundary phase. Phys Rev E. 2007;76(1):011704.
- Gilli JM, Kamayé M. Smectic A–cholesteric transition in a side chain cooligomer–ce1 blend. A particular confined geometry for the TGB phase? Liq Cryst. 1992;12(4):545–560.
- Renn SR, Lubensky TC. Abrikosov dislocation lattice in a model of the cholesteric to smectic a transition. Phys Rev A. 1988;38(4):2132–2147.
- Goodby JW, Cowling SJ, Görtz V. Competition, resolution, and rotational motion in frustrated liquid crystals, comptes rend. Chimie. 2009;12(1–2):70–84.
- Abberley JP, Killah R, Walker R, et al. Heliconical smectic phases formed by achiral molecules. Nature Commun. 2018;9(1):228.
- Vij JK, Panarin YP, Sreenilayam SP, et al. Investigation of the heliconical smectic SmCSPFhel phase in achiral bent-core mesogens derived from 4-cyanoresorcinol. Phys Rev Mater. 2019;3(4):045603.
- Walker R, Pociecha D, Storey JMD, et al. The chiral twist-bend nematic phase (N*TB). Chem Eur J. 2019;25(58):13329–13335.