
ABSTRACT
Background
The aim of the present study was to investigate the associations stroke severity, aphasia severity, lesion location and lesion size in acute stroke, and aphasia severity in the subacute and chronic stages post stroke. We hypothesized that initial stroke severity and aphasia severity were associated with the patient’s aphasia severity in the subacute and chronic stages of stroke. We expected to find that lesions within the left frontotemporal regions of the brain were associated with aphasia severity post-stroke.
Methods
Thirty-three patients with aphasia were included in the study. They were assessed with a standardized aphasia test at admission to the hospital (T1), after 3 months (T2) and finally after 12 months (T3). Stroke severity, initial physical impairment, and initial functional independence were also assessed at T1. Diffusion-weighted magnetic resonance imaging was performed as clinical-routine at admission. Voxel-based lesion symptom mapping and a region of interest analysis (ROI) was performed to analyze MRI-findings.
Results & Outcomes
Initial lesion size and aphasia severity were associated with aphasia severity at T2. Initial stroke severity, aphasia severity, and lesion size were not associated with aphasia severity at T3, but the patients’ aphasia severity at T2 predicted aphasia severity at T3. Lesion analysis showed that lesions within the left postcentral gyrus and the left inferior parietal gyrus were significantly associated with aphasia severity at T3. The ROI-analysis did not yield any significant regions of interest to explain the total variance of the patients’ change in scores on the aphasia test from T1 to T3.
Conclusion
Lesions within the postcentral gyrus and the inferior parietal gyrus are associated with aphasia severity at T3. Lesion size in the acute stages of stroke is associated with aphasia severity at T1 and T2, but not T3. However, neither initial aphasia severity nor stroke severity was associated with aphasia severity at T3. Aphasia severity in T2 is however strongly associated with aphasia severity in T3.
Introduction
It is estimated that approximately 24% of all stroke patients will experience aphasia post-stroke (Gronberg et al., Citation2020). The long-term prognosis of aphasia is influenced by a range of factors. There is no clear consensus on what the most important predictors of post-stroke aphasia are, and there is great variability in the factors that are found to be associated with aphasia recovery (Forkel et al., Citation2014; El Hachioui et al., Citation2013; Plowman et al., Citation2012; Price et al., Citation2010). Knowledge about the course of aphasia recovery and understanding the variables associated with aphasia recovery is an important topic for patients, caregivers, health care providers and an important question for researchers within the field of aphasia.
There is no clear consensus on the definition of acute, subacute, and chronic stroke. However, Wittler (Citation2009) suggests that the functional recovery of aphasia can be divided into three stages based on the underlying neural mechanisms taking place post stroke. The acute stage is the first month post stroke (4–6 weeks), the subacute stage continues for weeks or months after the stroke (1–12 months), and finally, the chronic stage of recovery is defined from 12 months post onset (Wittler, Citation2009).
Predictors of aphasia severity
A vast number of studies have investigated possible predictors of aphasia post-stroke, such as lesion size, lesion location, initial stroke, and aphasia severity (Ali et al., Citation2021; Benghanem et al., Citation2019; Forkel & Catani, Citation2018; Forkel et al., Citation2014; El Hachioui et al., Citation2013; Pedersen et al., Citation2004; Plowman et al., Citation2012; Watila & Balarabe, Citation2015). Clearly, aphasia recovery must be considered a complex course influenced by a multitude of variables, and an interaction between these variables.
Initial stroke and aphasia severity
There is a broad consensus that initial aphasia severity is a predictor of aphasia outcome post-stroke (El Hachioui et al., Citation2013; Laska et al., Citation2001; Lazar et al., Citation2010; Pedersen et al., Citation2004). Other variables, such as age, education, and other patient-related factors are more debated in the research literature (Plowman et al., Citation2012; Watila & Balarabe, Citation2015). In a literature review by Plowman et al. (Citation2012), the authors investigated factors associated with the long-term prognosis of post-stroke aphasia. They reported that initial stroke and aphasia severity, lesion site, and lesion size were found to be the most influential variables in aphasia recovery. More specifically, initial aphasia severity was found to be the most predictive variable of post-stroke aphasia. In a recent systematic review and meta-analysis of aphasia recovery, Ali et al. (Citation2021) (The Rehabilitation and recovery of people with Aphasia after StrokE Collaborators – RELEASE) investigated individual participant data in a large dataset including overall language ability, auditory comprehension, naming, and functional communication. The study showed that improvements in language scores from baseline assessments diminished with patients increasing age and aphasia chronicity. A greater change in all the language datasets was seen in younger patients (˂55 years). Further, Ali et al. (Citation2021) reported that enrollment within 1 month post stroke was associated with greater change in overall-language ability. Also, the findings from the study shows that earlier language intervention was associated with the greatest improvement across language domains.
Lesion size and lesion location
Several studies have investigated the role of lesion size and lesion location in aphasia recovery (Benghanem et al., Citation2019; Forkel & Catani, Citation2018; Hillis et al., Citation2018; Lazar et al., Citation2010; Plowman et al., Citation2012; Seghier et al., Citation2016; Sul et al., Citation2019; Thye & Mirman, Citation2018; Watila & Balarabe, Citation2015). Benghanem et al. (Citation2019) investigated aphasia outcome in the subacute stages of aphasia three months post stroke. The authors found that in patients with severe aphasia at admission, lesion size, or critical damage to the left temporoparietal junction was associated with poor language outcome at three months post stroke. Forkel et al. (Citation2014) investigated the anatomical predictors of aphasia recovery six months post-stroke by performing tractography in both hemispheres. The authors found that the volume of the long segment of the arcuate fasciculus in the right hemisphere (contralateral to the lesion) was a predictor of aphasia recovery. They hypothesize that a larger right long segment might facilitate direct communication between the right hemisphere homologues of Broca’s and Wernicke’s area. Further, Forkel et al. (Citation2014) did not find the volume of other segments in either the right or left hemisphere to be significant factors in aphasia recovery. In their study the strongest predictor of aphasia recovery six months post-stroke was lesion size. Other factors such as age and sex were also found to be predictive of aphasia recovery, with lower age and female sex being good predictors of recovery. The findings of Forkel et al. (Citation2014) results suggest that the right hemisphere language network also plays an important role in the functional compensation of aphasia recovery after left hemispheric stroke.
The PLORAS database (Predicting Language Outcome and Recovery after Stroke) has generated several studies aiming to predict aphasia recovery based on brain scans (Price et al., Citation2010; Seghier et al., Citation2016). In their literature review Price et al. (Citation2010) reported on language functions that were impaired after damage to specific brain regions. The authors found that auditory speech comprehension deficits were strongly associated with lesions within the left posterior superior temporal and/or left middle temporal regions (Wernickes’ area). Further, non-fluent speech production was found to be associated with damage to the left inferior and/or middle frontal gyri and underlying white matter.
Thye and Mirman (Citation2018) investigated the relative predictive role of lesion size and lesion location. Their results showed that speech production and speech recognition deficits could be predicted by lesion size and lesion location. Further, aphasia severity and naming deficits were predicted by lesion size, but not lesion location. Based on their findings, Thye and Mirman (Citation2018) suggested that lesion-symptom prediction is more suitable for deficits that have specific neural localizations than for broad functional deficits which were found to be better predicted by overall lesion size. Lazar et al. (Citation2010) investigated variables that were predictive of aphasia recovery three months post stroke. In their study they found initial impairment to be predictive of aphasia recovery at three months, but lesion size was not found to be predictive of aphasia recovery.
Sul et al. (Citation2019) investigated the relationship between lesion location and recovery of fluency, comprehension, naming, and repetition in patients with aphasia one-year post stroke. The authors found that specific lesion locations were associated with long-term outcomes for the different language measures. Further, the authors reported that lesions within the Rolandic cortex, Heschl’s gyrus, posterior corona radiata, supramarginal cortex, superior longitudinal fasciculus, superior temporal gyrus, and insula were associated with overall poor language outcomes (Sul et al., Citation2019). Hillis et al. (Citation2018) found that lesion load in the posterior parts of the left superior temporal gyrus, and the superior longitudinal fasciculus/arcuate fasciculus in the acute stages post stroke predicted difficulties in naming performance six months post stroke. In addition, their findings showed that patients that used selective serotonin reuptake inhibitors (SSRI) the following three months post stroke had greater improvements in naming. The use of SSRIs in stroke recovery is an ongoing investigation, and studies have shown promising effects on the functional recovery in non-depressive patients the first three months post stroke (Chollet et al., Citation2018), and improvements in naming outcome in patients with aphasia three months post stroke (Hillis et al., Citation2018). However, a more recent randomized, double-blind, placebo-controlled trial by Lundström et al. (Citation2020) showed that functional outcome after stroke did not improve with the intake of fluoxetine 20 mg daily for six months.
Baldo et al. (Citation2006) investigated the role of frontal versus temporal cortex in verbal fluency using voxel-based lesion symptom mapping (VLSM) in patients with chronic aphasia (at least nine months post-stroke). The authors found that reduced letter fluency was associated with damage to anterior regions (left frontal cortex), while reduced category fluency was associated with lesions in more posterior regions (left temporal cortex). However, as their findings suggest, fluency tasks also are affected by lesions within the insula, putamen, and the inferior parietal cortex.
Aphasia recovery
The recovery of aphasia has also been suggested to follow to specific patterns as in the principles of proportional recovery (Krakauer & Marshall, Citation2015; Marchi et al., Citation2017). The principles of proportional recovery were initially used to characterize motor recovery after stroke, suggesting that most patients recover approximately 70% of their initial impairment. However, some patients with initial severe deficits show little or no improvement (Krakauer & Marshall, Citation2015). The principles of recovery have also been debated in Hope et al. (Citation2019) where the authors argued that the empirical support for the proportional rule of recovery is weak.
Stroke is a risk factor for developing post-stroke dementia (Leys et al., Citation2005; Mijajlović et al., Citation2017; Pendlebury & Rothwell, Citation2009). It has been found to affect 30% of stroke survivors (Leys et al., Citation2005; Mijajlović et al., Citation2017). However, the mechanisms and causes underlying cognitive decline, besides the obvious tissue damage, remains unclear (Mijajlović et al., Citation2017). The most common determinants of post stroke-dementia are demographic and clinical characteristics such as increasing age, low education level, pre-stroke dependency, and pre-stroke cognitive decline (Leys et al., Citation2005; Rasquin et al., Citation2004). Studies have also shown that left hemispheric lesions and multiple stroke lesions are associated with post-stroke dementia (Zhou et al., Citation2004). Zhou et al. (Citation2004) also found that patients with aphasia were more likely to develop post-stroke dementia. Fonseca et al. (Citation2017) on the other hand states that it is not known whether aphasia enhances the risk of post-stroke dementia, but in their review, they found that patients with aphasia tend to score lower on non-verbal neurobehavioral tools assessing cognitive functions than those with left hemisphere stroke without aphasia.
Even though there is no clear consensus on all the factors that might predict and influence aphasia outcome post stroke, there seems to be a tendency in the research literature that initial stroke and aphasia severity, lesion size, and specific lesion locations are strongly associated with aphasia severity in the chronic stages post stroke. Also, it is important to point out that therapy has been found to have a substantial effect on aphasia recovery. In a Cochrane-review by Brady et al. (Citation2016) they assessed the effects of speech and language therapy for aphasia post stroke. Therapy was found to be associated with improved functional communication, reading, writing, and expressive language compared to no therapy in aphasia (Brady et al., Citation2016). Even though type and intensity of treatment are relevant for aphasia recovery we do not provide information regarding type or amount of therapy in the present study.
Assessment of aphasia
In the present study we used the Norwegian Basic Aphasia Assessment (NBAA) (Reinvang & Engvik, Citation1980) which is based on the Boston classification of aphasia to assess the patients’ aphasia symptoms. The Boston Diagnostic Aphasia Examination (Goodglass et al., Citation2001) and the NBAA (Reinvang & Engvik, Citation1980) classify patients into localization-based classifications of aphasia; Broca’s, Wernicke’s, anomic, conduction, transcortical motor, transcortical sensory, and global aphasia syndromes. This classification of aphasia is based on the Classic Model of the neurobiology of language (Geschwind, Citation1965). Even though newer classifications and theories on language processing and aphasia have emerged, the Classic Model of language neurobiology is still commonly used as a theoretical framework in aphasia assessment, and the NBAA is the most frequently used aphasia assessment in Norway (Døli et al., Citation2021; Lind & Haaland-Johansen, Citation2013).
Aim of the study
The aim of the present study was to investigate the associations between stroke severity, aphasia severity, lesion location and lesion size in acute stroke, and aphasia severity in the subacute and chronic stages of stroke. We hypothesized that initial stroke severity, aphasia severity, and lesion size in the acute stages are associated with aphasia severity in the subacute and chronic stages of aphasia post stroke. Further, we expected to find that lesions within the frontal inferior and temporal regions of the left hemisphere would be associated with aphasia severity in the subacute and chronic stages of aphasia.
Methods
Participants
The data in the study were collected through two research projects at Haukeland University Hospital (HUS). The Early Supported Discharge after Stroke in Bergen – study (ESD) (Hofstad et al., Citation2013) and the Norwegian Stroke Research Registry (NORSTROKE) (n = 3500). The patients were included in both studies at admission to the Stroke Unit at HUS. A total of 347 patients with stroke were included in the ESD-study. A total of 114 patients were referred to a speech and language therapist based on initial suspicion of aphasia. Of the 114 patients, 66 patients were confirmed to have aphasia by a speech and language therapist at the Stroke Unit. Aphasia was diagnosed based on the convergence of clinical symptoms and by assessment with the NBAA within seven days post-admission (T1). The patients were thereafter summoned for a follow-up with the NBAA after 3 (T2) and 12 months (T3). All patients underwent diffusion-weighted magnetic resonance imaging (DWI-MRI) within 24 hours post-onset of initial symptoms as clinical routine at the Stroke Unit. The present study is a follow-up study of the same patients as in Døli et al. (Citation2021).
Of the initial 66 patients with aphasia, 45 met at T2 and 33 patients attended the assessments at T3. The mean assessment time post-stroke for the T3 follow-up was 12.2 months (Min: 10.0, Max: 15.0, SD: 1.2). The present study contains all the 33 patients with aphasia after ischemic stroke that attended the T3 assessments. Of these 33 patients, 32 patients were also assessed with the NIHSS at T1, and 29 met for retesting with the NBAA at T2 and we had Siemens MRI-scans from admission available in 30 of the 33 patients. However, seven of the 30 patients were excluded from the VLSM-analysis because of unclear findings, and three patients lacked MRI-scans. The total amount of available MRI-scans was 23. See for a flow-chart over the assessments at each time point.
Figure 1. Flow-chart of participants in the study and tests performed at each time point
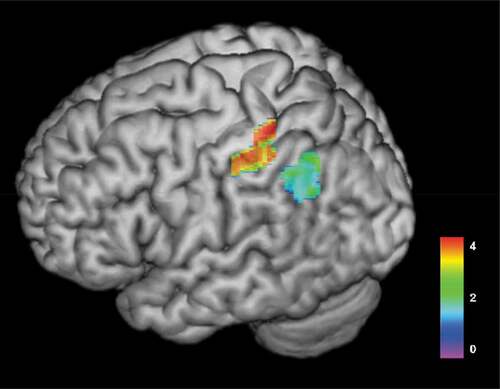
Figure 2. Colorized 3D render map of results from VLSM-analysis of associations between lesioned areas at T1 and aphasia severity at T3 (n = 23). The map illustrates that warmer areas (red) have a strong association to aphasia severity in patients with aphasia. T-test range = −1.263–4.336, FDR-corrected Z score with permutations = 3.61, p < .05. Areas significantly associated with aphasia severity at 12 months post-stroke included the postcentral gyrus (MNI = −31x-35x54, Z score = 3.681) and the inferior parietal gyrus (MNI −31x-35x44 Z score = 3.681)
Materials and procedures
The patients underwent several assessments in the acute stage in the Stroke Unit. Thereafter they were summoned for retesting three- (T2) and twelve-months (T3) post stroke. In the present study we report the patients results from the NBAA at T1, T2, and T3.
The Norwegian Basic Aphasia Assessment (NBAA)
(Reinvang & Engvik, Citation1980). The NBAA is a standardized Norwegian basic test for the assessment of aphasia. The test is based on the Boston model of aphasia (Goodglass & Kaplan, Citation1972), and consists of seven subtests measuring auditory comprehension, repetition, naming, reading comprehension, reading out loud, syntax, and writing. The overall aphasia score suggests an aphasia profile indicating both aphasia severity and aphasia type. In the present study we used their raw scores from the aphasia subtests and the overall aphasia severity score from the NBAA. The score on the NBAA ranges from 0–217 where 217 is the maximum of correct responses. In the ROI-analysis we used the patients change in scores from T1 to T3 as the predictor variable.
National Institute of Health Stroke Scale (NIHSS)
(Brott et al., Citation1989). The NIHSS is an assessment tool that measures neurological deficits common in acute stroke. The modified version (P. D. Lyden et al., Citation2001), used in the present study, consists of 11 subtests investigating level of consciousness, gaze, visual fields, facial palsy, left motor arm, right motor arm, left motor leg, right motor leg, ataxia, sensory, language, dysarthria, and neglect. Only results from the affected side (left/right) were reported in the study. The NIHSS was conducted at several time points from admission to the hospital and until seven days post-onset of symptoms or earlier if the patients were discharged. In the present study we used the NIHSS score from admission to the Stroke Unit. The score ranges from 0 to 34 points, where a higher score indicates more severe stroke symptoms.
Barthel Index (BI)
Mahoney & Barthel, (Citation1965) measure a patients’ performance in activities of daily life. The BI consists of 10 items that can be divided into self-care tasks (feeding, grooming, bathing, dressing, bowel and bladder care, and toilet use) and items related to mobility (ambulation, transfers, and stair climbing). The maximal score is 100, indicating that the patient has no difficulties in daily activities, and the lowest score is 0, indicating that the patient is dependent on constant nursing care and attention. In the present study we used the BI as a measure for functional status at seven days post stroke or at discharge (if discharged earlier).
The Modified Rankin Scale (mRS)
Rankin, (Citation1957) is a widely used global disability measure (Banks & Marotta, Citation2007) aiming to measure functional independence by incorporating the World Health Organization components of body function, activity, and participation (Kasner, Citation2006). The mRS is shown to have high validity, however the reliability of the measure is debated due to the few items (Kasner, Citation2006). The score ranges from 0–6, where 0 indicates no symptoms at all, and 6 represents the patient being dead. We used the mRS scores from day seven post stroke, or on discharge if the patient was discharged earlier.
MRI specifications
According to clinical routine at the Stroke Unit all patients were referred to diffusion-weighted magnetic resonance imaging (DWI) within 24 hours post-onset of stroke symptoms. The imaging data were collected on a Siemens 1.5 Tesla Symphony using a DWI-sequence with TR 3200 ms, TE 94 ms, field of view 230 mm, 128 × 128 matrix, in-plane voxel size 1.8 × 1.8 mm2, slice thickness 5 mm, as specification parameters.
Data pre-processing for voxel-based lesion-symptom mapping
We traced lesions manually slice-by-slice directly onto patients DWI-images in MRIcron (Rorden et al., Citation2007). Uncertain or unclear cases were excluded. Both the DWI images and the lesion maps were thereafter normalised into standard Montreal Neurological Institute (MNI) stereotactic space, using the “old normalisation” procedure of the SPM12 software. First, DWI images were normalised into the MNI space using an EPI template, as provided by SPM12. To achieve the most optimal normalisation, the transformation was based on the non-lesioned tissue by masking the individual DWI images with the respective lesion maps (Brett et al., Citation2001). Thereafter, the transformation was applied to the lesion map, and images were resampled to a voxel size of 2mm3.
Data analysis
For the VLSM data analysis we used the non-parametric mapping (NPM) software package in MRIcron (Rorden et al., Citation2007). To correct for multiple comparisons, we added the non-parametric permutation test to determine the critical t cut-off score (p < 0.05) which was based on 1,000 random permutations of the data, False Discovery Rate (FDR) control was carried out on all analyses. For statistical analysis, the lesion detection threshold was set to 5% prior to the analysis, thus meaning that tests were not run for voxels with less than 5% of the subjects having damage there. We used a general linear model (GLM) where the predictor variable was the lesion (whether a voxel was lesioned or not). The outcome variables were the patients scores from the NBAA. The colorized maps are based on the resulting t-value of each voxel. To determine anatomical structures, the Automated Anatomical Labelled map in MRIcron was used. For the power map of aphasia severity at T3 and lesions at T1 () the lesion detection threshold was set to 20% prior to the analysis, indicating that at least five persons had a damage within the voxel, and the Family wise error-correction (FWE) was carried out on the analysis. Lesion size was quantified using an in-house Matlab script that extracts the number of voxels of a lesion and estimates its volume, based on the respective voxel size.
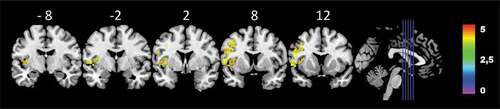
Figure 3. Colorized multi-slice power-map of the patients’ lesions at T1 and performance on the NBAA at T3 (n = 23). Warmer areas (red) indicate a greater lesion overlap than colder areas (yellow). FWE-corrected Z-score, with 1000 permutations Z = 3.33, p < .05. Only voxels tested in a minimum of 20% of patients were calculated (at least 5 persons had damage to the voxel). Color bars indicate Z-score
We carried out post-hoc ROI-analysis to explore our data further, including the insula, the IFG triangularis, IFG opercularis, and the posterior and anterior divisions of the STG. The ROIs were created using the 3D-bubble tool in MRIcron. All individual ROIs were extracted from the Harvard-Oxford-Atlas in MRICron including cortical and subcortical structures with a threshold of .25, in other words there was a 75% chance of the ROIs being grey matter only. The patients mean lesions (mm3) in each region of interest, as well as total lesion size were entered into a stepwise regression analysis to investigate associations to aphasia recovery (change in scores from T1-T3). Descriptive statistics, frequencies, t-tests, correlations, and regression analysis were calculated using IBM SPSS v25.
Results
The patient's mean score on the NBAA at T1 was 139.7 (SD: 61.4, min: 0, max: 215, n = 33), at T2 188.2 (SD: 27.8, min: 112, max: 217, n = 29) and at T3 197.2 (SD: 22.1, min: 112, max: 216, n = 33). The patients had an improvement in their aphasia score from T1, to T2 and to T3. The patient’s descriptive results from the NBAA, their scores from the mRS, the BI, the NIHSS, and mean lesion size are presented in .
Table 1. Descriptive statistics of patients scores on the NBAA at T1, at T2 and T3, mRS, Barthel, NIHSS and lesion size
A drop-out analysis was conducted to investigate whether the patients that attended the T3 follow-up differed significantly from the patients who did not attend the T3 follow-up. A Levene’s t-test for equality of means was performed investigating the patients scores on the NBAA at admission. There were no significant differences in the initial aphasia severity scores for the patients who did not attend the T3 follow-up (M = 150.7, SD = 75.3, N = 52) and the patients who attended the T3 follow-up (M = 137.8, SD = 63.4, N = 33, t (83) = −.82, p = .41, two-tailed). The magnitude of the difference in the means (mean difference = −12.95, 95% CI: −44.37–18.46) was small (Cohen’s d = .01).
Initial stroke severity and aphasia severity, lesion size, and their associations to aphasia severity at three- and twelve-months post stroke
Pearson’s correlation was performed to investigate the associations between the patients’ lesion size, age, scores from the NBAA, the mRS, the BI and the NIHSS at T1 and the patients scores on the NBAA at T2 and T3. Lesion size was significantly associated with aphasia severity at T2. However, none of the variables included in the analysis were associated with the NBAA total score at T3, except the NBAA at T2 (r = .75, p < .001).
Interestingly, only lesion size and the patients’ results from the mRS were significantly associated with the patients’ aphasia severity at admission. Further, as seen in the associations between lesion size and aphasia severity decrease throughout the time course of aphasia recovery.
Table 2. Pearson’s correlation between patients’ age, and scores on the NBAA, mRS, BI and NIHSS at T1, NBAA at T2 and NBAA at T3
Change in aphasia severity over time
A one-way repeated measures analysis ANOVA was conducted to compare the patients change in scores on the NBAA at the three time points, T1, T2, and T3. The results of the ANOVA indicated a significant effect of time, Wilks’ Lambda = .51, F(2, 27) = 13.0, p < .001, η2 = .49. We added post-hoc pairwise comparisons to investigate the differences in the patients scores on the NBAA at each time point, which showed a significant change in scores between the patients NBAA scores at T1 and T2 (Mean = −54.4, Std: 11.4, p < .001) and from T1 to T3 (Mean = −61.5, Std: 11.9, p < .001). We did not find a significant change in the patients scores from T2 to T3 (Mean: 7.1, Std: 3.4, p < .144).
To investigate the patient group further, we divided the patients into three groups based on their change in scores from the T2-assessment to the T3-assessment to see whether the groups differed in age and lesion volume. We divided the patients into three groups based on their change in scores. Group 1 (n = 9) consists of patients with a negative change in scores from T2 to T3. Group 2 (n = 11) consists of patients with minimal or no change in scores from T2 to T3 (0–10 points), and group 3 (n = 9) consists of patients with improvement in scores from 10 and above. We had missing data of lesion volume in 10 patients. With such a low n in each group we did not compare means between groups, but a descriptive presentation of group differences is provided in .
Table 3. Descriptive statistics of the patients divided into three groups based on their change in scores on the NBAA from T2-T3; age, lesion volume, and change in scores are reported in the three groups
Associations to aphasia severity in the chronic stages of aphasia
As shown in none of the variables in T1 was associated with aphasia severity at twelve-months post-stroke. To investigate the results further, we investigated how well initial stroke severity, measured by patients’ scores on the NIHSS, and initial aphasia severity, measured by the NBAA at T1, and aphasia severity at T2 could explain the patients’ variance in scores from the NBAA at T3. We performed a standard multiple regression with the aphasia total score at T3 as the predictor variable and the patients scores on the NIHSS, and the NBAA at T1 and at T2 as independent variables. The results from the multiple regression analysis showed that R squared = .56 (adjusted R Square = .51), thus indicating that 56% of the variance of the patients’ total aphasia score can be explained by their initial stroke and aphasia severity and their aphasia score at T2. The patients’ total aphasia severity score at T2 had the largest Beta coefficient (β = .76, Sig. = .001), thus indicating a strong contribution to explaining the patients scores on the NBAA at T3. The Beta coefficients of the scores on the NIHSS (β = −.06) and the NBAA (β = −.03) at T1 showed non-significant unique contributions in explaining the total variance.
Lesion location and aphasia severity
We investigated the associations between the patients’ lesions at admission and the patients’ overall aphasia severity score on the NBAA at T3. We found significant associations between specific lesioned areas and the patients’ performance on the total aphasia severity score on the NBAA. More specifically, lesions within the postcentral gyrus (MNI = −31x-35x54, Z score = 3.681) and the inferior parietal gyrus (MNI = −31x-35x4, Z score = 3.681) were significantly associated with aphasia severity at T3. illustrates the results from the VLSM-analysis of the patients' lesioned areas at T1 and aphasia severity at T3.
We carried out a power analysis of aphasia severity at T3 and the patients’ lesions at T1 in VLSM in order to investigate the regions that have sufficient power to detect an effect of maximum effect size of p < .05. The lesion detection threshold was set to 20% prior to the analysis, thus indicating that at least five persons had a damage in the specific voxels. The analysis showed that regions within the frontal lobe; the insula (MNI-42-1x5) Z = 4.27, the inferior frontal operculum (IFGpOp) (MNI-50x13x16) Z = 4.02 and the precentral gyrus (preCG) (MNI-49x11x32) Z = 4.02 were associated with the patients’ aphasia severity at T3. In the temporal lobe we found that lesions within the superior temporal gyrus (STG) (MNI-54x-31x20) Z = 4.27, and Heschl’s gyrus (MNI-39x-23x10) Z = 4.27 were associated with the patients’ aphasia severity at T3. Finally, in the parietal lobe, lesions within the supramarginal gyrus (MNI-57x-26x20) Z = 4.02, was found to be associated with the patients’ aphasia severity at T3. A power-map of the analysis is shown in .
To investigate the aphasia scores in more detail, we also investigated the patients’ performance on the subtests’ auditory comprehension, repetition, naming, reading comprehension and reading out loud from the NBAA at T3, and the relationship to their initial lesion locations at T1. In line with the overall aphasia severity score, the patients’ auditory comprehension scores from T1 were also associated with lesions within the postcentral gyrus. We also found the patients’ scores on the reading comprehension task to be associated with lesions within the postcentral gyrus.
The patients’ performance on the repetition task was only associated with lesions within the rolandic operculum (RO). Finally, the patients’ scores on the reading out loud subtest at T1 were associated with lesions within the RO, the insula, the superior temporal gyrus (STG), and the supramarginal gyrus (SMG). shows the results from the VLSM-analysis, while illustrates the results in colorized multislice maps of the associations between patients' lesions at T1 and associations to performance on the subtests from the NBAA.
Figure 4. Colorized multi-slice maps of left hemispheric lesions at T1 and associated performance on the overall aphasia severity score (A) and subtests at T3. A: Aphasia severity, B: Auditory comprehension, C: Repetition, D: Reading comprehension, E: Reading out loud at T3 (n = 23). All maps include FDR-corrections with permutations, p < .05. Warmer areas (red) indicate a greater lesion overlap than colder areas (purple/blue). Color bars indicate Z scores
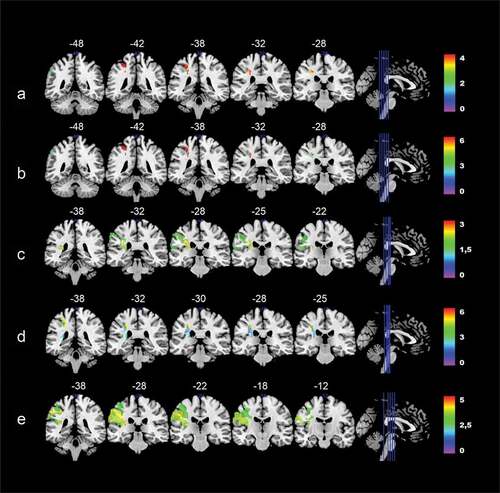
Table 4. VLSM-analysis of lesions associated with overall aphasia severity, repetition, naming, reading comprehension, and reading out loud, MNI-coordinates in parenthesis (n = 23)
Region of interest-analysis
A post-hoc region of interest (ROI) analysis was carried out to investigate lesion size within each specific region. Based on previous studies we included three areas of interest; the insula (Price, Citation2000; Sul et al., Citation2019), the IFGpOp (Richardson et al., Citation2012), and the posterior divisions of the STG (Hillis et al., Citation2018) as ROIs. We performed a standard multiple regression analysis with the patients changes in their aphasia scores from T1 to T3 as the predictor variable, and their total lesion volume (mm3), and lesion volume within each ROI as independent variables. The results from the analysis showed that R squared = .38 (adjusted R square = .25), thus indicating that 38% of the variance of the patients’ change in aphasia severity scores from T1-T3 can be explained by lesions within the insula, IFGpOp, the posterior portions of the STG, and the patients total lesion volume. The patients total lesion volume had the largest Beta coefficient (β = .46, Sig. = .07), thus indicating a small non-significant contribution to explaining the patients change in scores from T1-T3. The Beta coefficients of the insula (β = .06), the IFGpOp (β = −.13) and the posterior STG (β = .23) also showed non-significant unique contributions in explaining the total variance of the patients recovery from T1-T3.
Discussion
The aim of the present study was to investigate the associations between stroke severity, aphasia severity, lesion location and lesion size in acute stroke, and aphasia severity in the subacute and chronic stages post-stroke. We hypothesized that initial stroke severity, aphasia severity, and lesion location in the acute stages were associated with aphasia severity in the subacute and chronic stages of aphasia post stroke.
Our results showed that lesion size is associated with aphasia severity at admission and in the subacute stages of aphasia. However, initial lesion size was not associated with aphasia severity at one-year post stroke. Surprisingly, we did not find initial stroke severity, measured by the NIHSS, the mRS and the BI, and initial aphasia severity, as measured with the NBAA, to be associated with aphasia severity one-year post stroke. However, we found aphasia severity in the subacute stages post stroke to be highly associated with the patients’ aphasia severity one-year post stroke.
Lesion analysis showed that lesions within the postcentral gyrus (postCG) and the inferior parietal gyrus (IPG) were associated with the patients’ overall aphasia severity one-year post stroke. The power-analysis yielded that several lesioned areas within the frontal lobe; the insula, the IFGpOp, the preCG were associated with aphasia severity at T3, and the temporal lobe; the STG and Heschl’s gyrus, and the SMG located within the parietal lobe were associated with aphasia severity at T3.
By investigating the subtests from the NBAA from T3 and the patients lesions at admission we also found that lesions within the postcentral gyrus were associated with the patients’ auditory comprehension score and their scores on the reading comprehension subtest. Further, lesions within the RO were associated with the patients’ scores on the repetition subtest. Finally, lesions within the RO, the insula, the STG, and the SMG were associated with the patients scores on the reading out loud subtest.
In order to investigate the contribution of a lesion within a specific region, we conducted an ROI-analysis investigating three brain regions reported in lesion studies (Baldo et al., Citation2006; Price, Citation2000; Sul et al., Citation2019), as well as overall lesion size. The findings from our post-hoc ROI-analysis showed that neither lesion size, lesions within the insula, the IFGpOP, or the posterior divisions of the STG could explain the patients changes in aphasia severity scores from T1 to T3.
Initial stroke and aphasia severity
Notably, our results were not consistent with earlier studies showing that initial stroke severity and aphasia severity are considered predictors of aphasia severity in the subacute and chronic stages post stroke (Benghanem et al., Citation2019; El Hachioui et al., Citation2013; Lazar et al., Citation2010; Pedersen et al., Citation2004; Plowman et al., Citation2012). Our initial hypothesis was therefore not confirmed.
Studies vary in their definitions of acute, subacute, and chronic stroke. The time of assessment post stroke might play a crucial role when investigating the relationships between initial aphasia severity and long-term outcomes. It is well documented that stroke-patients might experience great improvement in the first days after their initial symptoms (Toni et al., Citation1997). Our T1 aphasia assessment was carried out within the first seven days post-stroke. As reported earlier, El Hachioui et al. (Citation2013) found that the phonology score in the ScreeLing were significant predictors aphasia one-year post stroke. The time of baseline assessment was administered at one-week post stroke, thus differing slightly from the time of T1-assessment in the present study. In the study by Laska et al. (Citation2001) the Swedish translation of the Norwegian Basic Aphasia Assessment was carried out at a median of 5 days (range 0–30) post stroke, and at their follow-up assessments at 3, 6 and 18 months post stroke. The authors also used the Amsterdam-Nijmegen-Everyday-Language-Test (ANELT) (Blomert et al., Citation1994) to assess verbal communicative language, and a subjective measure ranked by the speech and language therapist. The authors specify that ninety per cent of all subjects in the study were assessed within 11 days. Laska et al. (Citation2001) report that great improvements were seen in almost all patients. This is mainly based on their findings from the ANELT. In their study the Swedish version of the NBAA was used to assess aphasia subtype. Whereas the present study used the total score of the test, and the raw scores from the subtests to investigate recovery. Further, in Lazar et al. (Citation2010) the baseline assessment was carried within 24–72 hours post stroke. However, patients with severe comprehension deficits were not included in the study because of their inability to sign an informed consent. Flowers et al. (Citation2016) conducted a systematic review and meta-analysis to investigate the frequency, recovery, and associated long-term outcomes for post-stroke aphasia. The authors thoroughly reported on the methodological qualities of the studies included in the analysis. The authors point out that few studies provide data of the exact timing of the baseline evaluations from stroke onset. Clearly, different methodological and statistical approaches differ across studies, and this might be misleading when comparing studies on the long-term recovery of aphasia.
Another important consideration when interpreting the results are the assessment tools included in the present study. The NIHSS, the BI and the mRS are commonly used in the functional assessment of stroke (Harrison et al., Citation2013). Even though the validity of the NIHSS has been well documented (Adams et al., Citation1999), it has also been questioned (Peters et al., Citation2015). Peters et al. (Citation2015) argue in their study that the NIHSS lacks associations between measures of impairment and functional limitations. They concluded that the NIHSS had poor validity in distinguishing long-term poststroke outcomes. Even though the NIHSS is commonly used to predict outcome, the tool was originally designed to measure stroke severity in clinical trials (P. Lyden et al., Citation1994). Therefore, a different measure, which had been designed to predict stroke long-term stroke outcome, might have been more appropriate in the present study. The mRS has been found to lack specificity (Kasner, Citation2006). It does not assess difficulties within cognition, language, visual function, emotional impairment, and pain which are factors that might be more associated with post-stroke aphasia.
The use of the NBAA in acute stroke has shown high validity (Reinvang & Engvik, Citation1980). However, the validation of the NBAA was carried out on a group of patients primarily in the subacute stages post-stroke. Also, in the validation of the NBAA patients with a range of brain diseases were included, whereas ischemic stroke accounted for 60%.
Therefore, naturally, our results should be interpreted with caution, hence not ruling out the possibility of inadequate measures, nor time of assessment of aphasia and stroke severity as possible explanations for the lack of associations within the measurements used in the present study.
Lesion size
Lesion size was associated with aphasia severity at T1 and at T2. This is consistent with earlier findings investigating the role of lesion size in acute and subacute post-stroke aphasia (Benghanem et al., Citation2019; Døli et al., Citation2021). However, we did not find any associations between initial lesion size and aphasia severity at T3. This finding is contradictory to other studies investigating predictors of aphasia recovery post-stroke (Forkel et al., Citation2014; Plowman et al., Citation2012). The time of assessment might be crucial when investigating possible predictors of aphasia. It is generally agreed upon that the greatest spontaneous recovery occurs within the first three months post stroke (Laska et al., Citation2001). In a study by Saur et al. (Citation2006) they investigated patients with aphasia using functional magnetic resonance imaging (fMRI) at three time points, in the acute stage (within the first days post stroke), subacute (2 weeks) and chronic stages (one year post stroke) post stroke. They suggest that brain reorganization post stroke follows three phases, from a reduced activation of the remaining left language areas in the acute phase, to an upregulation with recruitment of contralateral language areas in the subacute stages, and finally, a normalization of activation in the chronic phases post stroke. The results from the present study indicate that the greatest improvement in aphasia occurs within the first month’s post-stroke, and that this improvement is associated with the patients’ initial lesion size. The patients’ aphasia scores improve throughout the first-year post stroke, and the greatest improvement is seen the first three months. Our results suggest that lesion size is highly associated with the subacute aphasia recovery, but it is not associated with aphasia recovery in the chronic stages post stroke.
Lesion location
Lesions within the parietal regions of the left hemisphere were found to be associated with the patients’ overall aphasia severity at T3. In the power analysis we also found the SMG to be associated with the patients’ aphasia severity at T3. Several studies have emphasized the role of the temporoparietal regions of the brain in the recovery of aphasia (Benghanem et al., Citation2019), and damage to parietal regions has been found to be associated with fluency deficits in aphasia (Baldo et al., Citation2006). Our power-analysis yielded that temporal regions, such as the STG and Heschl’s gyrus also were associated with aphasia severity at T3. Our findings underline the importance of the temporoparietal lobe in speech and language processing(Bates et al., Citation2003; Dronkers et al., Citation2004).
Our power-analysis also showed associations between specific frontal inferior and frontal posterior regions (IFGpOP, PreCG and the insula) and the patients’ aphasia severity at T3. Regions within the left frontal lobe have also been found to be associated with aphasia in previous studies (Baldo et al., Citation2006; Price et al., Citation2010). The insula has been suggested to have an important role in both language production and comprehension (Ardila et al., Citation2016). Our findings are therefore in line with previous studies on both the role of the specific areas in speech and language processing, and the role of lesions within these specific regions in aphasia recovery.
When we investigated the associations between initial lesions and the NBAA subtests at T3 we found that several specific brain regions in the left hemisphere were associated with the different subtests from the NBAA. First, lesions within the InfPG and PostCG were found to be associated with overall aphasia severity. Also, the patients’ performance on the auditory comprehension and the reading comprehension subtest were associated with lesions within the postCG, indicating that lesions within the parietal lobe might be crucial in language comprehension. Dronkers et al. (Citation2004) suggested an extensive left-lateralization for language comprehension based on findings from lesion-symptom mapping and functional magnetic imaging studies on the healthy brain. The network was proposed to include areas throughout the left peri-sylvian cortex and close-by regions, including parts of the middle temporal gyrus, inferior temporal regions, the inferior parietal lobule, the Inferior frontal gyrus, and in addition other frontal regions associated with working memory and cognitive control operations.
Limitations
The present study is based on data acquired during routine care as well as the ESD-study (Hofstad et al., Citation2013). The missing data from the MRI scans of several patients, and especially the data from the language assessments at three and twelve months reduced the final selection of patients by almost 50%. This is consistent with other longitudinal studies investigating patients with aphasia, where large numbers of dropouts are reported (Benghanem et al., Citation2019; Flowers et al., Citation2016). Lorca-Puls et al. (Citation2018) investigated the impact of sample size on the reproducibility of voxel-based lesion-deficit mappings. The authors found that studies with low-power due to small sample sizes, produced heterogeneous results. The authors argue that this might over- or underestimate the populations true effect-size. The low sample size in the present study might therefore underestimate the associations between the patients lesions and aphasia severity. Therefore, based on the sample size, we cannot predict aphasia severity at T3 based on our available data at T1 and T2, and our results should be interpreted with caution.
Further, we did not control or collect any information regarding the amount and type of speech and language therapy given between the test points. It is likely to assume that the majority of patients included in the study received speech and language therapy while hospitalized and after discharge from the hospital, as it is a statutory right financed by the Norwegian government. Therefore, we cannot rule out the effect of treatment in the present study, which might be substantial (Ali et al., Citation2021). The scope of the study is therefore observational, and information about type and amount of therapy would have enhanced the quality of the study.
Drawing and determining lesions in VLSM is a time-consuming and subjective procedure. To enhance the inter-rater reliability in the study, a close cooperation between the authors was ensured. However, it is important to point out that VLSM-analysis does not give a causal relationship between the lesioned regions of the brain and aphasia. The results from the VLSM-analysis merely show us that the neuronal systems and the connections within a specific lesioned area of the brain are associated with or necessary for the language function which is affected (Price, Citation2000). Furthermore, it is also important to point out that the lack of statistical relationships between damaged regions and language functions does not rule out the regions importance in language processing (Price et al., Citation2010).
As discussed earlier, studies investigating aphasia post stroke differ in the time of the assessment. Our study showed that one should distinguish between subacute and more chronic stages of aphasia recovery when aiming to investigate associations because the relationships between variables seem to change over time. Therefore, a follow-up study of patients in an even longer perspective, such as two years or longer, would be of interest.
Conclusions
In the present study initial stroke and aphasia severity were not associated with aphasia severity in the chronic stages post stroke. However, aphasia severity in the subacute stage is associated with aphasia severity in the chronic stages post stroke. Lesion size is associated with initial and subacute aphasia severity. Finally, lesions within the IFGpOp, the insula, the left STG, Heschl’s gyrus, and left inferior parietal and postcentral gyrus were found to be associated with aphasia severity in the chronic stages post stroke.
Acknowledgments
We are sincerely thankful for the participation of the patients in the study, and the collaboration of the speech and language pathologists, the Department of radiology and to our collaborators in the ESD-study and the Bergen NORSTROKE registry.
Disclosure statement
No potential conflict of interest was reported by the author(s).
References
- Adams, H. P., Davis, P. H., Leira, E. C., Chang, K.-C., Bendixen, B. H., Clarke, W. R., Woolson, R. F., & Hansen, M. D. (1999). Baseline NIH Stroke Scale score strongly predicts outcome after stroke. A Report of the Trial of Org 10172 in Acute Stroke Treatment (TOAST), 53(1), 126. https://doi.org/10.1212/wnl.53.1.126
- Ali, M., VandenBerg, K., Williams, L. J., Williams, L. R., Abo, M., Becker, F., Bowen, A., Brandenburg, C., Breitenstein, C., Bruehl, S., Copland, D. A., Cranfill, T. B., Pietro-Bachmann, M. D., Enderby, P., Fillingham, J., Galli, F. L., Gandolfi, M., Glize, B., Godecke, E., Hawkins, N., … Brady, M. C. (2021). Predictors of poststroke aphasia recovery. Stroke, 52(5), 1778–1787. https://doi.org/10.1161/STROKEAHA.120.031162
- Ardila, A., Bernal, B., & Rosselli, M. (2016, February). How localized are language brain areas? A review of Brodmann areas involvement in oral language. Archives of Clinical Neuropsychology: The Official Journal of the National Academy of Neuropsychologists, 31(1), 112–122. https://doi.org/10.1093/arclin/acv081
- Baldo, J. V., Schwartz, S., Wilkins, D., & Dronkers, N. F. (2006). Role of frontal versus temporal cortex in verbal fluency as revealed by voxel-based lesion symptom mapping. Journal of the International Neuropsychological Society, 12(6), 896–900. 2006/November/001. https://doi.org/10.1017/S1355617706061078
- Banks, J. L., & Marotta, C. A. (2007). Outcomes validity and reliability of the modified rankin scale: Implications for stroke clinical trials. A Literature Review and Synthesis, 38(3), 1091–1096. https://doi.org/10.1161/01.STR.0000258355.23810.c6
- Bates, E., Wilson, S. M., Sayin, A. P., Dick, F., Sereno, M. I., Knight, R. T., & Dronkers, N. F. (2003). Voxel-based lesion-symptom mapping. Nature Neuroscience, 6(5), 448–450. https://doi.org/10.1038/nn1050
- Benghanem, S., Rosso, C., Arbizu, C., Moulton, E., Dormont, D., Leger, A., Pires, C., & Samson, Y. (2019). Aphasia outcome: The interactions between initial severity, lesion size and location. Journal of Neurology, 266(6), 1303–1309. 2019/June/01. https://doi.org/10.1007/s00415-019-09259-3
- Blomert, L., Kean, M. L., Koster, C., & Schokker, J. (1994). Amsterdam—Nijmegen everyday language test: Construction, reliability and validity. Aphasiology, 8(4), 381–407. 1994/July/01. https://doi.org/10.1080/02687039408248666
- Brady, M. C., Kelly, H., Godwin, J., Enderby, P., & Campbell, P. (2016). Speech and language therapy for aphasia following stroke. Cochrane Database of Systematic Reviews(6). https://doi.org/10.1002/14651858.CD000425.pub4
- Brett, M., Leff, A. P., Rorden, C., & Ashburner, J. (2001, August). Spatial normalization of brain images with focal lesions using cost function masking. NeuroImage, 14(2), 486–500. https://doi.org/10.1006/nimg.2001.0845
- Brott, T., Adams, H. P., Olinger, C. P., Marler, J. R., Barsan, W. G., Biller, J., Spilker, J., Holleran, R., Eberle, R., & Hertzberg, V. (1989). Measurements of acute cerebral infarction: A clinical examination scale. Stroke, 20(7), 864–870. https://doi.org/10.1161/01.STR.20.7.864
- Chollet, F., Rigal, J., Marque, P., Barbieux-Guillot, M., Raposo, N., Fabry, V., Albucher, J. F., Pariente, J., & Loubinoux, I. (2018). Serotonin Selective Reuptake Inhibitors (SSRIs) and Stroke. Current Neurology and Neuroscience Reports, 18(12), 100. 2018/October/23. https://doi.org/10.1007/s11910-018-0904-9
- Døli, H., Helland, W. A., Helland, T., & Specht, K. (2021). Associations between lesion size, lesion location and aphasia in acute stroke. Aphasiology 35 6 , 745–763 . https://doi.org/10.1080/02687038.2020.1727838
- Dronkers, N. F., Wilkins, D. P., Van Valin, R. D., Jr., Redfern, B. B., & Jaeger, J. J. (2004, May-June). Lesion analysis of the brain areas involved in language comprehension. Cognition, 92(1–2), 145–177. https://doi.org/10.1016/j.cognition.2003.11.002
- El Hachioui, H., Lingsma, H. F., van de Sandt-koenderman, M. W. M. E., Dippel, D. W. J., Koudstaal, P. J., & Visch-Brink, E. G. (2013). Long-term prognosis of aphasia after stroke. Journal of Neurology, Neurosurgery, and Psychiatry, 84(3), 310–315. https://doi.org/10.1136/jnnp-2012-302596
- Flowers, H. L., Skoretz, S. A., Silver, F. L., Rochon, E., Fang, J., Flamand-Roze, C., & Martino, R. (2016). Poststroke aphasia frequency, recovery, and outcomes: a systematic review and meta-analysis. Archives of Physical Medicine and Rehabilitation, 97(12), 2188–2201.e2188. 2016/December/01. https://doi.org/10.1016/j.apmr.2016.03.006
- Fonseca, J., Ferreira, J. J., & Martins, I. P. (2017). Cognitive performance in aphasia due to stroke: A systematic review. International Journal on Disability and Human Development, 16(2), 127–139. https://doi.org/10.1515/ijdhd-2016-0011
- Forkel, S. J., & Catani, M. (2018). Lesion mapping in acute stroke aphasia and its implications for recovery. Neuropsychologia, 115:88–100. 2018/July/01. https://doi.org/10.1016/j.neuropsychologia.2018.03.036.
- Forkel, S. J., Thiebaut de Schotten, M., Dell’Acqua, F., Kalra, L., Murphy, D. G., Williams, S. C., & Catani, M. (2014, July). Anatomical predictors of aphasia recovery: A tractography study of bilateral perisylvian language networks. Brain, 137(Pt 7), 2027–2039. https://doi.org/10.1093/brain/awu113
- Geschwind, N. (1965). Disconnexion syndromes in animals and man. I. Brain, 88(2), 237–294. https://doi.org/10.1093/brain/88.2.237
- Goodglass, H., Kaplan, E., & Barresi, B. (2001). The assessment of aphasia and related disorders (Third ed.). Lippincott Williams & Wilkins.
- Goodglass, H., & Kaplan, E. (1972). The Boston diagnostic aphasia examination. Lea & Febiger.
- Gronberg, A., Henriksson, I., & Lindgren, A. (2020). abstract TP149: aphasia recovery after ischemic stroke. Stroke, 51(Suppl_1), ATP149–ATP149. https://doi.org/10.1161/str.51.suppl_1.TP149
- Harrison, J. K., McArthur, K. S., & Quinn, T. J. (2013). Assessment scales in stroke: Clinimetric and clinical considerations. Clinical Interventions in Aging, 8, 201–211. https://doi.org/10.2147/CIA.S32405
- Hillis, A. E., Beh, Y. Y., Sebastian, R., Breining, B., Tippett, D. C., Wright, A., Saxena, S., Rorden, C., Bonilha, L., Basilakos, A., Yourganov, G., & Fridriksson, J. (2018). Predicting recovery in acute poststroke aphasia. Annals of Neurology, 83(3), 612–622. https://doi.org/10.1002/ana.25184
- Hofstad, H., Naess, H., Moe-Nilssen, R., & Skouen, J. S. (2013). Early supported discharge after stroke in Bergen (ESD Stroke Bergen): A randomized controlled trial comparing rehabilitation in a day unit or in the patients’ homes with conventional treatment. International Journal of Stroke, 8(7), 582–587. https://doi.org/10.1111/j.1747-4949.2012.00825.x
- Hope, T. M. H., Friston, K., Price, C. J., Leff, A. P., Rotshtein, P., & Bowman, H. (2019, January). Recovery after stroke: Not so proportional after all? Brain, 142(1), 15–22. https://doi.org/10.1093/brain/awy302
- Kasner, S. E. (2006). Clinical interpretation and use of stroke scales. The Lancet Neurology, 5 (7), 603–612. 7// http://dx.doi.org/10.1016/S1474-4422(06)70495-1
- Krakauer, J., & Marshall, R. (2015). The proportional recovery rule for stroke revisited. Annals of Neurology, 78(6), 845–847. https://doi.org/10.1002/ana.24537
- Laska, A. C., Hellblom, A., Murray, V., Kahan, T., & Von, A. (2001). Aphasia in acute stroke and relation to outcome. Journal of Internal Medicine, 249(249), 413–422. https://doi.org/10.1046/j.1365-2796.2001.00812.x
- Lazar, R. M., Minzer, B., Antoniello, D., Festa, J. R., Krakauer, J. W., & Marshall, R. S. (2010). Improvement in aphasia scores after stroke is well predicted by Initial Severity. Stroke, 41(7), 1485–1488. https://doi.org/10.1161/STROKEAHA.109.577338
- Leys, D., Hénon, H., Mackowiak-Cordoliani, M. A., & Pasquier, F. (2005, November). Poststroke dementia. Lancet Neurology, 4 (11), 752–759. https://doi.org/10.1016/s1474-4422(05)70221-0
- Lind, M., & Haaland-Johansen, L. (2013). Kartlegging ved afasi: Hva gjør logopeder i Norge? Norsk Tidsskrift for Logopedi, 3, 6–14 01 03 2018 https://www.researchgate.net/publication/260647639_Kartlegging_ved_afasi_Hva_gjor_logopeder_i_Norge.
- Lorca-Puls, D. L., Gajardo-Vidal, A., White, J., Seghier, M. L., Leff, A. P., Green, D. W., Crinion, J. T., Ludersdorfer, P., Hope, T. M. H., Bowman, H., & Price, C. J. (2018, July 1). The impact of sample size on the reproducibility of voxel-based lesion-deficit mappings. Neuropsychologia, 115, 101–111. https://doi.org/10.1016/j.neuropsychologia.2018.03.014
- Lundström, E., Isaksson, E., Näsman, P., Wester, P., Mårtensson, B., Norrving, B., Wallén, H., Borg, J., Dennis, M., Mead, G., Hankey, G. J., Hackett, M. L., & Sunnerhagen, K. S. (2020). Safety and efficacy of fluoxetine on functional recovery after acute stroke (EFFECTS): A randomised, double-blind, placebo-controlled trial. The Lancet Neurology, 19(8), 661–669. 2020/August/01. https://doi.org/10.1016/S1474-4422(20)30219-2
- Lyden, P. D., Lu, M., Levine, S. R., Brott, T. G., & Broderick, J. (2001, June). A modified national institutes of health stroke scale for use in stroke clinical trials: Preliminary reliability and validity. Stroke, 32(6), 1310–1317. https://doi.org/10.1161/01.STR.32.6.1310
- Lyden, P., Brott, T., Tilley, B., Welch, K. M., Mascha, E. J., Levine, S., Haley, E. C., Grotta, J., & Marler, J. (1994). Improved reliability of the NIH Stroke Scale using video training. NINDS TPA stroke study group. Stroke, 25(11), 2220–2226. https://doi.org/10.1161/01.STR.25.11.2220
- Mahoney, F., & Barthel, D. (1965). Functional evaluation: The Barthel Index. Md Med J, 14, 61–65 01 01 2017 https://stopstroke.massgeneral.org/pdfs/barthel_reprint.pdf.
- Marchi, N. A., Ptak, R., Di Pietro, M., Schnider, A., & Guggisberg, A. G. (2017, August). Principles of proportional recovery after stroke generalize to neglect and aphasia. European Journal of Neurology: The Official Journal of the European Federation of Neurological Societies, 24 (8), 1084–1087. https://doi.org/10.1111/ene.13296
- Mijajlović, M. D., Pavlović, A., Brainin, M., Heiss, W.-D., Quinn, T. J., Ihle-Hansen, H. B., Hermann, D. M., Assayag, E. B., Richard, E., Thiel, A., Kliper, E., Shin, Y.-I., Kim, Y.-H., Choi, S., Jung, S., Lee, Y.-B., Sinanović, O., Levine, D. A., Schlesinger, I., Mead, G., … Bornstein, N. M. (2017). Post-stroke dementia – A comprehensive review. BMC Medicine, 15(1), 11. 2017/January/18. https://doi.org/10.1186/s12916-017-0779-7
- Pedersen, P., Vinter, K., & Olsen, T. S. (2004). Aphasia after stroke: type, severity and prognosis. Cerebrovascular Diseases, 17(1), 35–43. https://doi.org/10.1159/000073896
- Pendlebury, S. T., & Rothwell, P. M. (2009). Prevalence, incidence, and factors associated with pre-stroke and post-stroke dementia: A systematic review and meta-analysis. The Lancet Neurology, 8(11), 1006–1018. 2009/November/01. https://doi.org/10.1016/S1474-4422(09)70236-4
- Peters, H. T., White, S. E., & Page, S. J. (2015). The national institutes of health stroke scale lacks validity in chronic Hemiparetic stroke. Journal of Stroke and Cerebrovascular Diseases, 24(10), 2207–2212. 2015/October/01. https://doi.org/10.1016/j.jstrokecerebrovasdis.2015.05.011
- Plowman, E., Hentz, B., & Ellis, C., Jr. (2012). Post-stroke aphasia prognosis: A review of patient-related and stroke-related factors. Journal of Evaluation in Clinical Practice, 18 (3), 689–694. https://doi.org/10.1111/j.1365-2753.2011.01650.x
- Price, C. J., Seghier, M. L., & Leff, A. P. (2010). Predicting language outcome and recovery after stroke: The PLORAS system. Nature Reviews. Neurology, 6 (4), 202–210. https://doi.org/10.1038/nrneurol.2010.15
- Price, C. J. (2000, Oct). The anatomy of language: Contributions from functional neuroimaging. Journal of Anatomy, 197 Pt 3 (Pt 3), 335–359. https://doi.org/10.1046/j.1469-7580.2000.19730335.x
- Rankin, J. (1957, May). Cerebral vascular accidents in patients over the age of 60. II. Prognosis. Scottish Medical Journal, 2(5), 200–215. https://doi.org/10.1177/003693305700200504
- Rasquin, S. M. C., Verhey, F. R. J., van Oostenbrugge, R. J., Lousberg, R., & Lodder, J. (2004). Demographic and CT scan features related to cognitive impairment in the first year after stroke. Journal of Neurology, Neurosurgery, and Psychiatry, 75(11), 1562. https://doi.org/10.1136/jnnp.2003.024190
- Reinvang, I., & Engvik, H. (1980). Håndbok. Norsk Grunntest for Afasi. Universitetsforlaget.
- Richardson, J. D., Fillmore, P., Rorden, C., Lapointe, L. L., & Fridriksson, J. (2012, November). Re-establishing Broca’s initial findings. Brain and Language, 123 (2), 125–130. https://doi.org/10.1016/j.bandl.2012.08.007
- Rorden, C., Karnath, H. O., & Bonilha, L. (2007, July). Improving lesion-symptom mapping. Journal of Cognitive Neuroscience, 19 (7), 1081–1088. https://doi.org/10.1162/jocn.2007.19.7.1081
- Saur, D., Lange, R., Baumgaertner, A., Schraknepper, V., Willmes, K., Rijntjes, M., & Weiller, C. (2006). Dynamics of language reorganization after stroke. Brain, 129(6), 1371–1384. https://doi.org/10.1093/brain/awl090
- Seghier, M. L., Patel, E., Prejawa, S., Ramsden, S., Selmer, A., Lim, L., Browne, R., Rae, J., Haigh, Z., Ezekiel, D., Hope, T. M. H., Leff, A. P., & Price, C. J. (2016, January). The PLORAS database: A data repository for predicting language outcome and recovery after stroke. NeuroImage, 124(Pt B), 1208–1212. https://doi.org/10.1016/j.neuroimage.2015.03.083
- Sul, B., Lee, K. B., Hong, B. Y., Kim, J. S., Kim, J., Hwang, W. S., & Lim, S. H. 2019. Association of lesion location with long-term recovery in post-stroke aphasia and language deficits [original research]. Frontiers in Neurology, 10(776). 2019-July-24. https://doi.org/10.3389/fneur.2019.00776.
- Thye, M., & Mirman, D. (2018). Relative contributions of lesion location and lesion size to predictions of varied language deficits in post-stroke aphasia. NeuroImage: Clinical, 20:1129–1138. 2018/January/01. https://doi.org/10.1016/j.nicl.2018.10.017.
- Toni, D., Fiorelli, M., Bastianello, S., Falcou, A., Sette, G., Ceschin, V., Sacchetti, M. L., & Argentino, C. (1997). Acute Ischemic strokes improving during the first 48 hours of onset: predictability, outcome, and possible mechanisms. Stroke, 28(1), 10–14. https://doi.org/10.1161/01.STR.28.1.10
- Watila, M. M., & Balarabe, S. A. (2015). Factors predicting aphasia recovery. Journal of the Neurological Sciences, 352 352 1–2 12–8 doi:10.1016/j.jns.2015.03.020 .
- Wittler, M. (2009, November 1). Recovery process from aphasia in the acute and subacute stages - State of the art. Forum Logopadie, 23, 12–19 https://www.researchgate.net/publication/287574967_Recovery_process_from_aphasia_in_the_acute_and_subacute_stages_-_State_of_the_art.
- Zhou, D. H. D., Wang, J. Y. J., Li, J., Deng, J., Gao, C., & Chen, M. E. (2004). Study on frequency and predictors of dementia after ischemic stroke. Journal of Neurology, 251(4), 421–427. 2004/April/01. https://doi.org/10.1007/s00415-004-0337-z