
 ?Mathematical formulae have been encoded as MathML and are displayed in this HTML version using MathJax in order to improve their display. Uncheck the box to turn MathJax off. This feature requires Javascript. Click on a formula to zoom.
ABSTRACT
The research tests a proposition that a more diverse range of new build housing improves absorption rates. Land registry house sales for four Planning Authorities in Leeds City region in the UK, over an 11-year period, were used to calculate Brillouin’s Index of diversity and perform Pearson and ANOVA tests to determine strength and significance of the correlation between absorption rates and diversity by type, size and tenure of new housing. The significant findings are that residential developments with higher diversity have lower absorption rates, conversely, developments with lower diversity have higher absorption rates and smaller sites are built-out faster.
Introduction
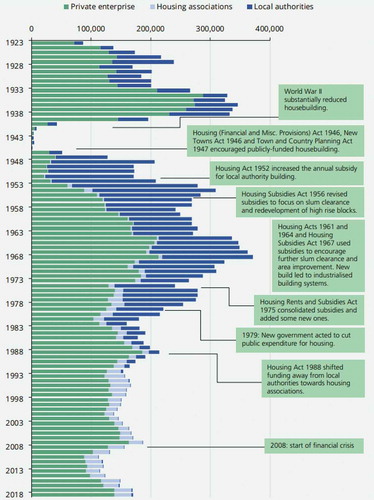
Compared to other European countries, the UK has a relatively low housing development intensity, completing fewer than 3 dwellings (2.65) per thousand population compared with 3.53 in Germany, 4.06 in the Netherlands, 5.54 in Italy and 6.70 in France (Linhart et al., Citation2020). The UK Government’s own Ministry of Housing, Communities and Local Government describes the UK housing market as ‘broken’ (DCLG, Citation2017a). Construction of new homes in the UK fell to a nominal post WWII low between 2008 and 2011 (see ) due to the credit crunch, financial crisis and subsequent recession since when new house building has barely recovered to pre-recession levels. A plethora of reviews and analyses (Barker, Citation2004; Calcutt, Citation2007; Ball, Citation2010a, Citation2010b; Griffith & Jefferys, Citation2013; Lyons, Citation2014; KPMG and Shelter, Citation2015; McDonald & Whitehead, Citation2015; Bramley & Watkins, Citation2016; House of Lords Select Committee on Economic Affairs, Citation2016; DCL, Citation2017a; McKibbin, Citation2018; Wilson & Barton, Citation2020) evidence that the average number of new houses being built annually in the UK, compared to other countries in Europe. The UK has consistently failed to supply sufficient new houses at prices that are affordable to many households, particularly first time buyers, and; recent improvements in house building output have barely dented the deficit. Since 1970, there has been an average of 160,000 homes built per year (House of Lords, Citation2016; DCLG, Citation2017a) leading to an anticipated shortage of up 2 million homes by 2020 (Lyons, Citation2014). In response to the UK housing crisis, the 2015 Conservative Government pledged to deliver 200,000 new homes per year up to 2020 with a further 500,000 by 2022, a figure last achieved in 1972 (Conservative Party, Citation2017; McKibbin, Citation2018; DCLG, Citation2015). Whilst this appears ambitious, it is still well below the 240,000 to 300,000 new housing units a year that are needed to meet demand (Barker, Citation2004; NHPAU, Citation2008; Holmans, Citation2013; Lyons, Citation2014; KPMG and Shelter, Citation2015; Archer & Cole, Citation2016; House of Lords Select Committee on Economic Affairs, Citation2016; Bramley, Citation2018; Garton-Grimshaw et al., Citation2019).
Figure 1. Housebuilding by Type of Developer: England and Wales, 1923–2018 Source: (Wilson & Barton, Citation2020)
HM Government’s (Citation2017) Housing White Paper identified three fundamental problems with the housing market in the UK:
Not enough Local Planning Authorities planning for the homes they need.
House building that is too slow.
Construction industry that is too reliant on a small number of big players.
Sir Oliver Letwin, Conservative MP, was asked by the then Chancellor of the Exchequer, Philip Hammond, in his Autumn Budget of 2017, to undertake an independent review of build-out rates in the UK, to try and explain why there was a gap between housing completions and the amount of land allocated or permissioned for housing in areas of high demand (HM Treasury, Citation2017). Due to the low percentage (6.5%) of residential development sites that are built out in the UK each year, that contributes to the aforementioned low level of house building intensity in the UK, Letwin chose to focus specifically on the speed or rate of build-out (Letwin, Citation2018a, Citation2018b). Letwin (Citation2018b) suggested that the main causes of slow build out-rates were impaired absorption rates due to a lack of diversity, where absorption rate is the number of new housing units sold in a given time period and diversity is the choice of unit size, house type, tenure and design offered to potential occupiers. The aim of this research is to test the voracity of this claim by analysing the relationship between absorption rates and the diversity of house types, house tenures and size of developments to test two hypotheses:
greater diversity of house type and tenure results in increased absorption and build-out rates
small residential development sites are absorbed and built-out more rapidly than larger sites.
UK Housebuilding Output and Build-out Rates
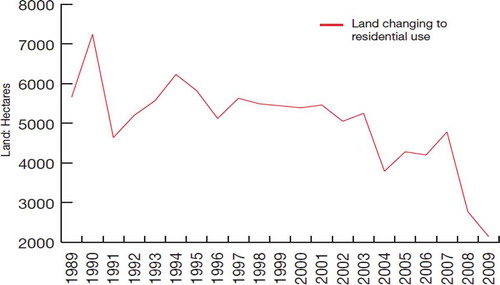
For decades, insufficient land has been brought forward for residential development in the UK (see ), a situation that provoked scrutiny of housing supply by the Barker Review (Citation2004) and ill-fated attempts to streamline the plan-making process by introducing Local Development Frameworks (LDF) under the 2004 Planning and Compulsory Purchase Act (Griffith & Jefferys, Citation2013; House of Lords Select Committee on Economic Affairs, Citation2016; Savills, Citation2017; Barker, Citation2004; Adams & Leishman, Citation2008; Adams et al., Citation2008). Further planning reforms emerged in 2011 with the adoption of the Localism Act (Citation2011) that promoted the role of local communities in the plan-making process through Neighbourhood Plans, the main purpose of which was to reduce local opposition to new housing developments and speed up delivery of new housing. This was swiftly followed by the National Planning Policy Framework (NPPF) introduced in 2012 (DCLG, Citation2012), revised in 2018 (MHCLG, Citation2018) and updated in 2019 (MHCLG, Citation2019), to create a succinct framework that, amongst other things, would encourage LPA’s to release more land for housing (Griffith & Jefferys, Citation2013). The NPPF (DCLG, Citation2012) states that LPA’s are obligated to conduct a periodic assessment of housing need in order to allow for a supply of land for housing to meet five-year demand (the 5-year housing land supply or ‘5YHLS’), plus a buffer of 20% where delivery has fallen below 85% of the housing requirement. Despite these reforms, according to Linhart et al. (Citation2020) the UK still languishes at the bottom of the European ranking of Housing Stock per capita with 411 dwellings per 1000 citizens (only Poland is lower at 381).
Figure 2. Land Allocated for Residential Use (Hectares) since 1989. Source: CLG Table P222
According to Lyons (Citation2014), the uniform, aspatial, guidance provided by the NPPF is insufficiently robust to address different demographic and market conditions between different areas of the country and there was a sense that it is largely driven by a focus on London and the South-East of England. McGuinness et al. (Citation2018) describe how the approach for land allocation within the NPPF is misguided in its place neutral and spatially blind approach, as it requires all LPA’s to provide a 5YHLS, regardless of local housing market conditions. The same solutions applied to similar problems in different places, without consideration of the specifics of the wider regional and local context potentially undermines the aims of the policy itself (Barca et al., Citation2012).
The UK Government’s intention to accelerate the rate of housing building rests heavily on the premise that the delivery of large numbers of new homes can be best achieved through larger-scale development, such as new settlements and significant extensions to existing villages and towns. MHCLG (Citation2019) revised Housing Supply and Delivery Guidance including a tighter definition of deliverable, for the purposes of 5YHLS, and introduced a new ‘backward looking’ housing delivery test. In addition to sites that are considered to be deliverable in principle, the guidance also identifies sites that require further evidence to be considered deliverable, namely:
Those which have outline planning permission for major development; are allocated in a development plan; have a grant of permission in principle; or are identified on a brownfield register. should only be considered deliverable where there is clear evidence that housing completions will begin on the site within five years … … such evidence to demonstrate deliverability may include … … a written agreement between the local planning authority and the site developer(s) which confirms the developers’ intentions and anticipated start and build-out rates.
Thus, only sites that match the deliverability criteria of being suitable now, available now and achievable with a realistic prospect that housing will be delivered on the site within five years may be included by a local authority in 5YHLS calculations. Lichfields (Citation2020) warns that such assessments of build-out rates and lead in times of large-scale development need to be realistic and go on to caution that to deliver truly ‘plan-led’ housing means allocating more sites rather than fewer with a mix of types and sizes.
Under Sections 73–76 of the NPPF (2019), if a 5YHLS has not been identified by an LPA, then the Local Plan is no longer regarded as ‘up-to-date’, thus reducing the LPA’s ability to approve or refuse planning applications. By the end of January 2017, 34 LPAs had not yet published Local Plan for consultation, and Savills (Citation2017) confirmed that 61 LPAs in England had their lack of 5YHLS confirmed at appeal by April 2017; over 40% of Local Planning Authorities do not have a plan that meets the projected growth in households in their area (DCLG, Citation2017a). Lichfields, 55% of Local Plans were found to be sound and had been adopted, 23% had been published and submitted and 22% of LPAs either had no local plan of the local plan was pre-NPPFCitation2019.
Without a 5YHLS, the supply of housing in the long term is unlikely to meet the demand, as housebuilders and developers would struggle to replace their stock of land needed for a sustainable level of output (Letwin, Citation2018b). The quicker that land is used, the larger the need for a supply of land that can be used in future (Letwin, Citation2018a). Therefore, it is important that the Government has strong evidence of ‘build-out’ rates to inform the decisions it needs to take on the delivery of new housing. Letwin (Citation2018b) argued that one of the main reasons for slow build-out of housing is the lack of diversity in the housing market, with the system imposing constraints on the supply and availability of land for development by different types of housebuilders.
In its 2017 Housing White Paper (HWP), the Conservative Government claimed that LPAs should be using land more efficiently and in places where demand is greatest (DCLG Citation2017a). The time taken to supply housing is strongly reliant on the maintenance of the planning system, ensuring that the LPAs have an up-to-date local Plan and 5YHLS. Evidence has highlighted that identifying land supply is often slow and contentious, due to the lack of a common methodology in the way in which housing need is assessed (Lyons, Citation2014; Bentley, Citation2017). The current approach to assessing housing requirement is ‘particularly complex and lacks transparency’ as the 2012 NPPF did not provide guidance on how housing need should be calculated (Wilson & Barton, Citation2018; Wilson, Citation2019). The UK Government’s latest planning reforms for England are set out in the White Paper, Planning for the Future (MHCLG, Citation2020a, Citation2020b). The Government propose replacing the aforementioned standard method of assessing housing need with a new standard method for setting binding housing requirements for each LPA, at the national level, which would take account of housing land constraints in an area (MHCLG, Citation2020b). Whether the proposed method will address the well-documented deficiencies and spatial disparities caused by the current NPPF is a matter of continuing debate.
DCLG (Citation2017a) confirmed that LPAs, whose responsibility it is to deliver new homes faster, should be given the tools to speed up house building and the powers to ensure developers build on time, but also need to be more vigilant towards applicants who gain planning permission but do not use it. Lichfields (Citation2020) confirms that build-out rate is one of the most contested matters at local plan examinations and planning inquiries that address 5YHLS and that build-out rates are worthy of further research and exploration as wider market, industry structure, financial, planning or other factors are at play.
There is a need for increased transparency throughout the application stage from housebuilders on their pace of delivery to ensure that the local housing need is met (DCLG, Citation2017a). Letwin (Citation2018b) noted that sites took several years to convert outline planning permissions into fully implementable permissions. Not releasing enough land to meet demand has also made land more expensive, increasing the cost of building new homes (Griffith & Jefferys, Citation2013). Limited supply of land and concentrated land ownership mean that the normal economics of supply and demand fail to operate. A higher demand for land does not necessarily lead to a supply-side response and release of more land for sale (KPMG and Shelter, Citation2015). KPMG and Shelter (Citation2015) and McGuinness et al. (Citation2018) agree that although the planning system provides a political mechanism for allocating land, the system itself is not responsible for low land supply.
A restrictive planning system and the volatility of land prices have resulted in housebuilders becoming ‘inherently land focused’ in their business models (Adams et al., Citation2008). As the housing crisis has worsened, the topic of ‘land banking’ has become increasingly politicized. The Housing White Paper (DCLG, Citation2017a) claimed that ‘land banking has been detrimental to the housing market’ with a delayed output of housing leading to an increase in property values. Major housebuilders are often accused of not building on the land for which they have planning permission and of not building it out as quickly as possible, rather they are drip feeding housing into the market to avoid oversupply that would reduce prices and rates of return (McGuinness et al., Citation2018).
Whilst it is generally accepted that housebuilders need to hold a supply of land with planning permission to ensure a steady supply and output (Burroughs, Citation2015), accusations of land hoarding are provoked by the size of the land banks that developers hold back, particularly when land already has planning permission. The size of developer land bank depends on the length of the ‘development pipeline’. Quite simply, in order to maintain a steady state, housebuilders need to purchase a new plot each time a house is sold (Chamberlain Walker Economics, Citation2017). However, the number of planning approvals has always exceeded the number of housing starts; for example, in the 10 years from 2006 to 2015, planning permission was granted for over 2 million dwelling houses in England, but there were only 1.26 million starts within the same period (Bentley, Citation2016). In 2016, 262,000 new homes were granted planning permission; however, just 142,000 got underway (Chamberlain Walker Economics, Citation2017). What has happened to the remaining permissions granted?
confirms that the three largest housebuilders in the UK each hold up to 5 years of permissioned land. However, this is a small land bank relative to their level of completions (Chamberlain Walker Economics, Citation2017; House of Commons, Citation2017). Developers’ ‘strategic land banks’ are often held under option, which means that they are not recorded as being in the housebuilders' ownership, and there is no public record of how large their strategic land banks are (KPMG and Shelter, Citation2015).
Table 1. Land holdings and completions by major UK housebuilders 2015
Archer and Cole (Citation2016) noted that housebuilders use land banks to control the flow of new housing into local markets, strengthening their negotiating position with landowners and protecting against volatility and securing sales. Volume House Builders have been clear that their business model relies on building and selling houses rather than speculating on land (Lyons, Citation2014). Letwin (Citation2018b) confirms that there is no evidence that major housebuilders are financial investors that seek to make a business out of speculatively holding land as their business models depend on generating profits out of house sales, rather than the increasing value of landholdings. Rather, it is the profitability of the sale of housing that they are trying to protect by building only at the ‘market absorption rate’ for their products. Where land is in short supply, and there is strong competition between developers, housebuilders must assume the highest possible sale prices in order to make winning bids for land. These bids are viable only because the release of land is restricted, and the build-out rate of houses is managed by builders themselves to achieve the target sales rates underpinning earlier bids for land.
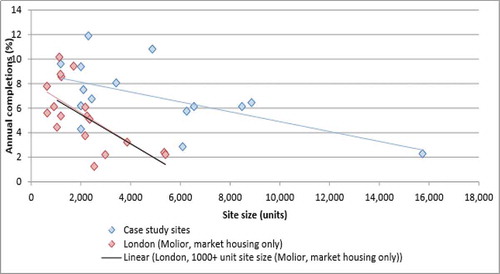
Letwin (Citation2018b) reported that the size of sites has a negative correlation with the rate of build-out, with build-out rates on smaller sites intrinsically likely to be relatively quicker than on large sites as displayed in (Letwin, Citation2018b). In other words, smaller sites are built out more quickly and have faster absorption rates, e.g. higher percentage of housing units are sold in a shorter space of time, whilst larger sites generate nominally more completions and sales but at relatively slower rates.
Figure 3. Size of Site (Units) Compared to Annual Completions (percentage). Source: (Letwin, Citation2018b)
With a single housebuilder occupying the whole of a large site, the homes on offer are typically homogenous. According to Letwin (Citation2018b), the type of home (size, design, context and tenure) currently appears to largely determine the absorption rate of homes sold on a site. The absorption rate on a site is affected by the ‘number of outlets’; this includes the physical locations of different points of sale on a site but also the type of house and the difference in the products on offer. Even slight variations in products create additional demand and therefore a higher absorption rate, possibly leading to a higher build-out rate (Letwin, Citation2018b).
With fairly homogenous products being built by the same housebuilder on one large site, limiting absorption rates, it is fair to assume a mix of housebuilders building on smaller ‘packages’ of a large site would deliver a greater variety of product, addressing a range of markets simultaneously. Whilst Letwin (Citation2018b) proposed this theory, he was unable to demonstrate any proof, a deficiency that this research seeks to address.
In summary, Letwin’s (Citation2018b) study suggested that:
Housebuilders will only build at a rate at which they believe the houses will be absorbed by the market in order to maintain a return on capital and steady cash flow, implying that absorption rates dictate the rate at which new homes are delivered to the market.
In order to accelerate the rate at which houses are absorbed, yet allow housebuilders to maintain their profit percentage, a more diverse range in products and outlets should be built.
A wide product range will attract multiple purchasers allowing multiple houses to be sold simultaneously without oversaturating the market.
Letwin’s (Citation2018b) study of build-out was based on case study data from 15 large sites, 5 of which were in Greater London, 9 in southern England and a single site in the north west and included forecasts of future delivery rather than solely built and sold evidence. The study fails to investigate build-out rates across a range of sizes of sites in locations that may have different exogenous factors uniquely linked to their location. In 2020, Lichfields (previously Nathanial Lichfield and Partners) updated their original 2016 ‘Start to Finish’ survey of build-out rates (NLP, Citation2016), with expanded coverage of 97 larger housing development sites of over 500 units across England and Wales. Despite being unable to secure completion figure that matched Letwin’s study, Lichfields (Citation2020) are careful not to criticize Letwin’s findings, claiming that their research, which relies exclusively on what has been built and sold, complements rather than supplants the latter.
The next section sets out the methodology deployed by this study to investigate build-out rates and diversity of product in the North of England that seeks to test Letwin’s hypotheses and address some of the deficiencies of previous studies.
Methodology
Most areas in the north of England have less dynamic housing markets in comparison to those in the south-east (McGuinness et al., Citation2018). The focus of this study will therefore be on the build-out rates and factors affecting housing output in the North of England, in particular the Leeds City Region (LCR) which comprises the following local authorities: Barnsley; Bradford; Calderdale; Craven; Harrogate; Kirklees; Leeds; Selby; Wakefield and York. Four LPAs were selected for detailed analysis based on the following indicators: status of Local Plan; housing affordability as represented by HPE ratio; 5-year land supply and Index of Multiple Deprivation Score (see ).
Table 2. Profile of LPAs selected for study
The selected LPAs are at different stages in adopting their new Local Plans. At the time of study, Kirklees and Barnsley were the only two LPAs that have adopted Local Plans although they have now been joined by Craven. Leeds has an adopted Core Strategy and is in the process of updating supplementary policy documents, Bradford, Harrogate, Wakefield and Calderdale are looking to adopt plans in 2020. Selby and York have experienced delays in new plan preparation and are operating on adopted plans from 2008 and 2005, respectively. York is also the only LPA without a calculated 5YHLS due to a lack of data. A high affordability (HPE) ratio is an indication that insufficient housing units are being built to satisfy demand. The Index of Multiple Deprivation (IMD) score was used as a reliable indicator of relative deprivation to ensure representation of a breadth of socio-economic circumstances.
Land Registry sales data, including address (postcode), tenure and sale date, for new build residential units for an 11-year inclusive period for each Local Authority were downloaded from the Land Registry. The time span was adopted to cover the period from the credit crunch and recession in 2009, providing 4 years of data before the introduction of NPPF in 2012. This yielded a total of approximately 22,000 residential sales over the 11-year inclusive period.
The Land Registry data contains information for each individual new build house sale. The data were sorted by postcodes to determine which sales were part of the same development and displayed by pinning each postcode on Google Earth open source mapping application. By using detailed and up-to-date satellite imagery it was possible to determine whether developments were separate or multi-phase, to avoid double counting, with each separate development being given a unique identifier. Residential developments with new postcodes, not recognized by Google Earth, were manually located by street name. Small developments of one or two houses were excluded from the analysis due to risk of skewing of the data towards bespoke and self-build projects and because small developments have little or no diversity.
Once all sales had been allocated to development, the number of sales, average rates of sales per month, diversity by house type (flat, terrace, semi-detached and detached) and tenure (freehold and leasehold) were calculated. The percentage of the site built out each month was also calculated in order to capture the relative size of developments.
It should be noted that currently, the Land Registry does not record the type of tenure of new-build sales, characterizing them as only freehold or leasehold, without identifying whether they are social rented or intermediate housing.
A diversity index was used to represent the profile of residential units across each category of house type. There are several diversity indices, most commonly used are Simpson’s Index, Shannon’s Index and Brillouin’s Index. Simpson’s Index is considered a dominance index because it weights towards the abundance of the most common category. It gives the probability of any two individual sales drawn at random from an infinitely large sample belonging to different categories. The Shannon Index belongs to a subset of indices that maintain that diversity can be measured and is affected by both the number of categories and the equitability or evenness of these; however, it assumes the collection of data is a random sample.
The Brillouin index measures the diversity of a collection, as opposed to the Shannon Index which measures a random sample of a collection. Pielou (Citation1975) recommends that the Brillouin index is used in all situations where a collection is made, sampling is non-random or the full composition of a ‘community’ is known. Therefore, the Brillouin index was adopted for this study which is represented by the following equation:
(Zaiontz, Citation2019)
where ni is the number of observations from the sample in the ith of k (non-empty) categories and n is the sample size (Zaiontz, Citation2019), making it possible to test the ‘evenness’ and equitability by comparing the actual diversity to the maximum possible diversity. The more even the distribution among the categories the more diverse a group is (Zaiontz, Citation2019). The maximum value of H is:
(Zaiontz, Citation2019)
Brillouin’s index of relative diversity is J = H/Hmax. This equation for J was used for each of the developments, the closer this value is to 1, the more evenly diverse the group is. Once a measure of diversity was ascertained for each, it was then possible to test the relationship between the diversity of each development and the average absorption rate as calculated.
Statistical Analysis
The compiled dataset was analysed in MSExcel using univariate linear regression and Pearson’s correlation to test whether there is a correlation between the absorption rates of a development and house type diversity, tenure diversity and size. Pearson’s correlation coefficient investigates the relationship between two quantitative, continuous variables, hence why it has been used for this study. A perfectly negative correlation would result in a value of −1, a perfectly positive correlation would result in +1 and no correlation at all would be 0.
The results are processed into a table of coefficients that can be interpreted to identify how much the dependent variable (absorption rate) changes due to the variables being tested (size, diversity). The significance of these variables can be calculated through an analysis of variance (ANOVA) test. This determines whether a statistically significant correlation exists between the variables being tested. It should be noted that with a large sample, a low strength of correlation can still be highly statistically significant.
Limitations and Validity
Land Registry data have a 3-month time lag which means that developments being sold or under construction at the time of analysis may record a lower total number of units. However, due to the large 11 year dataset being used, such anomalies will have little impact on the internal validity of the results. Another temporal aspect of the data was the time lag between full planning permission and commencement and completion of different phases of some developments. Further, when comparing land registry figures and Google Earth imagery, it became apparent that some sales were potentially missing from Land Registry data, particularly flats and apartments. It was unclear whether this was a consequence of delayed recording by Land Registry or units being build-to-let thus retained by developers. Reconciling this discrepancy would have required cross-checking developments against individual planning applications which, it was decided, would have proved unduly time consuming and laborious.
Results
The extensive study captures 711 developments comprising just under 22,000 unit sales, with the average size of development being approximately 31 dwellings (see ); Leeds had the most developments, units and largest average size whilst Harrogate recorded the lowest in each respect.
Table 3. Number of development, total units and average size of development by LPA
Measuring House Type and Tenure Diversity
The mix of house types sold within each LPA is broadly similar with 36% of sales being flats, 23% detached houses, 12% semi-detached at 20% terraced (see ). When profiled by LPA, both York and Leeds record higher relative numbers of flat sales (61% and 42%, respectively) with York also recording the lowest percentage of detached, semi-detached and terraced new build homes. In contrast, Harrogate had the largest proportion of detached homes, at 38% and the most balanced spread of housing type overall. All LPAs have a higher proportion of freehold home than leasehold with the exception of York which has had 62% leasehold sales and 38% freehold. Barnsley had the lowest proportion of leasehold new build sales at 17% and the least even tenure mix. Leeds has the most balanced tenure mix with 45% leasehold and 55% freehold sales.
Overall, the LPAs have a total house type diversity measure of 0.979 and a total tenure diversity measure of 0.972 (). The diversity scores for the four LPAs combined are higher and closer to 1 because it represents a larger and more diverse spread of type and tenure than calculations for individual LPAs (see ). A combined diversity score of 2 would represent a perfectly diverse range of house types and tenures.
Table 4. Results for Brillouin’s index of relative diversity for house types and tenures by LPA
Harrogate has the most evenly distributed house type sales with a measure of 0.961, followed by Leeds and Barnsley, with York recording the lowest type diversity measure of 0.782. Leeds has the highest tenure diversity measure at 0.992, followed by York and Harrogate, with Barnsley having the least diverse tenure mix at 0.666. Overall Leeds records the highest combined diversity measurement of 1.942. Barnsley has the least diverse mix of products with a measure of 1.612, with York and Harrogate falling in between with measures of 1.737 and 1.886, respectively. The total diversity score is higher than for individual local authorities because the larger population contains a greater diversity of product.
Measuring Absorption Rates
Harrogate has the lowest average number of unit sales per month at approximately 8; in contrast, Leeds records 95 unit sales per month over the period of study; however, in order to compare the relative rate of sales, the average percentages of sites/plots sold per month were calculated (see ).
Table 5. Average monthly sales and percentage of site sold by LPA
The slowest absorption rate is in Barnsley with approximately 17% of units being sold on average per month. York and Harrogate recorded almost identical absorption rates at 21.75% and 21.74%, respectively.
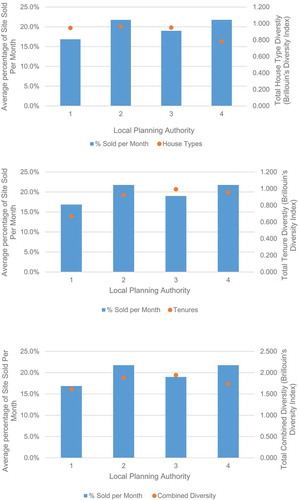
When comparing the average rate of absorption and diversity of house types and tenure (see ) there appears to be little relationship between the average percentage of a development sold per month and the house type diversity, with the least diverse LPA of York recording the highest average percentage unit sales per month. Conversely, Harrogate had the most diverse house types but the second highest average percentage of a site sold per month. However, there does appear to be a relationship between the level of tenure diversity and the average percentage of development sold per month, with higher average tenure diversity coinciding with higher average percentage sold per month, the exception being Leeds which had a diverse tenure mix but a lower average absorption rate.
Figure 4. (a,b,c) The average rate of absorption and Brillouin’s Index for house type, tenure and combined diversity for (1) Barnsley, (2) Harrogate,(3) Leeds and (4) York
Comparing absorption rates and development diversities before and after the introduction of the NPPF in 2012 should reveal whether its introduction has accelerated absorption rates and resulted in more diverse developments. The data covers 50 months before the NPPF was introduced and 81 months after. The results are displayed in .
Table 6. Summary of results for new build sales pre-NPPF
Table 7. Summary of results for new build sales post-NPPF
Average development size and units sold per months are both higher post NPPF; however, whilst the average percentage of a site sold per month increased in Leeds and York, it decreased in both Barnsley and Harrogate. Similarly, the diversity of developments in terms of both house type and tenures increased for Leeds and York post NPPF but decreased in Barnsley and Harrogate.
Testing the Relationship between Absorption and Diversity
summarizes outputs of the statistical tests for all the data from all the LPAs combined, which has been colour coded based on the strength of the association. There were no coefficients with a high strength of association. All the Pearson coefficients have a negative association, with the exception of the size of the site compared to the average sales per month which confirms that developments with more units generate higher sales per month.
Table 8. Outputs of Pearson and regression tests – all new build sales; all LPAs combined (low strength association in yellow; no correlation in orange)
When comparing the absorption rates to diversity values, Pearson’s coefficient was expected to be positive and close to 1, indicating a strongly associated positive correlation; however, results suggest the opposite. There is a low strength of association between the absorption rates (both units per month and percentage per month) and the diversity of a development, and the correlation is negative suggesting that absorption is higher for a less diverse range in product.
Standard regression tests resulted in low R-Squared values, indicating a high variance in the data points around the linear regression line, confirming a weak relationship between variables. The lowest of these was between the tenure diversity and number of units sold per month at 0.37%, this is in-line with the output of the Pearson model which indicates no relationship. The highest values are with the size of the site compared to the average number of sales per month at 7.31%, the house type diversity and the average percentage of a site sold per month (7.35%), and the total diversity of a site compared to the average percentage sold per month (7.37%). Although R-Squared values are low, suggesting weak relationships between variables being tested, some variables are still statistically significant, meaning the results provide sufficient evidence to test the hypothesis. P-values were calculated to test whether Regression outputs could have been obtained by chance, the results of which (see ) demonstrate that there is strong evidence to suggest relationships between variables are statistically significant, with the exception of average sales per month and tenure diversity.
Table 9. P-values for regression outputs
Discussion
Detailed interrogation of literature on planning for residential development revealed that one of the alleged reasons why the UK languishes behind most European countries in respect of both housing stock and dwellings completed per capita (see Linhart et al., Citation2020), that LPAs consent insufficient land for housing, increasing land and house prices, is beginning to be challenged. Oliver Letwin’s (Citation2018a, Citation2018b) review of build-out rates confirmed that large volume housebuilders, in order to maintain a return on capital and steady cashflow, will only build at rates at which housing units will be absorbed by the market. Letwin (Citation2018a) went on to propose that, in order to accelerate the rate at which homes are absorbed, whilst allowing housebuilders to maintain their profit margins, a more diverse range of housing product needs to be built; the theory being that a larger product range will attract a wider range of consumers, allowing multiple homes to be sold simultaneously without saturating the market. The Letwin (Citation2018a, Citation2018b) Review’s research was partial, being limited to only 15 large residential developments, 14 of which were in London and the South East of England, with only a solitary example from the North West. Our detailed empirical study of four LPAs in Leeds City Region using house sales data over an 11-year period seeks to address the deficiencies and limitations of the Letwin review, by investigating build-out rates and absorption rates across a wide range of sites across a variety of locations over a long period.
The research confirmed wide differences between the four LPAs in terms of the total number of units sold, average size of developments, nominal and relative number of new build units sold per month and diversity of house types and tenures. The differences between LPAs reflect, to some extent, the status of their Local Plans; for example, there have been few new build homes built in York over the 11-year study period, in part, because there is no adopted Local Plan, therefore no allocated land for housing, 5YHLS or housing mix policy; what development there has been is predominantly apartment buildings on brownfield sites in the centre of York. Absorption rates have remained high, regardless of house type, because of high housing demand. Leeds, by contrast, despite having an adopted Local Plan and Core Strategy containing housing mix policy and allocated land for housing, along with a 5YHLS, facilitating a high number and diverse range, type and tenure of new build housing units, recorded lower relative rate of house sales.
As stated in the introduction, Letwin’s (Citation2018a) review suggested that an increase in the diversity of a residential development would increase rates of absorption and that smaller development has faster absorption rates. The study tested the hypotheses that greater diversity of house type and tenure results in increased absorption and build-out rates and that small residential development sites are absorbed and built-out more rapidly than larger sites. This finding is also consistent with findings from Lichfields (Citation2020) survey of large-scale housing sites that confirmed that sites with additional outlets (used as a proxy for diversity) have faster build-out rates and that sites with more affordable housing (again an indicator or diversity) were built out at up to twice the rate than sites with lower (<30%) levels of affordable housing.
There was a positive correlation between the size of a development and the number of units sold per month which is simply due to there being more units for sale on larger sites and therefore more units sold per month. The negative correlation between the percentage of a development sold per month and the size of the development is due to a larger proportion of smaller sites being sold per month than larger ones. This is also in line with the results seen by Letwin (Citation2018b) in which the percentage of a site sold and the size of a development were compared. The build-out rates for smaller sites were shown to be intrinsically faster than for larger sites, supporting Letwin’s analysis.
If Letwin is correct, then there should also be a positive correlation between the diversity score and absorption rates, however, the opposite was observed, indicating that the less diverse the house type range, the faster the absorption rate. Although the relationship is weak in all LPAs, it is identified as significant with the exception of York, which may be due to the aforementioned combination of planning and market conditions.
The results of the regression test for the LPAs combined suggest that whilst relationships are fairly weak, they are unlikely to have occurred by chance. The only relationship that cannot be accepted is between tenure diversity and number of sales per month (P-value of 0.10419 shown in orange in ). Letwin’s proposition that residential developments with higher diversity have higher rates of absorption, according to our analysis of four LPAs in Leeds city Region, is disproven by regression analysis that reveals that developments with lower diversity have higher absorption rates. The hypothesis relating to the size of the developments is neither proven nor disproven due to insignificant correlation results, suggesting further investigation using more nuanced tenure data is required to determine whether more diverse range in tenures accelerates absorption rates.
There are many endogenous and exogenous variables that affect the rate at which houses are sold including the size, number of beds, number of bathrooms, quality of building, number of car parking spaces, access and location. Such variables are not made available by the Land Registry for security reasons. Other factors such as local economic conditions, (un)employment rates and mortgage availability will also affect the rate at which homes are absorbed into the market. Such variables did not form the basis of this investigation but could be incorporated into further studies.
In terms of policy recommendations, the study suggests that increasing the number of small residential sites may accelerate absorption rates due to enhanced variety of locations and products on the market simultaneously. This finding would support measures intended to break the oligopoly of the volume housebuilders and provide more opportunity for small housebuilders to enter the market such as recent revisions to the NPPF (MHCLG Citation2019) that introduced the need to calculate housing need and requirement for Councils to identify 10% of their housing requirement on sites no larger than 1 ha. The research also supports increased diversification of tenure, including more affordable housing, as a way of increasing speed of build-out and absorption, consistent with the findings of Lichfields’ recent study. However, it should be cautioned that it is not necessarily the ‘evenness’ of a development that allows for accelerated absorption rates, but building the right type of homes to meet the demands in a specific location. As seen in York, a less diverse product range had a higher absorption rate than other LPAs with more diverse ranges. This also suggests that, where demand is high, the house type does not necessarily influence absorption as new build units will sell almost regardless of type.
In summary, the study has revealed that Letwin’s generalized theory, based on data from development sites predominantly in the south of England, does not hold across other parts of the UK such as the North of England. Absorption rates are influenced by highly variegated endogenous and exogenous factors, relating to local demand, need and land supply; thus, housing and planning policy measures and interventions required to accelerate local absorption rates will vary between locations. Whether the latest UK Government planning reforms, set out in Planning for the Future White Paper (MHCLG Citation2020a), will address the current insensitivity of England’s National Planning Policy Framework to local housing market characteristics and housing needs is debatable, especially when it contains a proposal for a binding housing requirement to be set at the national level (MHCLG Citation2020b).
Disclosure Statement
No potential conflict of interest was reported by the author(s).
References
- Adams, D., Cartlidge, L., Leishman, C., & Watkins, C. (2008) Understanding Builder to Builder Residential Land Transactions, (London: Department for Communities and Local Government).
- Adams, D., & Leishman, C. (2008) Factors affecting housing build-out rates, CLG Housing Markets and Planning Analysis Expert Panel. Department of Urban Studies, Glasgow: University of Glasgow.
- Archer, T., & Cole, I. (2016) Profits before Volume? Major House Builders and the Crisis of Housing Supply, pp. 4 (Sheffield: Centre for Regional Economic and Social Research (CRESR), Sheffield University).
- Ball, M. (2010a) Housing supply and planning controls, National Housing and Planning Advice Unit, Fareham: NHPAU.
- Ball, M. (2010b) The housebuilding industry: Promoting recovery in housing supply. Available at http://webarchive.nationalarchives.gov.uk/20120919132719/http:/www.communities.gov.uk/documents/housing/pdf/1526670.pdf (accessed 25 August 2018).
- Barca, F., McCann, P., & Rodriguez-Pose, A. (2012) The case for regional development intervention: Place-based versus place-neutral approaches, Journal of Regional Science, 25, pp. 134–152.
- Barker, K. (2004) Review of housing supply. Delivery stability: Securing our future housing needs, Barker Review, March. London.
- Bentley, D. (2016) Planning Approvals vs Housebuilding Activity 2006–2015. Briefing Note August 2016, (London: Civitas).
- Bentley, D. (2017) Building Homes Faster? A Commentary on the Government’s Plans for Increasing the Pace of Development, (London: Civitas).
- Bramley, G. (2018) How much housing do we need? I-Spere Blog. Heriot Watt University. Edinburgh. available at https://www.i-sphere.hw.ac.uk/how-much-housing-do-we-need/ (accessed 26 March 2020).
- Bramley, G., & Watkins, D. (2016) Housebuilding, demographic change and affordability as outcomes of local planning decisions: Exploring interactions using a sub-regional model of housing markets in England, Progress in Planning, 104, pp. 1–35.
- Burroughs, L. (2015) Getting houses built. How to accelerate the delivery of new housing, Foresight Paper No. 4, London: CPRE.
- Calcutt, J. (2007) The Calcutt Review of House Building Delivery, (London: DCLG).
- Chamberlain Walker Economics. (2017) The Role of Land Pipelines in the UK Housebuilding Process, (London: CWE).
- Conservative Party. (2017) The Conservative Party Manifesto 2017, May 18, p 70.
- Department of Communities and Local Government. (2012) National Planning Policy Framework, (London: DCLG).
- Department of Communities and Local Government. (2015) Building More Homes on Brownfield Land: Consultation Proposals, (London: DCLG).
- Department of Communities and Local Government. (2017a) Fixing our broken housing market, Cm9352, London: DCLG.
- Garton-Grimshaw, G., Sutherland, N., & Wilson, W. (2019) Housebuilding targets, Debate Pack CDP 2019-0147, London: House of Commons Library.
- GOV.UK. (2019) Guidance: Housing supply and delivery – Guidance on 5 year housing land supply and housing delivery test. Available at https://www.gov.uk/guidance/housing-supply-and-delivery (accessed 27 March 2020).
- Griffith, M., & Jefferys, P. (2013) Solutions for the Housing Shortage, (London: Shelter).
- HM Government. (2011) Localism Act, (London: HMSO).
- HM Treasury. (2017) Autumn budget 2017, Policy Paper HC587, London: HM Treasury.
- Holmans, A. (2013). New estimates of housing demand and need in England, 2011 to 2031. Town and country planning, Tomorrow Series Paper 16, London: TCPA.
- House of Commons. (2017) Capacity in the homebuilding industry. Communities and Local Government Committee, Tenth Report of Session 2016-17, London: HMSO.
- House of Lords Select Committee on Economic Affairs. (2016) Building more homes, HL paper 20, London: HMSO.
- KPMG and Shelter. (2015) Building the Homes We Need, (London: Shelter).
- Letwin, O. (2018a) Independent review of build out: Final report, CM9720, London: Ministry of Housing, Communities and Local Government.
- Letwin, O. (2018b) Independent review of build-out rates, Draft Analysis, London: Ministry of Housing, Communities and Local Government.
- Lichfields. (2019) Planned up and be counted: Local plan-making since the NPPF 2012, Insight, January. London: Lichfields.
- Lichfields. (2020) Start to Finish: What Factors Affect the Build-out Rates of Large-scale Housing Sites? Second ed. Insight Series, February (London: Lichfields).
- Linhart, M., Hana, P., Zesebit, I., & Marek, D. (2020) Deloitte Property Index: Overview of European Residential Markets., 9th ed. July (Prague, Czech Republic: Deloitte).
- Lyons, M. (2014) Mobilising across the Nation to Build the Homes Our Children Need, The Lyons Housing Review, London: The Labour Party.
- McDonald, N., & Whitehead, C. (2015) New estimates of housing requirements in England, 2012–2037 Town & Country Planning Tomorrow Series Paper 17. London: TCPA
- McGuinness, D., Greenhalgh, P., & Grainger, P. (2018) Does one size fit all? Place-neutral national planning policy in England and its impact on housing land supplies and local development plans in North East England, Local Economy, 33(3), pp. 329–346.
- McKibbin, D. (2018) Housebuilding in the UK Debate on 11 January 2018, House of Lords, January. London: HMSO.
- Ministry of Housing, Communities and Local Government. (2018) National planning policy framework, Cm 9680, London: MHCLG.
- Ministry of Housing, Communities and Local Government. (2019) National planning policy framework, CP 48, London: MHCLG.
- Ministry of Housing, Communities and Local Government. (2020a) Planning for the Future: White Paper August 2020, (London: MHCLG).
- Ministry of Housing, Communities and Local Government. (2020b) Changes to the Current Planning System: Consultation on Changes in Planning Policy and Regulations., (London: MHCLG).
- Nathanial Lichfield and Partners. (2016) Start to finish: How quickly do large-scale housing sites deliver? Targeted Research and Intelligence Programme, London: NLP.
- National Housing and Planning Advice Unit. (2008) Meeting the Housing Requirements of an Aspiring and Growing Nation: Taking the Medium and Long Term View, (London: NHPAU).
- Pielou, E. C. (1975) Ecological Diversity, (New York: John Wiley & Sons).
- Savills. (2017) Spotlight planning: Planning to solve the housing crisis. Available at www.pdf.euro.savills.co.uk/uk/spotlight-on/spot light-planning-to-solve-the-housing-crisis.pdf (accessed 16 August 2018)
- Wilson, W. (2019) Stimulating Housing Supply – Government Initiatives in England, Briefing Paper Number 06416, London: House of Commons Library.
- Wilson, W., & Barton, C. (2018). Tackling the Under-supply of Housing in England, Briefing Paper Number 07671, London: House of Commons Library.
- Wilson, W., & Barton, C. (2020) Tackling the Under-supply of Housing in England, Briefing Paper Number 07671, London: House of Commons Library.
- Zaiontz, C. (2019) Real Statistics using Excel. Available at http://www.real-statistics.com/descriptive-statistics/diversity-indices/shannons-diversity-index/ (accessed 8 April 2019).