
ABSTRACT
Background: The clinical diagnosis and management of patients with sport-related concussion is largely dependent on subjectively reported symptoms, clinical examinations, cognitive, balance, vestibular and oculomotor testing. Consequently, there is an unmet need for objective assessment tools that can identify the injury from a physiological perspective and add an important layer of information to the clinician’s decision-making process.
Objective: The goal of the study was to evaluate the clinical utility of the EEG-based tool named Brain Network Activation (BNA) as a longitudinal assessment method of brain function in the management of young athletes with concussion.
Methods: Athletes with concussion (n = 86) and age-matched controls (n = 81) were evaluated at four time points with symptom questionnaires and BNA. BNA scores were calculated by comparing functional networks to a previously defined normative reference brain network model to the same cognitive task.
Results: Subjects above 16 years of age exhibited a significant decrease in BNA scores immediately following injury, as well as notable changes in functional network activity, relative to the controls. Three representative case studies of the tested population are discussed in detail, to demonstrate the clinical utility of BNA.
Conclusion: The data support the utility of BNA to augment clinical examinations, symptoms and additional tests by providing an effective method for evaluating objective electrophysiological changes associated with sport-related concussions.
Introduction
According to the Centers for Disease Control and Prevention (CDC), concussions are a significant public health and socioeconomic concern in the US. It is estimated that 1.6–3.8 million sport-related concussions occur each year in the US, accounting for 8.9–13.2% of high school injuries and 7.9% of collegiate injuries [Citation1–Citation4]. Concussions are heterogeneous injuries involving physical, cognitive, emotional and behavioural symptoms. As such, current approaches to assess and monitor recovery are based on a thorough clinical evaluation of the injury, symptoms and risk factors, as well as multifaceted measures of neurocognitive, balance, vestibular and oculomotor impairment [Citation5,Citation6]. However, the clinical presentation of concussion is highly individualized, with symptoms and impairments often evolving over time. The non-specific nature of associated symptoms can reduce the accuracy of concussion assessments such as symptom checklists and clinical interviews [Citation7]. In addition, some tools that assess concussion measure indirect behavioural performance related to underlying brain injury rather than directly measuring the underlying brain injury itself with neurophysiological approaches. In order to better capture the heterogenic presentation of concussion and corroborate current behavioural assessments, additional tools are warranted that focus on objectively measuring the neurophysiological changes of concussion.
One approach that has shown promise in measuring the neurophysiological effects of concussion involves the use of event-related potentials (ERPs). The use of ERPs may augment clinical assessments and provide direct evidence of the clinical pathologies that underlie cognitive and other deficits, which may not be evident using other approaches [Citation8]. Previous studies suggest that ERPs may serve as an objective index for chronic cognitive dysfunction associated with concussion and may also be correlated with symptoms [Citation9,Citation10]. Importantly, researchers have suggested that a neuronal network deficiency may be involved in concussion [Citation11,Citation12]. Specifically, changes were observed in patients with mild traumatic brain injury (mTBI) that included alterations in long-distance cortical functional connectivity as well as of interhemispheric connectivity and a departure from small-world like network configuration [Citation11,Citation12]. In spite of these sparse findings, there is still no objective physiological marker for concussion.
Brain Network Activation (BNA) analysis is a novel technology that may help detect changes in brain activity and functional connectivity in patients with concussion. BNA is a high-density, multi-channel electroencephalogram (EEG-ERP) mapping and analysis tool [Citation13–Citation17] that evaluates network dynamics associated with brain responses. As a first step, BNA analysis reveals functional networks of brain activity that are common to a reference group of healthy subjects (Reference Brain Network Model; RBNM) for a specific state or experimental condition. Each RBNM is a spectro-spatio-temporal activity pattern, specific for a certain experimental condition/cognitive function. The oddball RBNM used hereby has been established prior to the current investigation on a large group of healthy subjects [Citation18] (see Methods). This network could serve as a normative reference network for identifying changes in a patient’s brain activity over time. At a second stage, a BNA score is produced for the participant at each evaluation session, which reflects the percentage of similarity between him and the RBNM. BNA scores can be monitored over time to track changes towards or away from the reference network.
BNA analysis addresses the traditional weaknesses of EEG/ERP by standardizing the data acquisition, separating noise and signal and developing normative or other complex reference brain networks. Unlike other EEG/ERP-based analytical methods, BNA analysis does not evaluate the individual in terms of discrete values such as ERP amplitude, ERP latency, frequency-band power, phase-coherence and so forth. Rather, it quantifies the overall similarity of the individual’s electrical activity in response to a cognitive task to a previously defined invariant model response that serves as a reference, which characterizes the majority of the normal population’s brain network activity in response to the same cognitive task (the RBNM). Relying on this comparison, the BNA algorithm can track dynamic network organization in high temporal resolution using a three-dimensional formal graph representation system that depicts the evolution of event pairs in different spatial locations and frequency bands. Hence, the focus of BNA analysis is not on discrete parameters of EEG activity (such as spectral power), but on the entire network configuration, which is compared across different groups and conditions. In addition, the BNA system enables the stratification of populations into discrete sub-groups as well as a multidimensional assessment of treatment outcomes. For example, in a previous study involving patients with concussion, BNA analysis revealed that a sub-group of patients with post-traumatic migraine demonstrated a different recovery trajectory relative to patients without a migraine [Citation18]. The purpose of the current study was to examine the utility of BNA analysis as an assessment tool for concussion in young athletes. This study also demonstrates its clinical utility via the presentation of representative case studies. It is argued, through the group results and the individual cases, that the BNA adds an objective, physiologically-based marker for concussion that augments current approaches to assessing this injury.
Methods
Participants
Two studies were performed concurrently at the University of Pittsburgh Medical Center (UPMC) and the University of Michigan Health System (UMHS). Both were two-arm, prospective studies conducted to evaluate the utility of BNA analysis to assess young athletes recovering from concussion.
A total of 167 subjects between the ages of 14–24 years participated in the study. Eighty-six athletes with a concussion were included in the study, with an average age of 16.4 (2) years [data are represented as average (SD)]. The control group consisted of 81 individuals with an average age of 17.4 (2.7) years. Controls were recruited via flyers and announcements at the sports teams’ institutions. The data from nine subjects in the control group and six subjects in the concussion group were rejected from analysis prior to BNA computation due to noisy EEG data, resulting in data from 80 individuals in the concussion group and 72 individuals in the control group for the final analysis (see ). Inclusion criteria were: sport-related head injury that occurred between 2–10 days prior to evaluation for inclusion in the study and symptomatic. Exclusion criteria, for patients and controls, were: a history of severe TBI or brain surgery, a history of mild TBI in the past 6 months, any neurological or psychiatric disorder, substance abuse or current use of any medication affecting the central nervous system, as reported by the subjects. At both sites, patients were recruited through the Certified Athletic Trainers (ATCs) who delivered reports from the sports field to the treating clinic following the subject’s head injury. Medical professionals (e.g. neuropsychologist, physician) trained in concussion assessment and management diagnosed the subjects with a concussion who were included in this study. Data from the two sites were combined into a common dataset for further analysis (hereafter, pooled dataset).
Table 1. Participating patients and control subjects from both sites.
Subjects were followed over four visits after the head injury. At both sites, the first evaluation was performed between 2–10 days after the concussion (mean days from injury: UPMC = 4.1; UMHS = 3.2). The first follow-up visit (visit two) was performed 7 (±2) days following the first visit (UPMC) or at when the subject was asymptomatic (UMHS; mean days from visit one = 17.2). Subjects in the control group were matched with subjects in the concussion group for the time elapsed between visits. See Supplementary material for a flowchart of data collection across the two sites.
The poolability for the data from the first two visits across the two sites was statistically confirmed with t-tests on the amount of days elapsed for subjects in the control and concussion groups (ns). For further information regarding the poolability of the two studies, see sub-section ‘Poolability assessment of the two datasets’ in the Supplementary material. Two more visits were performed at each site—visits three and four. UPMC visits three and four were performed 7 (±2) days from the previous one, whereas at UMHS, the third was performed upon return to play (mean days elapsed from visit two = 26.3) and the fourth visit was performed a month after return to play (mean days elapsed = 27.5). Results of poolability t-tests indicated that these two later visits were not poolable because of the time elapsed between sessions and, therefore, this study presents the outcomes from visits one and two only. It is noted, however, that visits three and four did feature a statistical coherency between subjects in the control and concussion groups in the days elapsed from the previous visit within each site. See Supplementary Material for details and for complementary numerical results for visits three and four.
In each visit, subjects reported their symptoms either via the Post-concussion Symptoms Scale embedded in the Immediate Post-Concussion Assessment and Cognitive Testing (ImPACT) [Citation19,Citation20] or via the Sports Concussion Assessment Tool (SCAT) [Citation21]. Both scales include 22 symptoms that are ranked on severity between 0 (none) to 6 (severe), with a resulting total score ranging from 0–132. In addition, all patients had a clinical evaluation for their injury and a BNA test. The study was approved by the Institutional Review Boards (IRB) at both institutions.
Measures and instrumentation
Cognitive task
The auditory oddball task is a classic paradigm that has been used extensively in neurocognitive studies and in subjects who were neurologically compromised [Citation22]. During the oddball task, subjects were seated in front of a computer screen and were asked to respond with a key press of their right index finger to a target tone of 1000 Hz, which occurred in 10% of all trials. Two other tones composed the remaining 90% of the trials: a frequent tone at 2000 Hz, which occurred in 80% of all trials, and a rare (or novel) stimulus which was presented in 10% of the trials, consisting of complex environmental sound samples from six categories: bird calls, animal sounds, machine noises, music, human noises and electronic sounds. Each presentation of the tones lasted for 120 milliseconds at an intensity of 70 dB SPL, from bi-lateral speakers located at the sides of the computer. The inter-stimulus interval was set to 1500 milliseconds. A total of 600 tones were presented, divided into blocks with brief breaks between them.
EEG recording and pre-processing
EEG data were collected with a 128 (UPMC) or 256 (UMHS) electrode recording system (Electrical Geodesics), at a sampling rate of 250 Hz, with a centrally located reference electrode. All datasets were later interpolated offline using a cubic spline interpolation to produce a 64-channel data structure according to the international 10–20 system, prior to BNA analysis. This interpolation process ensures that all individual BNA networks are computed on a common spatial configuration of electrodes, regardless of the electrode configuration used for recording. During the pre-processing stage, data were band-pass filtered between 0.5–30 Hz and re-referenced to the average mastoids. Then, noisy electrodes were rejected from analysis, using customized functions, and their data were interpolated with the interpolation procedure mentioned above. Finally, eye-movement and blink related artefacts were detected and removed using independent component analysis [Citation23].
BNA analysis
A full description of the BNA algorithm is given elsewhere [Citation13–Citation15,Citation17]. Briefly, BNA analysis involves two independent processes: an independent group-level pattern recognition process resulting in the creation of RBNM and a subject-level process in which subjects are evaluated against the RBNM. The group-level pattern recognition process had been previously performed on a separate group of healthy subjects (see introduction) to generate the population’s characteristic network for the same task—the RBNM. The RBNM is formed by clustering the basic time-frequency characteristics of the ERP of the pre-defined normative group of subjects (i.e. waveforms at specific location, amplitude, frequency and latency) and finding temporal relations between these clusters. The BNA algorithm extracts a set of spatio-temporal activity patterns produced by the experimental task. In particular, the algorithm seeks temporal relationships between pairs of salient ERP ‘events’, each at a given scalp location and a given frequency band. The RBNM is composed of all pairs of synchronized events in terms of time and amplitude that are common to the normative group of subjects. This pattern represented by the RBNM constitutes a functional brain network evoked by the experimental task in question (e.g. the ‘frequent’ condition of the oddball task) and the evolving network dynamics are depicted as a set of nodes connected by a set of links (see network in ). The subject-level process is performed later by comparing the individual’s BNA network to the RBNM and reflecting the degree of similarity between the two with a BNA score. This process was performed on the subjects of the current investigation, using a pre-defined age-matched RBNM of the oddball experiment. Importantly, subjects that are compared to the RBNM for scoring did not participate in the RBNM generation process. The BNA score is a numerical value between 0–100, where ‘100’ designates complete congruence between the subject’s and the group’s networks and ‘0’ indicates no similarity.
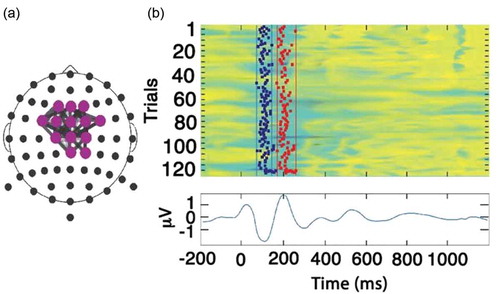
Figure 1. (a) The Reference Brain Network Model (RBNM) is displayed in a time-collapsed figure. A coloured circle at a specific electrode denotes activity recorded from a specific recording channel. Grey-shaded lines connect a pair of events/electrodes. (b) Reference group average ERP (N100 and P200). The coloured panel has 120 rows, one for each subject. In each row, the average activity of each subject is presented for the duration of the recorded epoch. Cool and warm colours represent negative and positive values, respectively. Vertical lines in the top panel represent the minimal (left) and maximal (right) permitted latency limits of the electrode activity within the pattern.
The oddball RBNM
The RBNM was generated a priori from data collected from participants at UPMC and UMHS (n = 120, 38 females; age = 18.7 (2.7) years; range = 14–25 years) while performing the auditory oddball task. Importantly, data from the subjects who generated the RBNM were not included in the pooled dataset of this research. The network that best represented sensory processing during the group’s performance of the oddball task was chosen as the RBNM. This RBNM ((a)) represents synchronization of two peak electrophysiological activities in the theta frequency band (3–8 Hz), which was observed at fronto-central recording sites and occurred at 100 and 200 milliseconds (N100 and P200, respectively) ((b)). The N100 and P200 components are related to early sensory and perceptual processing and are associated with low-level attention allocation [Citation24]. These components are influenced by common processes related to automatic stimulus processing, affected by early aspects of attention and orientation [Citation25,Citation26]. The top coloured panel in (b) has 120 rows, one for each subject. In each row, the average activity of each subject is presented for the duration of the recorded epoch. Cool and warm colours represent positive and negative values, respectively. Vertical lines in the top panel represent the minimum (left) and maximum (right) permitted latency limits of the electrode activity within the pattern. The lower panel in (b) depicts the running average of subject activities in the control group.
Statistical analysis of symptom scores
To assess the difference between the subjects in the control and concussion groups for total symptom score (see Methods for symptom questionnaires) across two visits of the pooled dataset, repeated ANOVA tests were performed with group (control, concussion) as a between-subjects factor and visit (one and two) as a within-subject factor. In addition, this study sought to assess whether the BNA algorithm performed differently on subjects in the concussion group who exhibited more symptoms, as opposed to patients reporting a lower rate of symptoms. For this purpose, this study delineated in the patient dataset a ‘severe’ concussion sub-set, defined as the patients who scored at the upper third (33rd percentile) in the total symptom score. The symptom score cut-off for this percentile was 41 in this population. Hence, separate repeated ANOVA tests with the same factors were performed for the entire range of symptom score severity and for severe symptom scores above the threshold of 41. Therefore, there is an overlap between the more severe symptom analysis (only > 41 points symptoms) and the analysis of all subjects.
Estimating the normal within-subject variability of BNA scores
The clinical utility of the BNA scores can greatly benefit from knowing the normal physiological variability of a single BNA score. For example, when a clinician is evaluating the score 70, he needs not only to compare it to the distribution of the normal population, but also does he need to know to what extent this score is stable over time or to what extent changes to this score in the following visits are due to random variability? For this purpose, a large and independent population of healthy subjects, age-matched to the RBNM group, had been previously recruited to estimate the within-subject variability (test–re-test) and determine a clinically meaningful normative change (see Reches et al. [Citation13]). A one standard deviation (SD) interval of physiological variability is depicted along with the BNA score for presentational purposes and can help the clinician in evaluating BNA score changes that go beyond the expected normal visit-to-visit variability. Note that the test–re-test data have no implications on the averaged group results reported hereby, but are used for the three case studies.
Results
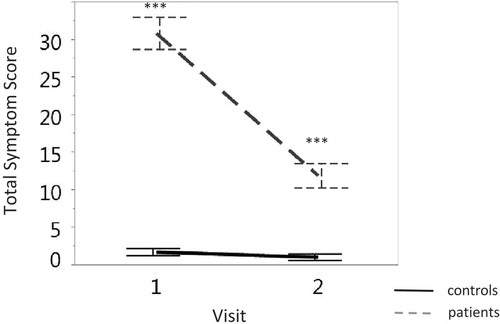
The symptom score of the healthy control group remained stable (F < 1 in the planned comparisons) and low across visits, while the symptom score of the patients group was dramatically higher at the first than the second visit (F(1,130.54) = 207.72, p < 0.0001). displays the change in symptom scores across two consecutive visits for subjects in the control and concussion groups. The total symptom score of the subjects in the concussion group was higher than the score for subjects in the control group for both visits (visit one: F(1,214.29) = 191.27, p < 0.0001; visit two: F(1,220.45) = 24.01, p < 0.0001).
Figure 2. Discrimination between the total symptom score (y-axis) of subjects in the concussion group (grey dashed line) and those in the control group (solid black line) across visits (x-axis). Vertical lines denote the standard error. ∗∗∗p < 0.0001.
Each of the four panels in displays the discrimination of the BNA score between subjects in the concussion and control groups over time. The four panels are arranged in a two-by-two matrix such that severity of symptoms is represented along the horizontal axis and age group is represented along the vertical axis ((a) and (b)). This arrangement of the panels highlights the effect of concussion along each dimension (symptom severity or age group). The vertical column labelled ‘all symptom scores’ includes subjects with the entire range of symptom score severity. The vertical column labelled ‘severe symptom scores’ pertains to the sub-set of subjects whose symptom scores were considered severe (the upper third of the sample, see Methods).
Figure 3. A 2 × 2 matrix displaying the discrimination between subjects in the concussion and control groups along two-dimensions: age (rows) and symptom severity (columns). The greatest effect emerges at the older group (> 16) with severe symptoms (right lower panel). In each of the four panels, the discrimination between the BNA score (y-axis) of subjects in the concussion (grey dashed) and control (solid black line) groups across visits (x-axis) is displayed. Vertical lines denote the standard error. Significant differences in group data are marked with ∗p < 0.05 and ∗∗p < 0.01. +, a trend toward significance.
The horizontal row labelled ‘all subjects’ includes all subjects, whereas the row labelled ‘above 16 years old’ represents the group with data from subjects between 14–16 years removed. This comparison was created since the aim was to examine the difference between subjects in the concussion and control groups along the two visits without the possible confounding effects of the adolescent age group, given that the ERP of adolescents is susceptible to neuronal maturation effects, especially in frontal and prefrontal cortex regions [Citation27–Citation29]. The cut-off of 16 years was determined as the higher end of the adolescent age group, since the median age of the entire population was equal to 16.4.
(a) displays the difference in BNA score as a function of symptom severity for all of the subjects participating in the study. Planned contrasts revealed that, only when the non-adolescent group is considered, a significant difference was obtained between subjects in the concussion and control groups at the first visit (F(1,118.32) = 4.92, p < 0.05; (b), left panel). An even stronger difference in BNA score at visit 1 is observed for this age group, when only the more severe mTBI sub-population is considered (F(1,84.88) = 7.51, p < 0.01; (b), right panel). Finally, when the severe group is taken with all ages together, a BNA difference trend is observed for visit one (F(1,136.99) = 3.05, p = 0.08; (a), right panel). For results across the four visits and details on poolability, see Supplementary material.
Selected cases of individual subjects
This section explores the clinical utility of BNA as a physiological concussion assessment tool, by presenting three individual cases. All three cases involve athletes from the population included in the groups analyses from this report. Each subject completed four clinical evaluation visits at comparable post-injury time periods. shows the BNA scores during the assessment visits in relation to the expected variance based on the test–re-test distribution, as well as to the distribution of the BNA score at the first test–re-test visit.
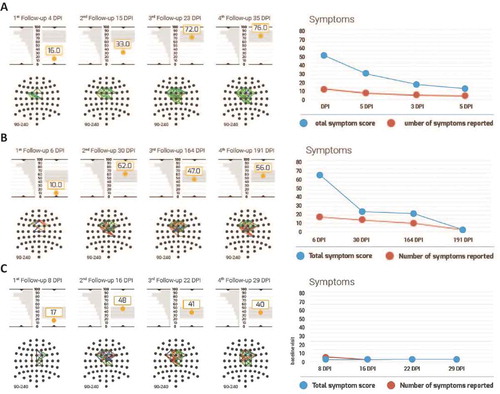
Figure 4. Individual BNA scores and symptoms of three representative patients. (a–c) Data for reported cases 1–3, respectively. In each panel, BNA data are presented on the left hand side and symptom scores are depicted on the right hand side. BNA results include the BNA scores at each visit to the clinic, below which the individual BNA network is shown. The BNA scores are shown along with the 1 SD margins of expected intra-visit variability (see Methods) as a grey rectangle. This 1 SD margin is centred around the score of the last available visit in order to facilitate the clinician’s evaluation of BNA stabilization (if the score remains within the 1 SD expected variance margins for two consecutive visits, the BNA may suggest a stabilization). To the left of each score is the first visit of the test–re-test data (i.e. the ‘test’), which is tilted vertically such that the score’s graph y-axis is also the distribution’s x-axis. Finally, the symptom score graph at the right hand side represents the number of total symptoms in red and the total symptom score in blue.
Case 1: High school aged male ice hockey player
The first case, taken from UMHS, involves a 16-year-old male, high school ice hockey player, who sustained a concussion from a direct frontal head-to-head hit during a game. The patient was monitored during four follow-up visits at 4, 15, 23 and 35 days post-injury (DPI). The patient returned to play after visit 3 (23 DPI). The patient reported a large number of symptoms (total symptom score of 53) that were consistent with a diagnosis of concussion. The self-reported symptoms were: headache, dizziness, balance problems, sensitivity to light and noise, concentration problems, fatigue and drowsiness. The patient also reported that the severity of these symptoms was the highest immediately following the injury and decreased gradually (total symptom score of 31 at visit 2, 19 at visit 3 and 14 at visit 4). The BNA maps showed that the corresponding connectivity in the brain of this patient was significantly disrupted and network activity decreased immediately following the head injury (see (a)). The BNA score measured at 4 DPI was 16, well below the normal range. The patient’s BNA score increased to 33 at 15 DPI and recovered to within normal physiological variability by 23 DPI. The BNA score plateau (i.e. from 72 at 23 DPI to 76 at 35 DPI) indicated that a stable neurophysiological condition was reached, which corresponded to the patient’s symptom report.
Case 2: Collegiate female field hockey player
The second case, taken from UMHS, involves a 19-year-old female field hockey player who sustained a concussion from a direct blow to the head as a result of head-to-body contact. The patient had four follow-up BNA tests at 6, 30, 164 and 191 DPI. This patient reported very severe symptoms of concussion immediately following the head injury, with a total symptom score of 66 at her first visit at 6 DPI. The symptoms were: headache and pressure in the head, dizziness, sensitivity to light and noise, fatigue and drowsiness, confusion, as well as anxiety, sadness and irritability. From 6 DPI to 30 DPI, the severity of the reported symptoms (except for the sensitivity to light and noise) decreased substantially (total symptom score of 23) and remained at that level at 164 DPI (total symptom score of 20). After the visit to the clinic at 164 DPI, the patient returned to play hockey. At 191 DPI, the number and severity of the patient’s symptoms reduced further, including the sensitivity to light and noise (total symptom score of 2). At 6 DPI, the BNA score for the patient was 10. The BNA score increased to 62 at 30 DPI, within the normal physiological variability and fluctuated within normal limits for the measurements at 164 and 191 DPI (with BNA scores 47 and 56 at visits 3 and 4 respectively) (see (b)).
Case 3: High school aged female soccer player
The third case, taken from UPMC, involved a 15 year-old female soccer player suffering from a head-to-ground hit to the occipital region, after colliding with an opponent. She suffered from brief (i.e. < 30 seconds) loss of consciousness and reported numerous on-field symptoms including disorientation, headache, dizziness, balance problems and visual change and was sent to the hospital. However, as soon as her first visit to the clinic 6 days post-injury, the patient reported none of the above symptoms, but only mild difficulty to concentrate (see (c)). The BNA score at her first visit was inconsistent with her reported symptoms. Her BNA score was very low (i.e. impaired) at 17, while her reported symptoms were also low at 3 (i.e. recovered). During the next three visits her BNA scores increased from 17 to 48 at visit 1 to 2, and then remained stable throughout the remaining visits (with BNA scores 41 and 40 at visits 3 and 4, respectively). That is, her BNA scores stabilized around a moderately low value, whereas her reported symptomatology remained low (3, 0 and 0 at visits 2, 3 and 4, respectively). Importantly, the concussion date was near the final game of the season and the expert opinion reported by the clinician was that the patient may have been minimizing her symptoms. Keeping in mind that the patient’s initial symptoms were severe, the BNA in this case is in line with the clinician’s report and could have provided evidence that physiological recovery in the brain had not transpired and the patient was still injured, in spite of her report to the contrary.
Discussion
The group results of this research support the use of BNA analysis as a clinical aid-tool for evaluating functional network changes following sport-related concussion, for subjects above 16 years-old. The case studies presented demonstrate its clinical utility and how it can be used for longitudinal patient monitoring, helping clinicians to follow the evolution of suspected cognitive dysfunction over time and determine its stabilization phase. As seen in , the reported symptoms showed a robust difference between patients and control subjects and a reduction over time. This is expected and validates the procedure. However, the subjective nature of symptom scores and the fact that it is self-reported may make it very inaccurate on the individual subject level, as nicely exemplified by case study 3. It is argued that the BNA may be a good objective aid for the diagnosis, assessment and management of patients with concussion side by side with the traditional clinical evaluation. The physiologically objectivity of this tool reduces the limitations of self-reporting methods to assess and monitor concussion.
Subjects with a concussion exhibited functional network changes reflected by a low BNA score, which is associated with reduced task-related brain activity and connectivity, immediately following injury (). This finding is in line with previous studies describing decreased functional brain connectivity in mTBI patients. For example, poor inter- and intra-hemispheric coherence in fronto-temporo-parietal regions were found in mTBI patients vs healthy controls in different stages of working memory in the theta, alpha and beta frequency bands [Citation30]. In addition, a deficiency in local and long-distance slow band-based connectivity has been documented in patients following brain injury [Citation31]. The inadequate differentiation between subjects in the concussion and control groups that was found when younger subjects were included in the group statistics ((a), left panel) sheds light on the heterogeneity of concussion [Citation32–Citation34]. Moreover, findings in the literature suggest that, since adolescents undergo rapid cognitive growth periods, longitudinal monitoring of injury may become clouded for subjects between 14–17 years old [Citation35,Citation36].
Regarding the relationship between symptom severity and electrophysiological performance, previous findings indicate a relationship between the P300 component, associated with stimulus classification and evaluation and the severity of self-reported symptoms (see a review in Broglio et al. [Citation8]). However, because the RBNM used in this analysis was composed of the N100-P200 components implicated in sensory processing, as opposed to context updating related to the P3 [Citation37], it is difficult to draw a direct conclusion regarding this point with the pooled dataset analysed here. Additionally, it was previously demonstrated that concussion was related to the modulation of the P1 component associated with sensory processing [Citation38,Citation39]. This relationship between concussion and a possible deficit in sensory processing strengthens the assumption that the larger difference in BNA score between subjects in the concussion and control groups reported in this study may be associated with increased symptom severity.
Further emphasizing the relationship between symptom severity and the magnitude of physiological impairment caused by concussion, a resting EEG-based TBI index was reported to be elevated in subjects with a moderate concussion when compared to subjects that had a mild concussion [Citation40]. As such, a low BNA score, as reported in the current study, may indicate the need for a closer clinical evaluation of the patient. However, it is important to note that a low BNA score in the absence of other corroborating data (e.g. symptoms, cognitive dysfunction, vestibular dysfunction, oculomotor dysfunction, balance dysfunction) should not be used for diagnostic purposes, as it may be reflective of a patient’s baseline state and not a change in their condition. Therefore, comparisons of BNA scores with other follow-up sessions or with a pre-injury baseline (if available) may provide more robust and clinically useful information.
Demonstrating group differences via statistical analysis in BNA or of any other physiological marker of concussion is not by itself indicative of the clinical utility of a tool for use with individual patients. This study, therefore, presented three case studies that highlight how BNA can be used to assist in the assessment and management of concussion. The first two cases present a situation in which the BNA score across visits follows the same overall trajectory as the symptom scores reported by patients. In such cases, the BNA is useful in augmenting information from clinical interviews, symptoms reports, cognitive testing and other assessments with a more objective physiological measure of brain function. There is one interesting difference between cases 1 and 2, however. As illustrated in case 2, the patient’s reported symptoms resolve over a longer period of time (5.5 months post-injury) than the resolution of her BNA score. Interestingly, the clinician overseeing this patient’s care believed that the remaining symptoms still apparent at visit 3 were likely due to secondary mechanisms post-injury rather than to the initial injury per se. Consequently, the clinician decided to return the patient to play at visit 3, despite her continued report of symptoms. This independent decision by the clinicians is in line with the earlier resolution of BNA ‘steady-state’ (a BNA score stabilization can be noted across visits 2 and 3). This case demonstrates that the BNA can provide valuable electrophysiological support to a clinician’s decision to return an athlete who is experiencing symptoms unrelated to their injury. In case 3 the patient’s symptoms decreased rapidly and resolved fully, whereas the BNA scores recovered more gradually and only partially. The rapid decrease in subjective symptom reporting may have been related to the clinician’s belief that the patient was minimizing to facilitate a quick return to sport (see Results). As in case 2, the BNA data in case 3 support this clinical explanation. Therefore, if considered in concert with other tools available to the clinician, the BNA may reinforce clinical decision-making and provide additional evidence of recovery or a lack thereof.
When considering other aspects of the clinical utility of a novel tool such as BNA, one has to address the question of inclusion or exclusion of patients. In this case, the authors would like to note that a certain number of participants (9%) could not be appropriately addressed due to noisy EEG data and were removed from the dataset prior to analysis (see Methods). This is a normal situation in studies involving EEG, but in a clinical scenario these subjects may need to repeat the session. This is a price to pay for a clinical tool, despite it being a known property of EEG data in general. At present, the authors are working to establish better noise detection systems, part of which may be real-time analyses during data collection, for a better evaluation of noise during recording. Future reports may confirm a higher inclusion rate than the current 91%.
The current study was not without limitations. The group results presented in the main text were limited to the first two evaluation sessions. Given that this investigation was based on data from two different samples, this study assessed the similarity of the samples in terms of age and elapsed time following injury. Although the datasets of the two studies were poolable in terms of age and elapsed time for visits one and two, there were differences between the centres in visits three and four with regard to the elapsed time following injury. To be conservative, it was opted to present the entire set of four visits as Supplementary material only. It is believed that the poolability limitation of sessions three and four is mitigated for two reasons: First, when subjects in the control group were contrasted with subjects in the concussion group (each group pooled over both sites), no significant difference was revealed between the groups in visits three and four in their elapsed time. This indicates that the differences in elapsed time between the two centres did not confound the main comparison of interest between subjects in the concussion and control groups in the last two visits (). Second, a significant difference between subjects in the concussion and control groups was revealed only in the first visit, while in later visits either no effect was found or only a trend toward a difference was detected ((b), right panel). Thus, the major outcome of this study concerns the difference between subjects in the concussion and control groups in the first visit and, therefore, any possible confounding factors that may exist in subsequent visits have no effect on this finding. Nevertheless, one cannot exclude the possibility that differences in elapsed time between the centres may have confounded the trajectory of recovery as reflected by the BNA score. Therefore, the main analyses and conclusion do not focus on the time course of recovery from concussion and, therefore, do not include the latter two visits. In sum, a convergence is seen of the BNA scores for the subjects in the concussion group towards those of the subjects in the control group (see Supplementary material for all four visits), but future studies are needed to quantify the time course of changes in BNA score after a concussion.
Lastly, the authors would like to note the observed limitation of the current BNA results in terms of age. In this group analysis, the mean BNA score difference between patients and control populations reached significance only for subjects older than 16 years. One, therefore, cannot generalize the conclusions from this study to younger subjects. Moving forward, the plan is to extend the clinical utility of BNA as reported in the current study by identifying additional relevant RBNM networks, across age, gender and other groups (see for current reported network). Further research is currently being conducted to extend the pool of reference networks to allow for better generalization across patient groups and enhance the clinical utility of the current approach. Indeed, a recently published paper demonstrates preliminary evidence for clinical utility of BNA to refined age-bins such as 13–16 year-old patients [Citation32].
Conclusion
The preliminary findings from the current study suggest that BNA analysis may help to differentiate between subjects with a concussion and those without, on the basis of functional brain connectivity profiles. The current findings also provide initial support for the use of BNA analysis to track brain network changes to help augment current approaches to the assessment and monitoring of recovery following concussion.
Declaration of interest
This research was supported in part by grants to the University of Pittsburgh from the National Institute on Deafness and Other Communication Disorders (1K01DC012332-01A1) and through a research contract between ElMindA Ltd on the one hand and both the University of Pittsburgh and the University of Michigan on the other. A. Reches, H. Ol-Ly, B. Sadeh and A. Geva are employees of ElmindA Ltd.
Supplemental Materials
Download Zip (555.5 KB)Acknowledgements
We thank Agnella Izzo Matic, PhD, CMPP for assistance and helpful comments.
Related Research Data
References
- Gessel LM, Fields SK, Collins CL, Dick RW, Comstock RD. Concussions among United States high school and collegiate athletes. Journal of Athletic Training 2007;42:495–503.
- Hootman JM, Dick R, Agel J. Epidemiology of collegiate injuries for 15 sports: summary and recommendations for injury prevention initiatives. Journal of Athletic Training 2007;42:311–319.
- Langlois JA, Rutland-Brown W, Wald MM. The epidemiology and impact of traumatic brain injury: a brief overview. The Journal of Head Trauma Rehabilitation 2006;21:375–378.
- Marar M, McIlvain NM, Fields SK, Comstock RD. Epidemiology of concussion among United States high school athletes in 20 sports. The American Journal of Sports Medicine 2012;40:747–755.
- Collins MW, Kontos AP, Reynolds E, Murawski CD, Fu FH. A comprehensive, targeted approach to the clinical care of athletes following sport-related concussion. Knee Surgery, Sports Traumatology, Arthroscopy: Official Journal of the ESSKA 2014;22:235–246.
- McCrory P, Meeuwisse WH, Aubry M, Cantu RC, Dvorak J, Echemendia RJ, Engebretsen L, Johnston K, Kutcher JS, Raftery M, et al. Consensus statement on concussion in sport: the 4th International Conference on Concussion in Sport, Zurich, November 2012. Journal of Athletic Training 2013;48:554–575.
- Rapp PE, Curley KC. Is a diagnosis of “mild traumatic brain injury” a category mistake? The Journal of Trauma and Acute Care Surgery 2012;73(2):S13–23.
- Broglio SP, Moore RD, Hillman CH. A history of sport-related concussion on event-related brain potential correlates of cognition. International Journal of Psychophysiology 2011;82:16–23.
- Gosselin N, Theriault M, Leclerc S, Montplaisir J, Lassonde M. Neurophysiological anomalies in symptomatic and asymptomatic concussed athletes. Neurosurgery 2006;58:1151–1161; discussion 1151–1161.
- Lavoie ME, Dupuis F, Johnston KM, Leclerc S, Lassonde M. Visual p300 effects beyond symptoms in concussed college athletes. Journal of Clinical and Experimental Neuropsychology 2004;26:55–73.
- Cao C, Slobounov S. Alteration of cortical functional connectivity as a result of traumatic brain injury revealed by graph theory, ICA, and sLORETA analyses of EEG signals. IEEE Transactions on Neural Systems and Rehabilitation Engineering: a Publication of the IEEE Engineering in Medicine and Biology Society 2010;18:11–19.
- Slobounov SM, Gay M, Zhang K, Johnson B, Pennell D, Sebastianelli W, Horovitz S, Hallett M. Alteration of brain functional network at rest and in response to YMCA physical stress test in concussed athletes: RsFMRI study. NeuroImage 2011;55:1716–1727.
- Reches A, Kerem D, Gal N, Laufer I, Shani-Hershkovitch R, Dickman D, Geva AB. A novel ERP pattern analysis method for revealing invariant reference brain network models. Functional Neurology, Rehabilitation & Ergonomics 2013;3:295–317.
- Reches A, Laufer I, Ziv K, Cukierman G, McEvoy K, Ettinger M, Knight RT, Gazzaley A, Geva AB. Network dynamics predict improvement in working memory performance following donepezil administration in healthy young adults. NeuroImage 2013;88C:228–241.
- Reches A, Levy-Cooperman N, Laufer I, Shani-Hershkovitch R, Ziv K, Kerem D, Gal N, Stern Y, Cukierman G, Romach MK, et al. Brain Network Activation (BNA) reveals scopolamine-induced impairment of visual working-memory. Journal of Molecular Neuroscience 2014;54:59–70.
- Reches A, Nir RR, Shram MJ, Dickman D, Laufer I, Shani-Hershkovich R, Stern Y, Weiss M, Yarnitsky D, Geva AB. A novel electroencephalography-based tool for objective assessment of network dynamics activated by nociceptive stimuli. European Journal of Pain 2015;11:22.
- Shahaf G, Reches A, Pinchuk N, Fisher T, Ben Bashat G, Kanter A, Tauber I, Kerem D, Laufer I, Aharon-Peretz J, et al. Introducing a novel approach of network oriented analysis of ERPs, demonstrated on adult attention deficit hyperactivity disorder. Clinical Neurophysiology 2012;123:1568–1580.
- Kontos AP, Reches A, Elbin RJ, Dickman D, Laufer I, Geva AB, Shacham G, DeWolf R, Collins MW. Preliminary evidence of reduced brain network activation in patients with post-traumatic migraine following concussion. Brain Imaging and Behavior 2016;10:594–603.
- Maroon JC, Lovell MR, Norwig J, Podell K, Powell JW, Hartl R. Cerebral concussion in athletes: evaluation and neuropsychological testing. Neurosurgery 2000;47:659–669.
- Lovell MR, Burke CJ. Neuropsychological testing in ice hockey: the NHL program. In: Cantu R, editor. Neurological athletic head and spine injuries. Philadelphia (PA): Sanders; 2000.
- Collie A, Maruff P, Makdissi M, McCrory P, McStephen M, Darby D. CogSport: reliability and correlation with conventional cognitive tests used in post-concussion medical examinations. Clinical Journal of Sport Medicine 2003;13:28–32.
- Polich J. P300 in clinical applications. In: Niedermeyer E, de Silva FL, editors. Electroencephalography, basic principles, clinical applications, and related fields. Baltimore (MD): Urban and Schwarzenberg; 1999. p 1073–1091.
- Delorme A, Makeig S. EEGLAB: an open source toolbox for analysis of single–trial EEG dynamics including independent component analysis. Journal of Neuroscience Methods 2004;134:9–21.
- Hillyard SA, Luck SJ, Mangun GR. The cuing of spatial attention to visual field locations: analysis with ERP recordings. In: Heinze HJ, Munte TF, Mangun GR, editors. Cognitive electrophysiology. Boston (MA): Birkhauser; 1994. p 1–25.
- Lee TW, Yu YW, Wu HC, Chen TJ. Do resting brain dynamics predict oddball evoked-potential? BMC Neuroscience 2011;12:121.
- Mueller V, Brehmer Y, von Oertzen T, Li SC, Lindenberger U. Electrophysiological correlates of selective attention: a lifespan comparison. BMC Neuroscience 2008;9:18.
- Hogan AM, Vargha-Khadem F, Kirkham FJ, Baldeweg T. Maturation of action monitoring from adolescence to adulthood: an ERP study. Developmental Science 2005;8:525–534.
- Rojas-Benjumea MA, Sauque-Poggio AM, Barriga-Paulino CI, Rodriguez-Martinez EI, Gomez CM. Development of behavioral parameters and ERPs in a novel-target visual detection paradigm in children, adolescents and young adults. Behavioral and Brain Functions 2015;11:22.
- Yuan J, Ju E, Meng X, Chen X, Zhu S, Yang J. Enhanced brain susceptibility to negative stimuli in adolescents: ERP evidences. Frontiers in Behavioral Neuroscience 2015;9:98.
- Kumar S, Rao SL, Chandramouli BA, Pillai SV. Reduction of functional brain connectivity in mild traumatic brain injury during working memory. Journal of Neurotrauma 2009;26:665–675.
- Castellanos NP, Paul N, Ordonez VE, Demuynck O, Bajo R, Campo P, Bilbao A, Ortiz T, del-Pozo F, Maestu F. Reorganization of functional connectivity as a correlate of cognitive recovery in acquired brain injury. Brain 2010;133:2365–2381.
- Kiefer AW, Barber Foss K, Reches A, Gadd B, Gordon M, Rushford K, Laufer I, Weiss M, Myer GD. Brain network activation as a novel biomarker for the return-to-play pathway following sport-related brain injury. Frontiers in Neurology 2015;6:243.
- Moser RS, Schatz P. Enduring effects of concussion in youth athletes. Archives of Clinical Neuropsychology 2002;17:91–100.
- Rabinowitz AR, Levin HS. Cognitive sequelae of traumatic brain injury. The Psychiatric Clinics of North America 2014;37:1–11.
- Daniel JC, Olesniewicz MH, Reeves DL, Tam D, Bleiberg J, Thatcher R, Salazar A. Repeated measures of cognitive processing efficiency in adolescent athletes: implications for monitoring recovery from concussion. Neuropsychiatry, Neuropsychology and Behavioral Neurology 1999;12:167–169.
- Slobounov S, Gay M, Johnson B, Zhang K. Concussion in athletics: ongoing clinical and brain imaging research controversies. Brain Imaging and Behavior 2012;6:224–243.
- Bonala BK, Jansen BH. A computational model for generation of the P300 evoked potential component. Journal of Integrative Neuroscience 2012;11:277–294.
- Gaetz M, Weinberg H. Electrophysiological indices of persistent post-concussion symptoms. Brain Injury 2000;14:815–832.
- Moore RD, Broglio SP, Hillman CH. Sport-related concussion and sensory function in young adults. Journal of Athletic Training 2014;49:36–41.
- Prichep LS, McCrea M, Barr W, Powell M, Chabot RJ. Time course of clinical and electrophysiological recovery after sport-related concussion. The Journal of Head Trauma Rehabilitation 2013;28:266–273.