
ABSTRACT
Objectives: This longitudinal study aims at 1) providing preliminary evidence of changes in blood-based biomarkers across time in chronic TBI and 2) relating these changes to outcome measures and cerebral structure and activity.
Methods: Eight patients with moderate-to-severe TBI (7 males, 35 ± 7.6 years old, 5 severe TBI, 17.52 ± 3.84 months post-injury) were evaluated at monthly intervals across 6 time-points using: a) Blood-based biomarkers (GFAP, NSE, S100A12, SDBP145, UCH-L1, T-tau, P-tau, P-tau/T-tau ratio); b) Magnetic Resonance Imaging to evaluate changes in brain structure; c) Resting-state electroencephalograms to evaluate changes in brain function; and d) Outcome measures to assess cognition, emotion, and functional recovery (MOCA, RBANS, BDI-II, and DRS).
Results: Changes in P-tau levels were found across time [p = .007]. P-tau was positively related to functional [p < .001] and cognitive [p = .006] outcomes, and negatively related to the severity of depression, 6 months later [R = −0.901; p =.006]. P-tau and P-tau/T-tau ratio were also positively correlated to shape change in subcortical areas such as brainstem [T(7) = 4.71, p = .008] and putamen [T(7) = 3.25, p = .012].
Conclusions: Our study provides preliminary findings that suggest a positive relationship between P-tau and the recovery of patients with chronic TBI.
The Centers for Disease Control and Prevention has defined a traumatic brain injury (TBI) as a “disruption in the normal function of the brain that can be caused by a bump, blow, or jolt to the head, or penetrating head injury” (Citation1). In 2014, the number of TBI-related emergency department visits, hospitalizations, and deaths was approximately 2.88 million in the United States. The prevalence increased by 53% from 2006 (i.e., 1.88 million) and is often referred to as a “silent epidemic.” Moderate to severe TBI represents 15% of the total population with a TBI but accounts for 90% of total medical costs related to such injury (around 4 USD billion in direct medical cost per year) (Citation1). In contrast, no effective treatment has been validated for patients with TBI, leading patients to deal with the aftermath of the injury for months or years. Recently, the importance of considering TBI as a chronic disease rather than an acute event has been highlighted by the TBI Model system (TBIMS; a program, sponsored by the National Institute on Disability, Independent Living, and Rehabilitation Research). Indeed, research has shown that, within 5 years post-injury, 52% of the patients with moderate to severe TBI have either declined functional outcome or die (Citation2). These patients also have a poorer quality of life, face various chronic health issues (e.g., seizures, neuroendocrine dysregulation, psychiatric diseases, or neurodegenerative diseases), and have a shorter life expectancy as compared to individuals without TBI (Citation2).
In light of these statistics, it seems particularly important to better understand the mechanisms of chronicity of TBI in order to allow the development of more efficient therapeutic options for this population. However, little is known about longitudinal brain changes occurring months or years after TBI. In the past few years, blood-based biomarkers have shown their potential as diagnostic and prognostic markers in patients with acute TBI. Several biofluid markers have been investigated, in particular indicators of gliosis/astroglia injury (glial fibrillary acidic protein, GFAP), cell body injury (neuron-specific enolase, NSE, spectrin breakdown product 145, SDBP145), and permeability of the blood–brain barrier (S100 calcium-binding proteins). Among these proteins, S100B has been the most studied in acute TBI but has also been reported to be elevated in patients without brain injury and might not be specific to the central nervous system (Citation3,Citation4). S100A12 is an interesting alternative and has been shown as a sensitive indicator of adverse outcomes in severe TBI (Citation5). Ubiquitin C-terminal hydrolase-L1 (UCH-L1), which reflects cell body injury, has been shown to outperform computed tomography (CT) scans in the detection of mild to moderate TBI and the detection of sport-related concussion (Citation6,Citation7). Finally, there is a growing body of literature on the potential use of neurodegenerative markers in chronic TBI. For example, studies have shown a possible link between repeated mild TBI and tauopathy (i.e., an abnormal accumulation of phosphorylated tau, P-tau, deposits in the brain) such as Alzheimer's disease and chronic traumatic encephalopathy (Citation8). Only one study was done in chronic TBI, using the TBI Track data (core of research lead by the TBIMS). Rubenstein and colleagues investigated plasma total Tau (T-tau), P-tau and P-tau/T-tau ratio in patients with TBI acutely (within 24 hours) and in patients with chronic TBI (less than 1 year following injury) to determine if plasma tau changed following injury and if there was any relationship between plasma tau levels and outcome. The authors found that P-tau (and P-tau/T-tau ratio) outperformed T-tau in differentiating positive from negative CT scan findings and were elevated in chronic patients, suggesting that blood-based biomarkers might still reflect neuronal state several months after TBI (Citation9).
The aim of this longitudinal study was 1) to gather preliminary data on changes in blood-based biomarkers across time (i.e., GFAP, NSE, S100A12, SDBP145, UCH-L1, T-tau, P-tau, and P-tau/T-tau ratio) more than a year after a moderate to severe TBI, and 2) to relate these changes to changes in outcome measures as well as to changes in cerebral structure (as assessed with magnetic resonance imaging, MRI) and neurophysiologic activity (as assessed with resting-state electroencephalography, EEG).
Materials and methods
Participants
Participants were recruited from the Transitional Living Center at Casa Colina Hospital and Centers for Healthcare, Pomona, California. To be eligible, the patients had to 1) be between 18 and 65 years old, 2) have suffered a moderate to severe TBI (GCS 9–12 and GCS 3–8, respectively) and be at least 1 year after injury post-injury at the time of enrollment (i.e., more than a year post-injury but less than 2-years post-injury), 3) have grossly intact motor use of dominant hand and no gross receptive language impairment/aphasia. Participants were excluded if 1) they were neither speakers of English or Spanish, 2) they had a diagnosis other than TBI (e.g., spinal cord injury, other primary neurologic condition), a developmental disorder (i.e., down syndrome), or a pre-morbid psychiatric condition resulting in admission to a hospital. Participants with claustrophobia or with metallic implants making it unsafe to enter the MRI environment were also excluded. Study protocols were approved by the institutional review board of Casa Colina Hospital and Centers for Healthcare. Participants provided written informed consent.
Data acquisition and analyses
In this prospective longitudinal study, the following data were collected, at monthly intervals (every 4 to 6 weeks) across 6 time-points (study duration: 6.43 ± 0.84 months):
Blood
Data collection
Single whole blood samples were collected from participants. After collection of the whole blood, the blood was allowed to clot by leaving it undisturbed at room temperature for 15 minutes. The clot was removed by centrifuging at 1,000–2,000 x g for 10 minutes. The resulting supernatant was designated serum. Following centrifugation, the serum was aliquoted directly to microcentrifuge tubes (500ul). The samples were maintained at 2–8°C while handling and stored at – 20°C until being transferred on dry ice to a − 80°C freezer for long-term storage and processing at the Biology Department of the University of La Verne.
Data analyses
A quantitative sandwich enzyme-linked immunosorbent assay (ELISA) technique was used to analyze serum levels of glial fibrillary acidic protein (GFAP) (Millipore, Burlington, MA), neuron-specific enolase (NSE) (R&D Systems, Minneapolis, MN), human alpha II-spectrin breakdown product (SBDP145) (MyBioSource, San Diego, CA), S100 calcium-binding protein A12 (S100A12) (Millipore, Burlington, MA), Ubiquitin C-terminal hydrolase-L1 (UCH-L1) (MyBioSource, San Diego, CA) as well as T-tau (Abcam, Cambridge, UK), P-tau (MyBioSource, San Diego, CA), and P-tau/T-tau ratio. Samples for each participant were run in duplicate on the same plate. Protein levels were determined based on the standard curve using the average of the duplicate values.
Outcome measures
The behavioral assessment was performed (in English or Spanish) by trained clinicians and included cognitive measures (i.e., the Montreal Cognitive Assessment and subtests of the Repeatable Battery for the Assessment of Neuropsychological Status), a mood measure (i.e., the Beck Depression Inventory) and a measure of functional outcome (i.e., the Disability Rating Scale).
Montreal Cognitive Assessment (MOCA)
The MOCA is a widely used screening assessment for detecting gross cognitive impairment in a variety of diseases including traumatic brain injuries. It assesses short-term and long-term memory, attention/working memory, executive functions, language, and orientation to time and space. Its total score ranges from 0 to 30. It exists in around 50 languages and it has 3 alternative versions. In this study, either the English or the Spanish version was used (Citation10,Citation11). The alternative versions were used twice across assessments (in the following order: 1, 2, 3, 1, 2, 3).
Repeatable Battery for the Assessment of Neuropsychological Status (RBANS)
The RBANS is a neuropsychological assessment which tests five cognitive domains (short-term and long-term memory, visuospatial/constructional abilities, language, attention/working memory). It was originally introduced in the screening for dementia but has also found application to traumatic brain injury (Citation12). It has four alternative versions but, since these alternative versions do not exist in Spanish, we decided to administer the following non-verbal subtests to both English and Spanish speakers: digit span (DS) (score range: 0–16), figure copy (FC) (score range: 0–20), and coding (C) (score range: 0–89). The alternative versions were administered in the following order across assessments: a, b, c, d, a, b.
Beck Depression Inventory (BDI-II)
The BDI-II is a 21-question multiple-choice self-report inventory and is one of the most widely used psychometric tests for measuring depression. It includes items related to hopelessness, irritability, guilt, as well as fatigue, weight loss, and lack of sex drive. Its total score ranges from 0 to 63. Both its English and Spanish version were used (Citation13,Citation14).
Disability Rating Scale (DRS)
The DRS was developed to assess functional recovery of patients after a traumatic brain injury (Citation15). It assesses eye opening, communication ability, feeding, toileting, grooming, level of functioning, and employability. It does not request an interview with the patient but it relies on the rater’s behavioral observation and knowledge of the patient. Its total score ranges from 29 (worst outcome) to 0 (best outcome).
Magnetic resonance imaging (MRI)
Data collection
MRI data were collected on a Siemens Magnetom Verio 3 T system at the Casa Colina Diagnostic Imaging Center. Each participant underwent a conventional structural MRI T1-weighted 3-dimensional magnetic-preparation rapid gradient echo scan (MPRAGE) with the following parameters: TR = 2300 ms, TE = 2 ms, flip angle = 9°, FOV = 23 cm, slice thickness = 1 mm with no gap, number of slices = 160, matrix size = 224 x 224.
Data analyses
For the MRI analyses, within-subject statistics were used rather than cross-subject statistics which increases power with a small sample size. For cortical analyses, the FreeSurfer longitudinal processing stream was used to register each participant’s individual timepoint into their own average brain, and then all participants’ timepoints were registered into an average template brain (fsaverage), followed by tissue segmentations and parcellation of 31 cortical regions in each hemisphere based on the Desikan-Killiany atlas (Citation16,Citation17). For each region of interest (ROI), average cortical volume and thickness measures from FreeSurfer were extracted and regressed against the independent variables (i.e., the blood-based biomarkers) in separate linear mixed effects (LME) analyses customized for longitudinal data (Citation18). The longitudinal LME analysis has the advantages of properly handling covariance among repeated measures as well as differences across patients in number of repeated measures and time intervals between them. Each LME model also controlled for time since injury and severity of injury. Correction for multiple comparisons across ROIs was performed separately for each hemisphere and cortical measure with a two-stage false discovery rate (FDR) procedure based on a total FDR of p < .05.
Subcortical volumes were calculated using FSL’s FIRST (Citation19). Subcortical morphometry (shape statistics) measurements were calculated using the Metric Optimization for Computational Anatomy toolbox (Citation20). We modified FSL’s vertex analysis to allow for longitudinal analysis within subject across multiple timepoints and regressed against the independent variables (i.e., the blood-based biomarkers) (Citation19). First, 15 subcortical structures were segmented for each participant for each time point. This novel workflow creates a cohort average subcortex over all time points and participants, as well as an image per subcortical region of interest that represents the localized longitudinal shape change within each subject compared with the cohort. Group-level significance was assessed using a general linear model with a non-parametric permutation test at a level of p < .05 corrected for multiple comparisons using family-wise cluster correction and threshold-free cluster enhancement (TFCE) as implemented in FSL randomize (Citation21).
Resting-state electroencephalogram (EEG)
Data collection
EEG-data were acquired at the Casa Colina research institute in a faraday room. A 24 electrode skull cap was connected to a wireless portable digital EEG amplifier (B-Alert wireless EEG system; advancedbrainmonitoring.com). Fp1 and Fp2 were used to monitor eye artifacts. A mastoid reference was applied. EEG-data were recorded on a laptop computer. The impedances were kept below 40 kΩ. A sampling rate of 250 Hz was used. EEG recordings were performed while the participants were in a wakeful state with eyes open, sitting in a setting with minimal ambient noise. Patients were instructed to relax and look at a fixed object in the room. Duration of recording was 5 minutes.
Data analyses
EEG data were analyzed using the GUI (graphic user interface) of EEGLAB (version 14.0.0b). Preprocessing included channel location, band-pass filtered between 1 and 40 Hz (FIR filter), Independent Component Analyses (ICA; with jader decomposition algorithm) to identify and exclude ocular and motor artifacts related components (maximum of 3), and a final visual inspection of the EEG data in order to manually remove any residual artifacts. For the spectral analysis, the continuous signal of each recording was segmented into 1s epochs. Each epoch was fast Fourier transformed (FFT) with a Hanning-tapered window. Subsequently, all epochs were averaged, and the mean of the power spectral density in different frequency bands were exported for statistical analysis. Frequency bands were chosen at target electrode sites based on previous literature pinpointing sites of maximal amplitude for each band: alpha (8–13 Hz) at the occipital electrodes (O1, Oz, O2), theta (4–7 Hz) at the frontal electrodes (F7, F3, Fz, F4, F8), and delta (1–3 Hz) at the central electrodes (C3, Cz, C4). The averaged power spectral density extracted for each site (F, C, O) was expressed in absolute power (μV2) (Citation22).
Statistical analyses
For blood, behavioral and EEG data, LME analyses were performed on our 6 timepoints (repeated effect) per patient and 48 observations (repeated covariance type: diagonal, severity of lesions as a fixed factor) (Citation23).
Our analyses were performed in two steps: First, time since injury was covaried (as a fixed factor) to each blood-based biomarker (i.e., GFAP, NSE, S100A12, SDBP145, UCH-L1, T-tau, P-tau, and P-tau/T-tau ratio). Time since injury was adjusted across patients by subtracting the mean of the first assessment from each observation for this variable. Then, in a second step, the blood-based biomarkers showing significant changes were covaried with 1) the outcome measures (as fixed factors: MOCA, RBANS DS, RBANS FC, RBANS C, BDI, DRS) (Bonferroni correction applied: p ≤ .008), and 2) the resting-state EEG (as fixed factors: alpha, delta, theta) (Bonferroni correction applied: p ≤ .02). Missing data were discarded in our analyses. Values for NSE and GFAP were not obtained in two out of eight patients (due to deficient ELISA kits) and analyses were performed on six patients. Statistical analyses performed for the MRI data have been described above [see “Magnetic resonance imaging (MRI)” section]. We only report results that remain significant after corrections for multiple comparisons.
Results
Eight participants were recruited for this study (7 males, 35 ± 7.6 years old, 5 severe TBI, 17.52 ± 3.84 months post-injury) (See ).
Table 1. Patients’ demographics
Significant changes were found across time in blood-based biomarkers such as P-tau [F(1) = 8.495, p = .007; difference in slope, 0.574 points per timepoint] and P-tau/T-tau ratio [F(1) = 11.131, p = .002; difference in slope, 0.008 points per timepoint]. P-tau also differed according to the severity of lesions [F(1) = 6.413, p = .018; difference in slope, 4.191 points], being higher in moderate than severe TBI (see , panel A). No significant changes were observed for GFAP [F(1) = 0.269, p = .609], NSE [F(1) = 0.004, p = .949], SDBP145 [F(1) = 0.104, p = .750], S100A12 [F(1) = 2.080, p = .158], UCH-L1 [F(1) = 0.176, p = .677], T-tau [F(1) = 0.390, p = .537].
Figure 1. Behavioral and neuroimaging findings related to P-tau
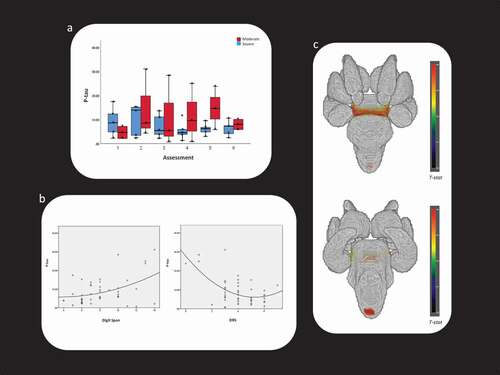
Changes in P-tau [F(1) = 22.961, p < .001; difference in slope, −2.32 points per timepoint] and P-tau/T-tau ratio [F(1) = 10.541, p = .003; difference in slope, −0.024 points per timepoint] were negatively related to changes in DRS while changes in P-tau were also positively related to RBANS DS [F(1) = 10.068, p = .006; difference in slope, 1.364 points per timepoint] (see , panel B). P-tau had a positive association with longitudinal shape change in brainstem [T(7) = 4.71, p = .008, 512 voxels in cluster] (see , panel C). P-tau/T-tau ratio had a positive association with longitudinal shape change in right putamen [T(7) = 3.25, p = .012, 215 voxels in cluster]. In our study, changes in P-tau and P-tau/T-tau ratio were not significantly related to changes in EEG.
Non-parametric Spearman correlation was performed post-hoc between P-tau, P-tau/T-tau ratio at the first data collection and behavioral outcome measures at the last data collection (Bonferroni correction applied: p ≤ 0.008). P-Tau values were negatively correlated to the BDI [R = −0.901; p = .006].
Discussion
The aim of this longitudinal study was 1) to collect preliminary prospective data on changes in blood-based biomarkers across time in chronic moderate to severe TBI and 2) to relate them to behavioral and cerebral changes. P-tau and P-tau/T-tau ratio were the only one to be found to change significantly across time more than a year following a TBI. Surprisingly, P-tau was higher in moderate than severe TBI, positively related to functional and cognitive outcome, and negatively related to the severity of depression 6 months later. P-tau and P-tau/T-tau ratio were also positively related to shape change in subcortical areas such as brainstem and putamen.
P-tau is a protein that is mostly present in the CNS and, more exactly, in neurons to stabilize microtubules and cell structure. Increases in P-tau have been reported in neurodegenerative diseases and “tauopathies” such as Alzheimer's disease or chronic traumatic encephalopathy (CTE) (Citation24). CTE has been associated with repeated mild TBIs and has been related to an abnormal perivascular accumulation of P-tau at the depths of cortical sulci in postmortem studies, resulting in chronic axonal damage, myelin loss, and white matter degeneration and atrophy (Citation25–27). An increase in P-tau has therefore previously been associated with neurotoxic processes. However, in this study, an increase in P-tau (and P-tau/T-tau ratio) was found in patients with better outcome (moderate versus severe), was related to functional improvement, improved cognition (i.e., short-term memory and auditory attention), lower mood disorder across time, and was associated to a shape increase (and not a decrease/atrophy) of the brainstem and putamen. Importantly, these preliminary findings suggest that increased P-tau level might also be related to recovery processes in chronic TBI.
Recent studies have challenged the notion that an increase in P-tau always reflects neurotoxic processes. Ittner and colleagues have found in animal models that a mechanism of phosphorylation of a specific residue of tau protects against amyloid plaques and improves cognitive outcome, suggesting that an increase in P-tau might sometimes be related to neuroprotective processes (Citation28,Citation29). P-tau is known to be higher in fetal neurons and an increased P-tau has also been reported in adult subcortical areas that are known to have neurogenesis (i.e., hippocampus), suggesting that P-tau might help in maintaining a dynamic but stable microtubule network and be a valuable indicator to study new axons in adult neurogenesis (Citation30–33). Our results seem to point to the brainstem as a target site for changes in P-Tau. Brainstem is frequently injured in patients with moderate to severe TBI who experience loss of consciousness. Interestingly, there have been reports of neurogenesis in the adult brainstem (Citation34–36). The brainstem has also been identified as a site for hyperphosphorylation of tau in the early onset of Alzheimer's disease and has been associated with early symptoms such as depression (Citation37).
There is only one study that has investigated P-tau levels a few months following moderate to severe TBI. Using a cross-sectional design, Rubenstein and colleagues showed a strong association between an elevated P-tau in 196 acute patients (<24 h after injury) and poor outcome at discharge (Citation9). The authors also described an increased P-tau level in 21 patients less than a year after injury (i.e., 176.4 ± 44.5 days post injury) which they associated to the potential development of a neurodegenerative disease. The cohort we describe was over a year post injury whereas the prior work was conducted a few months post injury. However, our preliminary findings suggest distinct mechanisms in the acute and chronic phase of TBI; namely, axonal damage versus axonal outgrowth. Alternatively, these might reflect an intermediary phase in the neurodegenerative process where P-tau is accumulating but not yet playing a direct role in neuronal damage. Increased P-tau would then be an artifact of recovery occurring during this chronic phase. In any case, more investigations need to be done in order to better understand the changes in P-tau levels across time and its relation to patients’ outcome.
Finally, there are limitations to the present study which suggest the need for caution in interpreting the findings, including the small sample size, a spectrum of TBI severity (moderate to severe), and the absence of a control group. Our results show a significant increase in P-tau as a trend across time. In the absence of a control group, it is difficult to confirm that the trend observed is not related to a transient increase that would also be observed in a participant without TBI. Previous longitudinal studies on Alzheimer's disease have shown that P-tau is stable across time in controls and can allow differentiating healthy from pathological populations (Citation38). Future studies should nevertheless include the follow-up of a control group in order to better characterize the long-term recovery from TBI. A bigger population would also allow us to estimate the power of P-tau as a prognostic and potential diagnostic biomarker (of CTE) in a readily interpretable way (such as a ROC analysis) and might allow us to use it to make meaningful clinical decisions. Furthermore, a small time window (around 6 month follow-up) was considered, which limits our ability to detect slower, longer trends among the biomarkers we considered. Finally, we did not look at other sites of tau hyperphosphorylation which may represent different findings and we did not include indicators of neuroinflammation and auto-immunity (e.g., auto-GFAP, Auto-s100B, IL-6) that might still change in a chronic stage and might help to characterize inflammatory responses contributing to secondary brain damage (Citation3,Citation5).
In conclusion, blood collection can be done quickly, at the bedside and has low risks and costs. Blood-based biomarkers have the potential to give useful information regarding ongoing neural dynamics and to help make relevant clinical decisions. Indeed, blood-based biomarkers (such as NSE and GFAP) have largely been studied in the acute setting for their prognostic value in moderate and severe traumatic brain injuries (Citation3,Citation4). More recently, blood-based biomarkers (such as P-tau) have also been studied as a prognostic but also as a potential diagnostic marker for degenerative processing related to chronic TBI (such as CTE) (Citation8). Our preliminary findings stress that an increase in P-tau might not automatically be related to cognitive decline. Further investigations are therefore warranted in larger cohorts to better understand the mechanism of neural recovery and to better estimate the predictive and potential diagnostic power of P-tau in these patients with chronic TBI.
Authors’ contributions
CS contributed to the study design, performed statistical analyses, drafted and revised the manuscript; JD coordinated data acquisition as well as acquired and analyzed EEG data; MAJ and EL analyzed cortical and subcortical MRI data, respectively; MMM helped in interpreting MRI data and revised the manuscript; KMK and JG acquired neuropsychological data and helped in the results interpretation; NP revised the manuscript; DP helped in data acquisition and revised the manuscript; GJ helped in acquiring MRI data and revised the manuscript; VCM and KFW analyzed blood sample and helped in the results interpretation; ER substantially contributed to the conception and design of the study and revised the manuscript.
Declarations of interest statement
The authors report no conflicts of interest. This study was funded by the Kenneth T. and Eileen L. Norris Foundation. The foundation was not involved in the design of the study and collection, analysis, and interpretation of data or in writing the manuscript. The datasets used and analyzed during the current study are available from the corresponding author on reasonable request.
Acknowledgments
The authors would like to thank Dr. Loverso, the Casa Colina Board of Directors, and the Casa Colina Foundation for supporting this research. Finally, we would also like to thank all the clinicians and research assistants who contributed to this study including Tamara L. Obregon Madera, James Garcia, Nicholas Moelter, Joann Ramirez, Niko Fulmer, Trevor Scott, Kaylee Cruz and Vojislav Svetomir Maric.
Additional information
Funding
References
- Centers for Disease Control and Prevention. Surveillance report of traumatic brain injury-related emergency department visits, hospitalizations, and deaths—United States. U.S: Department of Health and Human Services; 2014. p. 2019.
- Masel BE, DeWitt DS. Traumatic brain injury: a disease process, not an event. J Neurotrauma. 2010;27(8):1529–40.doi:https://doi.org/10.1089/neu.2010.1358.
- Wang KK, Yang Z, Zhu T, Shi Y, Rubenstein R, Tyndall JA, Manley GT. An update on diagnostic and prognostic biomarkers for traumatic brain injury. Expert Rev Mol Diagn. 2018;18(2):165–80.doi:https://doi.org/10.1080/14737159.2018.1428089.
- Strathmann FG, Schulte S, Goerl K, Petron DJ. Blood-based biomarkers for traumatic brain injury: evaluation of research approaches, available methods and potential utility from the clinician and clinical laboratory perspectives. Clin Biochem. 2014;47(10–11):876–88.doi:https://doi.org/10.1016/j.clinbiochem.2014.01.028.
- Gan ZS, Stein SC, Swanson R, Guan S, Garcia L, Mehta D, Smith DH. Blood biomarkers for traumatic brain injury: A quantitative assessment of diagnostic and prognostic accuracy. Front Neurol. 2019;10:446.
- Meier TB, Nelson LD, Huber DL, Bazarian JJ, Hayes RL, McCrea MA. Prospective assessment of acute blood markers of brain injury in sport-related concussion. J Neurotrauma. 2017;34(22):3134–42.doi:https://doi.org/10.1089/neu.2017.5046.
- Welch RD, Ayaz SI, Lewis LM, Unden J, Chen JY, Mika VH, Saville B, Tyndall JA, Nash M, Buki A, et al. Ability of serum glial fibrillary acidic protein, ubiquitin C-terminal hydrolase-L1, and S100B to differentiate normal and abnormal head computed tomography findings in patients with suspected mild or moderate traumatic brain injury. J Neurotrauma. 2016;33(2):203–14.doi:https://doi.org/10.1089/neu.2015.4149.
- Zetterberg H, Blennow K. Chronic traumatic encephalopathy: fluid biomarkers. Handb Clin Neurol. 2018;158:323–33.
- Rubenstein R, Chang B, Yue JK, Chiu A, Winkler EA, Puccio AM, Diaz-Arrastia R, Yuh EL, Mukherjee P, Valadka AB, et al. Comparing plasma phospho tau, total tau, and phospho tau-total tau ratio as acute and chronic traumatic brain injury biomarkers. JAMA Neurol. 2017;74(9):1063–72.doi:https://doi.org/10.1001/jamaneurol.2017.0655.
- de Guise E, Alturki AY, LeBlanc J, Champoux MC, Couturier C, Lamoureux J, Desjardins M, Marcoux J, Maleki M, Feyz M. The Montreal Cognitive Assessment in persons with traumatic brain injury. Appl Neuropsychol Adult. 2014;21(2):128–35.doi:https://doi.org/10.1080/09084282.2013.778260.
- Delgado C, Araneda A, Behrens MI. Validation of the Spanish-language version of the Montreal Cognitive Assessment test in adults older than 60 years. Neurologia. 2019;34(6):376–85.doi:https://doi.org/10.1016/j.nrl.2017.01.013.
- McKay C, Wertheimer JC, Fichtenberg NL, Casey JE. The repeatable battery for the assessment of neuropsychological status (RBANS): clinical utility in a traumatic brain injury sample. Clin Neuropsychol. 2008;22(2):228–41.doi:https://doi.org/10.1080/13854040701260370.
- Richter P, Werner J, Heerlein A, Kraus A, Sauer H. On the validity of the beck depression inventory. Rev Psychopathol. 1998;31(3):160–68.doi:https://doi.org/10.1159/000066239.
- Bogardus M. Comparison of the center for epidemiology studies depression scale and beck depression inventory for research with Latinas. Issues Ment Health Nurs. 2017;38(2):145–52.doi:https://doi.org/10.1080/01612840.2016.1251513.
- Rappaport M, Hall KM, Hopkins K, Belleza T, Cope DN. Disability rating scale for severe head trauma: coma to community. Arch Phys Med Rehabil. 1982;63(3):118–23.
- Reuter M, Schmansky NJ, Rosas HD, Fischl B. Within-subject template estimation for unbiased longitudinal image analysis. Neuroimage. 2012;61(4):1402–18.doi:https://doi.org/10.1016/j.neuroimage.2012.02.084.
- Desikan RS, Segonne F, Fischl B, Quinn BT, Dickerson BC, Blacker D. An automated labeling system for subdividing the human cerebral cortex on MRI scans into gyral based regions of interest. Neuroimage. 2006;31:968–80.doi:https://doi.org/10.1016/j.neuroimage.2006.01.021.
- Bernal-Rusiel JL, Greve DN, Reuter M, Fischl B, Sabuncu MR, Alzheimer’s disease neuroimaging initiative. Statistical analysis of longitudinal neuroimage data with linear mixed effects models. NeuroImage. 2012;66:249–60.doi:https://doi.org/10.1016/j.neuroimage.2012.10.065.
- Patenaude B, Smith SM, Kennedy DN, Jenkinson MA. Bayesian model of shape and appearance for subcortical brain segmentation. Neuroimage. 2011;56(3):907–22.doi:https://doi.org/10.1016/j.neuroimage.2011.02.046.
- Shi Y, Lai R, Wang DJ, Pelletier D, Mohr D, Sicotte N, Toga AW. Metric optimization for surface analysis in the Laplace-Beltrami embedding space. IEEE Trans Med Imaging. 2014;33(7):1447–63.doi:https://doi.org/10.1109/TMI.2014.2313812.
- Winkler AM, Ridgway GR, Webster MA, Smith SM, Nichols TE. Permutation inference for the general linear model. NeuroImage. 2014;92:381–97.doi:https://doi.org/10.1016/j.neuroimage.2014.01.060.
- Schnakers C, Lutkenhoff ES, Bio BJ, McArthur DL, Vespa PM, Monti MM. Acute EEG spectra characteristics predict thalamic atrophy after severe TBI. J Neurol Neurosurg Psychiatry. 2019;90(5):617–19.doi:https://doi.org/10.1136/jnnp-2017-317829.
- Zhang H. Mixed effects multivariate adaptive splines model for the analysis of longitudinal and growth curve data. Stat Methods Med Res. 2004;13(1):63–82.doi:https://doi.org/10.1191/0962280204sm353ra.
- Mahar I, Alosco ML, McKee AC. Psychiatric phenotypes in chronic traumatic encephalopathy. Neurosci Biobehav Rev. 2017;83:622–30.doi:https://doi.org/10.1016/j.neubiorev.2017.08.023.
- Edwards G 3rd, Moreno-Gonzalez I, Soto C. Amyloid-beta and tau pathology following repetitive mild traumatic brain injury. Biochem Biophys Res Commun. 2017;483(4):1137–42.doi:https://doi.org/10.1016/j.bbrc.2016.07.123.
- Holleran L, Kim JH, Gangolli M, Stein T, Alvarez V, McKee A, Brody DL. Axonal disruption in white matter underlying cortical sulcus tau pathology in chronic traumatic encephalopathy. Acta Neuropathol. 2017;133(3):367–80.doi:https://doi.org/10.1007/s00401-017-1686-x.
- McKee AC, Cairns NJ, Dickson DW, Folkerth RD, Keene CD, Litvan I, Perl DP, Stein TD, Vonsattel JP, Stewart W. The first NINDS/NIBIB consensus meeting to define neuropathological criteria for the diagnosis of chronic traumatic encephalopathy. Acta Neuropathol. 2016;131(1):75–86.doi:https://doi.org/10.1007/s00401-015-1515-z.
- DeVos SL, Hyman BT. Tau at the crossroads between neurotoxicity and neuroprotection. Neuron. 2017;94(4):703–04.doi:https://doi.org/10.1016/j.neuron.2017.05.001.
- Ittner A, Chua SW, Bertz J, Volkerling A, van der Hoven J, Gladbach A, Przybyla M, Bi M, van Hummel A, Stevens CH, et al. Site-specific phosphorylation of tau inhibits amyloid-β toxicity in Alzheimer’s mice. Science. 2016;354(6314):904–08.doi:https://doi.org/10.1126/science.aah6205.
- Brion JP, Smith C, Couck AM, Gallo JM, Anderton BH. Developmental changes in tau phosphorylation: fetal tau is transiently phosphorylated in a manner similar to paired helical filament-tau characteristic of Alzheimer’s disease. J Neurochem. 1993;61(6):2071–80.
- Fuster-Matanzo A, de Barreda EG, Dawson HN, Vitek MP, Avila J, Hernández F. Function of tau protein in adult newborn neurons. FEBS Lett. 2009;583(18):3063–68.doi:https://doi.org/10.1016/j.febslet.2009.08.017.
- Hong XP, Peng CX, Wei W, Tian Q, Liu YH, Yao XQ, Zhang Y, Cao FY, Wang Q, Wang JZ. Essential role of tau phosphorylation in adult hippocampal neurogenesis. Hippocampus. 2010;20(12):1339–49.doi:https://doi.org/10.1002/hipo.20712.
- Fuster-Matanzo A, Llorens-Martín M, Jurado-Arjona J, Avila J, Hernández F. Tau protein and adult hippocampal neurogenesis. Front Neurosci. 2012;6:104.doi:https://doi.org/10.3389/fnins.2012.00104.
- Oblinger MM, Das GD. Neurogenesis in the brain stem of the rabbit: an autoradiographic study. J Comp Neurol. 1981;197(1):45–62.doi:https://doi.org/10.1002/cne.901970105.
- Sohur US, Emsley JG, Mitchell BD, Macklis JD. Adult neurogenesis and cellular brain repair with neural progenitors, precursors and stem cells. Philos Trans R Soc Lond B Biol Sci. 2006;361(1473):1477–97.doi:https://doi.org/10.1098/rstb.2006.1887.
- Uematsu M, Nakamura A, Ebashi M, Hirokawa K, Takahashi R, Uchihara T. Brainstem tau pathology in Alzheimer’sdisease is characterized by increase of three repeat tau and independent of amyloid β. Acta Neuropathol Commun. 2018;6(1):1.doi:https://doi.org/10.1186/s40478-017-0501-1.
- Yu CC, Jiang T, Yang AF, Du YJ, Wu M, Kong LH. Epigenetic modulation on tau phosphorylation in Alzheimer’s disease. Neural Plast. 2019;2019:6856327.doi:https://doi.org/10.1155/2019/6856327.
- Olsson B, Lautner R, Andreasson U, Öhrfelt A, Portelius E, Bjerke M, Hölttä M, Rosén C, Olsson C, Strobel G, et al. CSF and blood biomarkers for the diagnosis of Alzheimer’s disease: a systematic review and meta-analysis. Lancet Neurol. 2016;15(7):673–84.doi:https://doi.org/10.1016/S1474-4422(16)00070-3.