
ABSTRACT
Examine effects of high-intensity exercise and physical impacts during rugby match on self-report symptoms in The Sport Concussion Assessment Tool (SCAT3), and its ability to differentiate head-injured players from controls.
Methods
Symptoms were assessed immediately following completion of a rugby match (median 60 minutes). Players removed from the match for assessment due to a head hit were classified as head injured. Controls completed match without head hit.
Results
209 players (67 female; 33 ± 13 years) participated with 80 experiencing a head injury. Symptom severity was significantly greater in head injured (26.2 ± 17.6) compared with controls (8.9 ± 11.5, P < 0.001). 21% of control players reporting >16 symptom severity, misclassifying them as suspected concussion. There were no significant sex differences. Factor analysis produced four symptom clusters of which Headache was most discriminatory between the head injured (median = 1.7) and controls (median = 0.0).
Conclusion
These findings demonstrate that exercise and contact during a game affect symptom assessment, increasing the likelihood of misclassifying players with suspected concussion. Factor characterization of symptoms associated with head injury using an exercised comparison group provides more useful discrimination. These results highlight the necessity for objective measures to diagnose concussions outside of symptom self-report.
Introduction
Sports-related concussions have become a major health concern. According to the Center for Disease Control and Prevention, it is estimated that there are 1.6–3.8 million concussions occurring annually. While head injury commonly occurs in contact and collision sports, it has been challenging to establish a clear understanding of the mechanisms underlying such an injury. A head injury can occur when there are intracranial or extracranial injuries that may injure the scalp, skull, brain, and underlying tissue and vessels which may result in concussion, skull fracture, or intracranial hematoma (Citation1). Currently, a head injury has a broad definition and may vary according to methodological differences among studies (Citation1, Citation2). In sports, the vast majority of head injuries do not involve skull fractures or hematomas but do increase the likelihood of a concussion and are defined as injuries that may be caused either by a direct blow to the head, face, neck, or elsewhere on the body with an impulsive force transmitted to the head (Citation2–4), which may have various clinical signs such as psychological stress, cognitive impairment, somatic symptoms, and neurological deficiencies (Citation5). However, the changes that occur over seconds, minutes, and hours to days post-concussion are complex and may involve uncharacterized irreversible neurological pathology. Today, concussions are clinically diagnosed with the aid of self-reported symptoms, as well as examining postural control, ocular/vestibular control, and neurocognition (Citation6). Although the symptoms of concussions are typically reported to resolve within two weeks, there is increasing evidence of neurological abnormalities beyond this time frame (Citation7–9). Early identification of concussion symptoms will enhance appropriate diagnosis and management of recovery (Citation10). Thus, there is a need for practical sideline assessments and guidelines to determine recovery and safe return to play for players immediately after a head injury.
The Sport Concussion Assessment Tool (SCAT) was created in 2005 to form a standard evaluation that could be used by clinicians to assess concussions. Since its formation, the SCAT has had several revisions and is now the most commonly used evaluation by medical professionals and researchers for sideline assessment (Citation4, Citation11–13). The tool has been shown to be effective in differentiating players with and without a concussion (Citation13).
Although there is currently no gold standard to identify a concussion, the SCAT provides relevant information that may be able to assist in distinguishing players with and without a concussion (Citation14). A SCAT study using Classification and Regression Tree (CART) analysis demonstrated that symptom severity is the most discriminating measure correctly detecting non-concussed from concussed players (Citation13). When a player is injured, the procedure is to have a healthcare provider examine the player using standard guidelines (Citation4). If there is no healthcare provider available, the players should not be allowed to continue to play until they obtain proper medical care (Citation4,Citation15). It is important to acknowledge that it is uncommon to have team healthcare providers present in recreational sports (Citation16). Although the SCAT is widely used as a swift sideline assessment, it should not be used as a definitive diagnosis (Citation3,Citation4).
One possible limitation to interpretating SCAT data is the lack of comparable control groups to the concussed group in many studies. Typically, post-injury SCAT scores are compared to either baseline measures for that player or a control group of similar uninjured players. However, these players are normally rested (i.e baseline) and have not recently played the associated sport (Citation14, Citation17–23). Thus, they may not experience numerous symptoms that are associated with the effect of intense exercise and injury to other areas of the body besides the head. Headaches, fatigue, and balance problems are symptoms that have been reported to increase following exercise (Citation24,Citation25). In healthy adults, symptom severity and total number of symptoms within the Sport Concussion Assessment Tool 3 (SCAT3, Version3) have been shown to significantly increase following intense aerobic exercise (Citation26). Additionally, brain blood flow has been shown to increase during exercise influencing the pre-frontal cortex and improving cognitive performance post exercise (Citation27). Consequently, SCAT components are subject to change with intensity of exercise, complicating the interpretation of the results (Citation26,Citation28).
Understanding the prevalence of “normal” symptoms post-game in males and females is critical when using the SCAT to differentiate the symptomatic outcomes of a concussion (Citation14). Studies have identified females have up to twice the risk for sport-related concussion than men in comparable sports (Citation29). Previous studies analyzing symptom inventory have shown that women tend to endorse more symptoms following a head injury (Citation22, Citation30–34) and throughout recovery than men (Citation35, Citation36), while others report no sex difference post-concussion (Citation23, Citation33) or at baseline (Citation21, Citation33, Citation37). The lack of consensus in previous data indicates the importance of taking sex differences into account when characterizing symptoms following a concussion. Additionally, factor analytics have been used to cluster similar individual symptoms into factor solutions to better evaluate, manage, and treat sports-related concussions (Citation38, Citation39). Current characterized factors in research are limited by data including only baseline factor characterization or concussion factor characterization (Citation21, Citation40). No studies have characterized all symptom factors that may be present immediately following a match while considering exercise symptoms; and then run analysis to determine which factors are most related to players who have experienced a head injury compared with non-rested controls.
The present study involves an analysis of SCAT data from a larger study examining physiological data immediately post injury. The larger study was able to recruit rugby players on the field immediately after a head injury had occurred. Controls for the study were players who also just played a rugby match but did not experience a head injury. This gave us a unique opportunity to examine the effects of high intensity exercise and contact on symptoms without a head injury.
Given this opportunity, our specific objectives were to 1) determine whether the symptom scores could identify players with and without a head injury following a match while taking the exercise component into account 2) evaluate the SCAT3 component scores in both male and female players. We hypothesized the following: 1) Players with a head injury would report more symptoms, but the control players who just played a match would also report symptoms overlapping with symptoms reported by players with a head injury 2) Factor analysis would determine which symptom clusters were more sensitive to players with head injury when compared to exercised controls. 3) There would be significant differences between men and women in the SCAT3 subcomponent scores, specifically the symptom severity and total number of symptoms.
Methods
Subjects
This study is part of a larger research project that utilizes noninvasive physiological measures to obtain immediate data after a head injury to investigate if physiological markers can be used to understand concussion severity and recovery between women and men. Participants for this study were recruited at a number of recreational rugby tournaments including the annual CANAM recreational rugby tournament in Lake Placid/Saranac Lake, NY, and the Four Leafs Rugby Tournament, Randall’s Island, NY between August 2013 and August 2019. The study had a total of 209 participants (142 men, 67 women). Of the 209, 80 (52 men and 28 women) experienced an injury to the head, and 129 were players who played a match and did not experience an injury to the head (90 men and 39 women). Participants between the ages of 18 and 66 years (33 years ± 13 years) who just played a rugby match were eligible to participate in the study. Players that experienced a head injury during the match were removed from the game and sent for assessment by the medical team which consisted of athletic trainers. If no further medical treatment was required, players were offered the opportunity to participate in this study. Control players were recruited after they had just finished a rugby match without an injury that required medical assessment. Players were assessed within a median of 60 minutes (IQR, 90; 68.8% of the participants were under 90 minutes, 82.6% were under 120 minutes) from time of head injury and time coming off pitch for controls. Informed written consent was obtained by a qualified staff member.
Outcome measures
This study used SCAT3 (version 3) which was developed following the 4th International Conference on Concussion in Sport in 2012 (Citation41). Version 3 evaluates clinical domains, including attention and memory function, to assess for a concussion (Citation30, Citation41). The most recent version, SCAT5 is used by healthcare professionals in the acute evaluation of suspected concussion, which includes the same subtests as the SCAT3, with an additional focus on cognitive assessment (Citation12). The main outcome measures were the SCAT3 Symptom Evaluation, Standardized Assessment of Concussion (SAC), and the Balance Error Scoring System (BESS). The SCAT3 Symptom Evaluation assess how the player feels at the moment of the evaluation (Citation42). During the symptom evaluation all participants were asked to score themselves on the following symptoms, “based on how they feel right now.” The total number of symptoms is based on the severity of 22 common post-concussive symptoms, each scaled 0–6 (0 no symptoms, 1 and 2 mild symptoms, 3 and 4 moderate symptoms, 5 and 6 severe symptoms), with a maximum score of 132. The SAC is a cognitive assessment that evaluates orientation (5 questions), immediate memory (free recall of a list of 5 words in 3 trials), concentration (digits-backward task and recall of months in a year), and delayed recall (recall a 5-word list given during the initial memory test when they finish the balance and coordination test) (Citation42). The score range is 0–30, with higher scores representing better performance (Citation42). During the SAC evaluation, the alternate word list and alternate number list were used to promote random administration (Citation43). The BESS assesses stability during different stance conditions by counting stability errors while participants perform three positions for 20 seconds each; the maximum number of errors per trial is 10 (Citation42). The Glasgow Coma Scale and Maddocks questions were not collected in players, as they are not typically used as a sideline assessment (Citation14). Due to time constraints, background questions only included age, sex, and additional health questions.
Data collection and protocol
All procedures were approved by the Rutgers University Institutional Review Board. Data collection was performed in tents set up alongside the athletic field. Information regarding demographics, previous head injuries, and mechanism of injury were recorded. When the informed consent and screening process were complete, the SCAT3 was administered by a trained study member. A clinical neuropsychologist trained personnel on how to administer the SCAT3. Trained personnel tested participants on the sideline one-on-one at rest. In this study, we use the term “head injury” (Citation1) to define a direct hit/blow to the head during a rugby match, that resulted in sending the rugby player with a possible concussion to the medical tent for evaluation. Players were classified as controls if they recently played a rugby match without experiencing a direct hit/blow to the head. Time of injury was self-reported by the player as well as time since they last played a match.
Statistical Analysis
Summary statistics including mean and standard deviation were used for continuous variables. Frequency and percentage were used for categorical variables. The covariates of interest included the total number of symptoms (out of 22 symptoms), symptom severity (0–6 ratings), SAC score (orientation, immediate memory, concentration, delayed recall, and balance error score (leg stances). Analysis compared the listed covariates in players with and without a head injury. As the measures were positively skewed, it was determined by our statistician that a Mann-Whitney U-test (non-parametric test) was employed to evaluate the difference in median symptom scores between players with a head injury and control players, separated by sex, median and interquartile range are reported. Covariate analysis was performed assess the effect of previous concussion history and age on total symptom severity. The effect size for non-parametric tests was calculated using r = Z√N (Citation44,Citation45) in which 0.1 (small effect), 0.3 (moderate effect) and 0.5 and above (large effect) (Citation45). An exploratory factor analysis (EFA) using principal component analysis was used to reduce the number of items by grouping symptoms into components to determine if certain symptoms are more prevalent in players with an acute head injury (Citation46, Citation47). The analysis was performed with a varimax rotation with Kaiser normalization. A Kaiser–Meyer–Olkin (KMO) above 0.850, factors with eigenvalues greater than 1.0, and items were retained for further analysis if loading was above 0.4 as per previous research (Citation46). A Mann-Whitney U-test, using a Bonferroni correction (adjusted to 0.0125) was performed on the mean symptom cluster scores to observe if there were any differences among players with a head injury and control players immediately following a match. Logistic regression was used to identify factor solutions associated with a head injury. Statistical significance for testing was determined at α = 0.05. All statistical analyses were conducted using IBM SPSS Version 26.
Results
Demographics characteristics of players
A summary of the participant demographics is reported in . Both the head injury group and control group had a similar distribution of players with females representing 35% of the head injury group and 30% of controls (P = 0.40). The players with a head injury and control players were also similar in age, 32.9 ± 13 years, and level of education, 17 ± 5 years. The median time to evaluation was 60 minutes after injury for players who experienced a head injury and 72 minutes after active participation in match for control players without an injury to the head.
Table 1. Distribution of age and sex among players who just play a match.
SCAT3 performance among players with and without a head injury
Summary statistics of SCAT3 symptom performance among players with a head injury and control players are shown in . The symptoms for players with a head injury were elevated, ranging from 1.92 ± 1.71 for feeling slowed down in men and 2.43 ± 1.35 for headache in women. The reported symptoms for the controls were significantly lower, with means ranging from 0.17 ± 0.63 for Nausea/ Vomiting in men and 0.03 ± 0.16 for sensitivity to light in women to 1.00 ± 1.37 for fatigue in men and 1.18 ± 1.54 for fatigue in women. The symptoms endorsed by players with a head injury were greater than those without a head injury. Self-reported symptoms were significantly greater in players with a head injury 26.16 ± 17.6 compared with control players 8.93 ± 11.5, P < 0.001. There was no direct effect on symptom severity resulting from previous head injury (3 ± 4, P = 0.77) or age (32 ± 13, P = 0.48) when analyzed as covariates.
Table 2. Descriptive Statistics for players with a head injury and control players separated by Sex. The mean and standard deviation for the classified players with a head injury and control players are reported.
displays the SCAT3 performance among rugby players with and without a head injury. Values presented are means, standard deviations, and results for Mann Whitney’s U-Test are displayed in and values presented are medians, interquartile ranges, and effect size. Players classified as head injury (median of 11 and range of 8) were found to report significantly more symptoms (P < 0.001, large effect size r = 0.53) compared to controls (median of 3 and range of 4), greater severity (P < 0.001, large effect size r = 0.55), but with 41% of the control players reporting symptoms above a median score of 6, and 11% reporting symptoms above a score 23 which was the median score for the head injury group. Additionally, significant differences were found in SAC total, players classified as head injury (median of 25 and range of 5) compared to players classified as control (median of 2 and range of 3) (P < 0.01, small effect size r = 0.21) (Citation45). Refer to . There were no differences in Total BESS (P = 0.75, small effect size r = 0.02) in players with a head injury (median of 5 and range of 7) and control players (median of 5 and range of 7). Refer to .
Figure 1. SCAT3 Components in players with a head injury and control players. Depicts the total number of symptoms (Z = −7.61, P < 0.001), total symptom severity (Z = −7.89, P < 0.001), SAC total (Z = −2.46, P = 0.007), and BESS total (Z = −0.32, P = 0.739) among players with a head injury and control players. Mann-Whitney U results for the SCAT3 components.
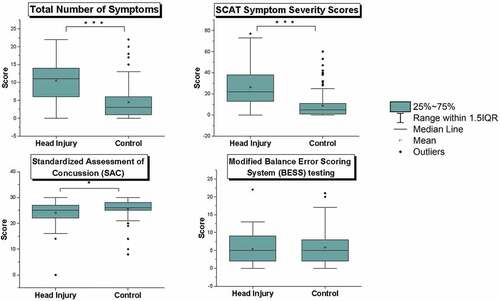
Table 3. Table 3 Mann-Whitney U-Test results for the SCAT3 components in players with a head injury and control players.
Sex Differences in the SCAT3 Components
Supplemental Table 1 shows a breakdown of each of the SCAT3 components both for the control and head injured players separated by sex. In the head injury group, there was a significant difference in symptom reporting between men and women for the symptom pressure in the head (P = 0.02), with men reporting a median of 1 and women reporting a median of 2. In the control group, SCAT3 scores differed significantly among men and women in the following areas: immediate memory (P = 0.03), single leg stance (P = 0.03), tandem leg stance (p = 0.02), SAC delayed recall (P = 0.02), and pressure in the head (P = 0.02). The median (IQR) scores were similar; the differences, while statistically significant, may not be clinically significant (see Supplemental table 1).
Symptom clusters reported by players following a match
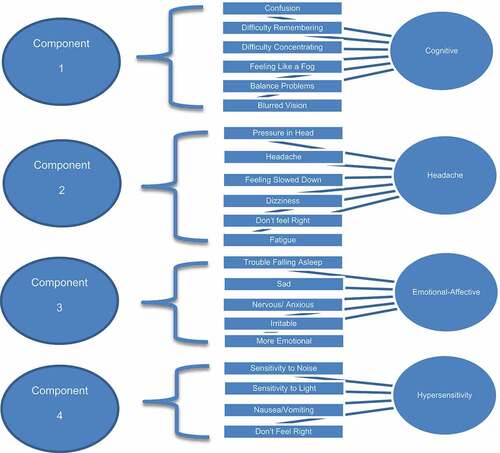
The Principal Component Analysis (PCA) supported a 5-factor solution, with a KMO measure sampling adequacy of 0.866. The 5 factors included 22 items and consisted of (1) Cognitive: 38% of the variance, eigenvalue = 8.41, 6 items related to Cognitive-Sensory (Confusion, Difficulty Remembering, Difficulty Concentrating, Feeling like a Fog, Balance Problems, Blurred Vision); (2) Headache: 8.5% of the variance, eigenvalue = 1.88, 7 items related to Headaches (Pressure in Head, Headache, Feeling Slowed down, Dizziness, Don’t Feel Right, Fatigue) (3) Emotional-Affective: 5.8% of the variance, eigenvalue = 1.27, 5 items related to emotional-affective (Sad, Nervous and Anxious, Irritable, More Emotional, Trouble Falling Asleep); (4) Hypersensitive: 5.5% of the variance, eigenvalue = 1.2, 4 items related to hypersensitivity (Sensitivity to Noise, Sensitivity to Light, Nausea/Vomiting, Don’t Feel Right). Factor (5) was responsible for 4.98% of the variance, eigenvalue = 1.1, but was not included for further analysis since there was 1 loading item, neck pain. Additionally, there were cross-loadings among the following symptoms; Feeling like a Fog (loaded under Cognitive Sensory and Headache), Feeling Slowed Down (loaded under Cognitive Sensory and Headache), Dizziness (loaded under Cognitive Sensory and Headache), Drowsiness (loaded under Headache and Emotional-Affective), Don’t Feel Right (loaded under Hypersensitive and Headache), Fatigue (loaded under Headache and Emotional Affective) and Irritable (loaded under Emotional Affective and Hypersensitive). The symptoms were retained for further analysis under the cluster in which they showed a higher loading. See factor solutions in and factor structure loadings in Supplemental Table 2.
Figure 2. Principal Component Analysis: An illustration of the factor clusters. 4 factor solutions derived from the SCAT3 symptom ratings performed by rugby players who just played a match. Refer to Supplemental Table 2 for detailed factor loadings. Cross-loading symptoms are bolded.
Symptom cluster evaluation in players who experienced an injury to the head
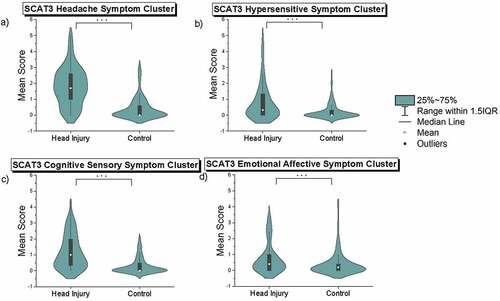
Mann Whitney’s U-Tests displayed in were performed on the four clusters to identify which clusters, if any, could show a clearer distribution difference between the symptom scores of the players who just played a game compared to a player who played a game and experienced an injury to the head. Mann–Whitney U-tests, using a Bonferroni correction (adjusted to 0.0125), revealed significant differences between the players with a head injury and control group for the following symptom clusters: Cognitive-Sensory (p < 0.001), Headache (p < 0.001), Emotional-Affective (p < 0.004), and Hypersensitive (p < 0.001). The Cognitive-Sensory cluster showed players with a head injury report a median of 1.0 and range of 4.3 symptom scores, while the control players report a median of 0.0 and range of 2.0. The Headache cluster (Pressure in Head, Headache, Feeling Slowed down, Dizziness, Don’t Feel Right, Fatigue) showed players with a head injury report a median of 1.7 and range of 5 symptom scores, while the controls report a median of 0.0 and range of 3.0; of which only 6% reported above the median of 1.7 in the symptoms listed under the factor Headache. Emotional Affective showed players with a head injury report a median of 0.4 range of 3.4 symptom scores, while the controls report mean scores with a median of 0.2 and a range of 4.4. Hypersensitive showed players with a head injury report a median of 0.3 and range of 5.0 symptom scores, while the controls report a median of 0.0 and range of 2.7. The mean scores of the symptom clusters are in .
Figure 3. Depicts the mean scores of the 4 symptom clusters: a) Headache (Z = 8.66, P < 0.001);, b) Hypersensitive (Z = 4.64, P < 0.001); c) Cognitive-Sensory (Z = 7.14, P < 0.001), and d) Emotional Affective (Z = 3.29, P = 0.001) among the identified control and players with a head injury. Mann-Whitney U results for the SCAT3 Symptom Clusters.
The most predictive symptom clusters of players who experienced an injury to the head
A logistic regression with four predictor variables was used to examine what factors immediately following a rugby match could identify players with and without a concussion. The following factors were significant: Cognitive-Sensory (p < 0.001), Hypersensitive (p = 0.001), and Headache (p < 0.001). Emotional-Affective (p = 0.20) was not significant. Classification results indicated that 91.3% of the control rugby players and 65.4% of the players with a head injury were correctly classified, with the model correctly predicting 81.5% of the cases. Refer to for detailed regression outcomes.
Table 4. Regression analysis was performed on the 4-factor solution derived from the SCAT3 symptom ratings to identify which factors are predictive of players who experienced an injury to the head.
Discussion
This study demonstrates three main findings; 1) participation in a high intensity exercise contact sport without receiving a head injury can in some players result in increased symptoms that appear similar to players that have suffered a head injury; 2) SCAT3 scores of symptom reporting and severity were significantly greater in players who had experienced a head injury compared with controls; 3) Principal Component Analysis demonstrated that the symptom clusters of Cognitive, Hypersensitive and Headache were most predictive in discriminating which players had a head injury.
Confounding effect of exercise on symptom reporting
This study highlights the importance of considering the effect of exercise intensity and physical contact during sports on the self-reported symptoms and severity scores during the SCAT3. Concussion work by McCrea investigated the Graded Symptom Checklist (GSC) postgame/post practice in collegiate football players and found there was a significant difference in the symptom scores between the concussed and control players. However, unlike our study, there was no overlap in post-game symptoms when comparing the control players to concussed players, and the players also reported similar baseline and post-game symptom scores (Citation48). These differences in findings could be due to several reasons. McCrea et al examined players who were diagnosed as having a concussion, compared to our players who had suffered a head injury. Interestingly, despite this difference, when comparing symptom severity, the players in McCrea’s study reported mean scores of 20.9 out of 102 (21% of max score), and our players reported 26.2 out of 132 (20% of max score). Regardless of the similarities, our players did not have a diagnosed concussion so we cannot directly compare the data. We also saw significant differences in baseline data between McCrea’s players and our controls. Using percent of max severity score, controls in McCrea’s study reported means of 1.0% compared to the 6.8% in our exercised controls. It is unclear why the controls in this study reported such low symptom severity scores (no different than preseason baseline). However, the postgame/postpractice data in controls were imputed so this may have affected the values. Due to the much lower symptoms severity scores in controls, there was little overlap in severity scores between controls and concussed players, unlike our data with significant overlap.
Considering the work of Broglio et al. 2019 that determined symptom severity was the most discriminating measure with scores <16 indicating a non-concussed player (96% specificity) (Citation13). In the current data set, 21% of the control group that had recently completed intense exercise without a head injury reported symptoms >16, which would have classified them as concussed according the Broglio criteria. This is consistent with previous work which has demonstrated increased symptom severity in exercised participants compared with rested participants (Citation24–26). Similarly, our exercised control players experienced both increased severity and number of symptoms, resulting from the physical stresses of recently participating in a high-intensity contact sport. Thus, when comparing the values, while significantly less, there remained clear overlap in some symptom categories between the controls and the players who had experienced a head injury (). This is consistent with previous literature which has demonstrated that exercise is associated with changes in the number of self-reported concussion symptoms and symptom severity scores (Citation26), increases in fatigue scores following treadmill testing (Citation37), and increases in number of symptoms following submaximal (Citation49) and maximal exercise (Citation24).
Thus, these data suggest that it is important to consider the comparison group used when examining symptoms reported following a concussion. Previous studies have utilized the SCAT3 during rested baseline conditions and then compared those scores to post-concussion. However, the concussed players have not only experienced a head injury, but have also been involved in significant exercise while playing a sport (Citation24). This results in a confound of comparing a rested condition without a head injury to an exercise state with a head injury. At rest, participants tend to report fewer total number of symptoms compared to following exercise (Citation24,Citation26). Thus, symptoms endorsed following a head injury would represent symptoms, both from the head injury and from the intense exercise of the high-injury contact sport just played (Citation21).
The control players in this dataset likely reported increased symptoms due to their recent participation in a high-intensity collision sport, rugby in this case, which can cause an elevation in symptoms due to exercise intensity, inflammation, and dehydration. Symptoms associated with maximal exercise may include fatigue, feeling slowed down, dizziness, and pressure in the head (Citation24, Citation26). In addition, symptoms could be due to injuries other than head injuries, increasing the total number of symptoms and symptom severity (Citation50). Following exercise, induced dehydration is likely to occur, which could cause symptoms, such as headache, feeling in a fog, and feeling slowed down to increase (Citation51). The physiological effects of exercise, inflammation, and dehydration could result in clinical symptoms being reported that are similar to those following a concussion. Given the prominence of self-report symptoms in concussion assessment, it is important when doing sideline assessments to distinguish which symptoms are likely the result of intense exercise in players, versus those that are associated with the head injury.
SCAT3 performance among players with and without a head injury
The findings of this study support previous outcomes showing that the symptom severity scale and the total number of symptoms differ among players with and without a head injury, while the other SCAT3 components do not (Citation22,Citation50). While symptom scores were greater in the players with head injury, intense exercise also resulted in increased reporting of symptoms on the SCAT. This may explain why the data isn’t clinically significant for some of the symptoms reported between the injury and control group. The differences found in the cognitive examination (SAC) and balance performance (total BESS) in players with or without a head injury in our study were not clinically significant and had small effect sizes. Similarly, a study observing the validity of the SCAT3 in concussed and control (baseline) players resulted in a small-to-medium effect size for the SAC and BESS, with a poor ability for the components to discriminate between concussed and control players (Citation52). In addition, a previous study evaluating the effects of exercise on the SCAT3 showed that exercise could influence performance in balance and gait (Citation24), which could explain why the difference found on balance performance in these data was not clinically significant (Citation24). Unlike recent datasets, our data compare control players with similar exercise and contact exposure, which could influence BESS performance, making the test less sensitive to head injury symptoms. It remains unclear how balance performance is affected by sports-related concussion; there is a dire need for additional measures that can detect subtle deficits among players who just participated in a game without a head injury compared with those who experienced a head injury.
Sex differences in the SCAT3 components
In this sample of rugby players, we did not find any sex differences in players with an injury to the head. However, there were differences, although not clinically significant, between the men and women in the control group in the following components: immediate memory, single leg stance, tandem leg stance, SAC Delayed Recall and pressure in the head. In contrast to previous studies where women tend to report more symptoms (Citation22, Citation30–32), our data did not demonstrate a statistically significant differences between men and women in the number and severity of symptoms reported. Similarly, a meta-analysis reported no sex differences between men and women post-concussion, except for women reporting lower confusion scores then men (Citation23, Citation33). Importantly, a large cohort study also found no sex differences in recovery among collegiate players (Citation53). Although we also did not find significant sex differences, it is important to consider sex differences in symptom reporting, as previous data has found differences (Citation22, Citation33).
Symptom clusters reported by players following a match
A principal component analysis was performed to better understand which symptom clusters derived from the SCAT3 were commonly reported following the intense exercise of a sports match. The results retained a 4-factor structure in order of contribution to the overall variance; Cognitive-Sensory (Confusion, Difficulty Remembering, Difficulty Concentrating, Feeling like a Fog, Balance Problems, Blurred Vision); (2) Headache (Pressure in Head, Headache, Feeling Slowed down, Dizziness, Don’t Feel Right); (3) Emotional-Affective (Sad, Trouble Falling Asleep, Nervous and Anxious, Drowsiness, More Emotional); (4) Hypersensitive (Sensitivity to Light, Sensitivity to Noise, Irritable). In summary, the first cluster, Cognitive-Sensory, demonstrates the most variation of the symptoms in the projected data set (with each symptom listed in order of influence), while the second cluster Headache shows the next highest variance, and so on. Previous factor characterization has been performed on Post-Concussion Symptom Scale (PCSS) (Citation21, Citation54) resulting in an analysis on set of baseline symptom clusters, and then a separate analysis on set of concussed symptom clusters. An important finding in this study, is that the symptoms within each of these factors were retained by performing a PCA analysis on the entire data set, highlighting how these symptoms may be related to players’ recent participation in a high-injury contact sport, and not just a PCA analysis on players who experienced a head injury compared with controls. Importantly, previous studies comparing exercise to rested baseline found symptoms such as feeling like a fog, feeling slowed down, dizziness, headache, and pressure in the head (Citation24, Citation26, Citation51) were reported by the exercise group. In observing these findings, we can see that those symptoms are also reported within the first two factors in this analysis. Clinicians involved in the sideline care of players should consider the possible symptoms that could be induced by a player’s recent participation in a contact sport when interpreting the SCAT3, specifically the symptoms. Rugby is considered a sport with repeated and intense physical contact while performing high intensity exercise. This principal component analysis retained four factors composed of symptoms that may be present in players who just played an intense match, not just the players who experienced a head injury.
Symptom cluster evaluation in players who experienced a head injury
In examining the mean scores of the symptom clusters, we explored whether specific clusters could demonstrate less overlap between group, to better distinguish between players with a head injury (exercised with a head injury) and those without (exercised controls) in this study. The results showed a significant difference among the four identified symptom clusters (Cognitive-Sensory, Headache, Emotional-Affective, Hypersensitive). However, as seen in , the distribution differs most in the symptom cluster “Headache” composed of: Pressure in Head, Headache, Feeling Slowed down, Dizziness, and Don’t Feel Right. Under this cluster only 6% of the control players reported symptoms above the median. Clinically, the symptoms listed within this cluster may provide a better indicator of players who experienced a head injury and are more at risk of a concussion compared to players who just played a game. These clusters have the potential to be used to predict a pattern across players who have experienced a head injury
The most predictive symptom clusters of players who experienced a head injury
A logistic regression was performed on the 4 factors to investigate which components were most associated with players who had a head injury. The regression results showed that the Cognitive-Sensory, Hypersensitive and Headache clusters were most predictive of head injury status in the group of players who had all completed intense exercise. Emotional-Affective (Sad, Trouble Falling Asleep, Nervous and Anxious, Drowsiness, More Emotional) was not significant, which is not surprising since one of the symptoms within that factor is trouble falling asleep which cannot be due to the immediate effects of a head injury. However, we cannot rule out that this symptom could have contributed to risk of concussion since poor sleep may have increased vulnerability to receive a head injury during a match. Altogether, these findings may provide future guidance on symptom clusters that could be examined as of greater value for use in diagnosis of concussion. Examination of a larger dataset using the outlined symptom clusters could be analyzed using an ROC analysis and specificity tests to determine if the symptoms listed within the Cognitive-Sensory, Hypersensitive and Headache clusters from the initial PCA analysis are more clinically important for on-field immediate diagnosis of a head injury.
Limitations
A limitation related to concussion diagnosis is the lack of consistency and no clear gold standard. There are different screening exams used in conjunction depending on the physician and study to arrive at a diagnosis. This makes it difficult to interpret results between different studies. While this study reveals several important findings, a limitation is that we did not have a direct diagnosis of concussion. According to the 5th international consensus “SRC may be caused either by a direct blow to the head, face, neck or elsewhere on the body with an impulsive force transmitted to the head.” The players in this study experienced a direct hit/blow to the head (Citation4). Additionally, there were multiple data collection sites requiring multiple administrators able to assess players at each location. All administrators were trained to perform the SCAT3 but a limitation is that this study did not assess inter- and intra-rater reliability.
This study did not have rested controls, which would be needed to observe the differences among non-injured rested players, non-injured exercised players, and players with a head injury. Additionally, during the Principal Component Analysis, there was a complexity naming the factors because some of the names given to the factors may not precisely capture all the variables within that factor. For example, some variables may load onto multiple factors, which may indicate a correlation with each other, but not with the overall factor. Further analysis is needed for symptoms that cross-loaded with loadings > 0.4 within multiple factors. Another limitation of this work is the relatively small sample size, which may have contributed to the lack of sex differences observed in this study compared to previous studies. Finally, covariates related to comorbidities and playing time were not controlled for.
Overall summary
While investigating the core physiological findings of the larger study and correlating them to the symptoms, it was evident that the exercised controls were reporting increased symptoms as well. Thus, the present study examined how symptom reporting may have been affected by a high level of physical exertion and how this may affect the use of self reported symptoms as a rapid sideline assessment to assess head injury. To our knowledge, this is the first study to report SCAT factor characterization values in players with a head injury and control players immediately following a match, when both have participated in high intensity exercise. These data demonstrate that exertion during a match increased the number and severity of self-reported symptoms in control players, even though they had not experienced a head injury, which could lead to difficulty differentiating these players from those that had experienced a head injury. In addition, our work finds that symptom clusters associated with Headache and Cognitive-Sensory were the most sensitive to detecting differences between the players with a head injury and control players. To date, there is no objective measure to detect sports concussions on field, making it difficult for clinicians to diagnose, predict, and monitor recovery in players. The aggregate findings of this paper provide a novel approach to assessing head injuries on field using the SCAT3 that can be used to interpret objective physiological measures. The current findings will allow us to investigate if the symptoms listed under “Headache,” are correlated to initial physiological outcomes in players with a head injury. Understanding prominent symptoms and nonobjective markers can strengthen side-line assessments. Future work could examine if these symptom clusters could be used to better diagnose concussion in players who just played an intense match.
Supplemental Material
Download MS Excel (14.2 KB)Acknowledgements
Authors wish to thank the many rugfby players who attended the CanAm rugby tournament that donated their time and support for the study. We would also like to thank the organizers of the tournament and the Mountaineers Rugby Club for inviting us to participate. Authors also gratefully acknowledge Professor Anne Crecelius, Phd, Allan Knox PhD, Levy Reyes PhD; Apollonia Fox PhD, Melissa Blatt RN, Valentin Siderskiy, Thuy Tien Le, Kelly Brewer, Paige Kompa, Melissa McSwain, Bishoy Sammy, Lesley de la Cruz, Kamala Migdal, Justyna Michalik, Jacqueline Klein, Amanda Acosta, Bemin Ghobreal, Dolu Mosadouwa and Faria Sanjana for their contributions to this work.
Disclosure statement
No potential conflict of interest was reported by the author(s).
Supplementary material
Supplemental data for this article can be accessed online at https://doi.org/10.1080/02699052.2023.2184868
Additional information
Funding
References
- Tse KM, Lim SP, Tan VBC, Lee HP . A review of head injury and finite element head models. Am J Eng Technol Soc 2014;1:28–52.
- Prien A, Grafe A, Rössler R, Junge A, Verhagen E .Epidemiology of Head Injuries Focusing on Concussions in Team Contact Sports: a Systematic Review. Sports Med. 2018;48(4):953–69.doi:10.1007/s40279-017-0854-4.
- Patricios JS, Ardern CL, Hislop MD, Aubry M, Bloomfield P, Broderick C, Clifton P, Echemendia RJ, Ellenbogen RG, Falvey ÉC, et al. Implementation of the 2017 Berlin Concussion in Sport Group Consensus Statement in contact and collision sports: a joint position statement from 11 national and international sports organisations. Br J Sports Med. 2018;52(10):635–41.doi:10.1136/bjsports-2018-099079.
- McCrory P, Meeuwisse W, Dvorak J, Aubry M, Bailes J, Broglio Broglio S, Cantu RC, Cassidy D, Echemendia RJ, Castellani RJ, et al. Consensus statement on concussion in sport—the 5th international conference on concussion in sport held in Berlin, October 2016. Br J Sports Med.2017;51(11): 838–847. doi:10.1136/bjsports-2017-097699.
- Mustafi SM, Harezlak J, Koch KM, Nencka AS, Meier TB, West JD, Giza CC, DiFiori JP, Guskiewicz KM, Mihalik JP, et al. Acute White-Matter Abnormalities in Sports-Related Concussion: a Diffusion Tensor Imaging Study from the NCAA-DoD CARE Consortium. J Neurotrauma. 2018;35(22):2653–64.doi:10.1089/neu.2017.5158.
- Deakin ND, Suckling J, Hutchinson PJ.Research Evaluating Sports ConcUssion Events—Rapid Assessment of Concussion and Evidence for Return (RESCUE-RACER): a two-year longitudinal observational study of concussion in motorsport. BMJ Open Sport & Exer Med. 2021;7(1):e000879.doi:10.1136/bmjsem-2020-000879.
- Len TK, Neary JP.Cerebrovascular pathophysiology following mild traumatic brain injury. Clin Physiol Funct Imaging. 2011;31(2):85–93.doi:10.1111/j.1475-097X.2010.00990.x.
- Hutchison MG, Schweizer TA, Tam F, Graham SJ, Comper P . FMRI and brain activation after sport concussion: a tale of two cases. Front Neurol. 2014;5:46 doi:10.3389/fneur.2014.00046.
- Wright AD, Smirl JD, Bryk K, Fraser S, Jakovac M, van Donkelaar P . Sport-Related Concussion Alters Indices of Dynamic Cerebral Autoregulation. Front Neurol. 2018;9:196 doi:10.3389/fneur.2018.00196.
- Jackson WT, Starling AJ.Concussion Evaluation and Management. Medi Clin of North America. 2019;103(2):251–61.doi:10.1016/j.mcna.2018.10.005.
- Zhang R, Behbehani K, Levine BD.Dynamic pressure-flow relationship of the cerebral circulation during acute increase in arterial pressure. J Physiol. 2009;587(Pt 11):2567–77.doi:10.1113/jphysiol.2008.168302.
- Echemendia RJ, Meeuwisse W, McCrory P, Davis GA, Putukian M, Leddy J, Makdissi M, Sullivan SJ, Broglio SP, Raftery M, et al. The Sport Concussion Assessment Tool 5th Edition (SCAT5). Br J Sports Med. 2017;51(11): 848–850.doi:10.1136/bjsports-2017-097506.
- Broglio SP, Harezlak J, Katz BP, Zhao S, McAllister TW, McCrea MA . CARE Consortium Investigators. Acute Sport Concussion Assessment Optimization: A Prospective Assessment from the CARE Consortium. Sports Med. 2019;49(12):1977–87.doi:10.1007/s40279-019-01155-0.
- Downey RI, Hutchison MG, Comper P.Determining sensitivity and specificity of the Sport Concussion Assessment Tool 3 (SCAT3) components in university athletes. Brain Injury. 2018;32(11):1345–52.doi:10.1080/02699052.2018.1484166.
- McCrory P, Meeuwisse WH, Aubry M, Cantu RC, Dvořák J, Echemendia RJ, Engebretsen L, Johnston K, Kutcher JS, Raftery M, et al., Consensus Statement on Concussion in Sport: the 4th International Conference on Concussion in Sport, held in Zurich, November 2012. Br J Sports Med. Zurich 2013, doi:10.1136/bjsports-2013-092313. PMID: 23479479. 47(5): p. 250–8.
- Dietzen CJ, Topping BR.Rugby football. Physical Medicine and Rehabilitation Clinics of North America. 1999;10(1):159–75.doi:10.1016/S1047-9651(18)30221-3.
- Putukian M, Echemendia R, Dettwiler-Danspeckgruber A, Duliba T, Bruce J, Furtado JL , Murugavel M . Prospective clinical assessment using Sideline Concussion Assessment Tool-2 testing in the evaluation of sport-related concussion in college athletes. Clin J Sport Med. 2015;25(1):36–42.doi:10.1097/JSM.0000000000000102.
- Vernau BT, Grady MF, Goodman A, Wiebe DJ, Basta L, Park Y , Arbogast KB, Master CL . Oculomotor and Neurocognitive Assessment of Youth Ice Hockey Players: baseline Associations and Observations After Concussion. Dev Neuropsychol. 2015;40(1):7–11.doi:10.1080/87565641.2014.971955.
- Wang Y, Nelson LD, LaRoche AA, Pfaller AY, Nencka AS, Koch KM, McCrea MA. Cerebral Blood Flow Alterations in Acute Sport-Related Concussion. J Neurotrauma. 2016;33(13):1227–36.doi:10.1089/neu.2015.4072.
- Dettwiler A, Murugavel M, Putukian M, Cubon V, Furtado J, Osherson D . Persistent differences in patterns of brain activation after sports-related concussion: a longitudinal functional magnetic resonance imaging study. J Neurotrauma. 2014;31(2):180–88.doi:10.1089/neu.2013.2983.
- Kontos AP, Elbin RJ, Schatz P, Covassin T, Henry L, Pardini J, Collins MW . A revised factor structure for the post-concussion symptom scale: baseline and postconcussion factors. Am J Sports Med. 2012;40(10):2375–84.doi:10.1177/0363546512455400.
- Hurtubise JM, Hughes CE, Sergio LE, Macpherson AK . Comparison of baseline and postconcussion SCAT3 scores and symptoms in varsity athletes: an investigation into differences by sex and history of concussion. BMJ Open Sport & Exer Med. 2018;4(1):e000312.doi:10.1136/bmjsem-2017-000312.
- Brown DA, Elsass JA, Miller AJ, Reed LE, Reneker JC . Differences in Symptom Reporting Between Males and Females at Baseline and After a Sports-Related Concussion: a Systematic Review and Meta-Analysis. Sports Med. 2015;45(7):1027–40.doi:10.1007/s40279-015-0335-6.
- Lee JH, Howell DR, Meehan WP, Iverson GL, Gardner AJ . Effects of Exercise on Sport Concussion Assessment Tool–Third Edition Performance in Professional Athletes. Orthopaedic J Spor Med. 2017;5(9):232596711772726.doi:10.1177/2325967117727261.
- Gaetz MB, Iverson GL.Sex differences in self-reported symptoms after aerobic exercise in non-injured athletes: implications for concussion management programmes. Br J Sports Med. 2009;43(7):508–13.doi:10.1136/bjsm.2008.051748.
- Morissette M, Cordingley D, Ellis M, Macdonald P, Leiter J . The effect of maximal aerobic capacity fitness testing on Sport Concussion Assessment Tool-3 scores in healthy adult subjects. Current Research: Concussion. 2014;1:19–21.
- Moriarty TA, Mermier C, Kravitz L, Gibson A, Beltz N, Zuhl M . Acute Aerobic Exercise Based Cognitive and Motor Priming: Practical Applications and Mechanisms. Front Psychol. 2019;10:2790 doi:10.3389/fpsyg.2019.02790. .
- Alla S, Sullivan SJ, Hale L, McCrory P . Self-report scales/checklists for the measurement of concussion symptoms: a systematic review. Br J Sports Med. 2009;43(Suppl_1):i3–i12.doi:10.1136/bjsm.2009.058339.
- Bretzin AC, Covassin T, Fox ME, Petit KM, Savage JL, Walker LF, Gould D . Sex Differences in the Clinical Incidence of Concussions, Missed School Days, and Time Loss in High School Student-Athletes: part 1. Am J Sports Med. 2018;46(9):2263–69.doi:10.1177/0363546518778251.
- Guskiewicz KM, Register-Mihalik J, McCrory P, McCrea M, Johnston K, Makdissi M, Dvořák J, Davis G, Meeuwisse W . Evidence-based approach to revising the SCAT2: introducing the SCAT3: table 1. Br J Sports Med. 2013;47(5):289–93.doi:10.1136/bjsports-2013-092225.
- Giza CC, Kutcher JS, Ashwal S, Barth J, Getchius TS, Gioia GA, Gronseth GS, Guskiewicz K, Mandel S, ManleyG, et al. Summary of evidence-based guideline update: evaluation and management of concussion in sports: report of the Guideline Development Subcommittee of the American Academy of Neurology. Neurology, 2013. 80(24):p. 2250–57.
- Chiang Colvin A, Mullen J, Lovell MR, Vereeke West R, Collins MW, Groh M . The Role of Concussion History and Gender in Recovery from Soccer-Related Concussion. Am J Sports Med. 2009;37(9):1699–704.doi:10.1177/0363546509332497.
- Merritt VC, Padgett CR, Jak AJ.A systematic review of sex differences in concussion outcome: what do we know? Clin Neuropsychol. 2019;33(6):1016–43.doi:10.1080/13854046.2018.1508616.
- Alsalaheen B, Almeida A, Eckner J, Freeman J, Ichesco I, Popovich M, Streicher N, Lorincz M. Do male and female adolescents report symptoms differently after concussion? Brain Injury, 2021. 35(6):698–704. doi:10.1080/02699052.2021.1896034.
- Stone S, Lee B, Garrison JC, Blueitt D, Creed K . Sex Differences in Time to Return-to-Play Progression After Sport-Related Concussion. Sports Health. 2017;9(1):41–44.doi:10.1177/1941738116672184.
- Gallagher V, Kramer N, Abbott K, Alexander J, Breiter H, Herrold A, Lindley T, Mjaanes J, Reilly J . The Effects of Sex Differences and Hormonal Contraception on Outcomes after Collegiate Sports-Related Concussion. J Neurotrauma. 2018;35(11):1242–47.doi:10.1089/neu.2017.5453.
- Covassin T, Schatz P, Swanik CB.Sex differences in neuropsychological function and post-concussion symptoms of concussed collegiate athletes. Neurosurgery. 2007;61(2):345–51.doi:10.1227/01.NEU.0000279972.95060.CB.
- Brett BL, Kramer MD, McCrea MA, Broglio SP, McAllister TW, Nelson LD, Hazzard JB, Kelly LA, Ortega J, Port N, et al. Bifactor Model of the Sport Concussion Assessment Tool Symptom Checklist: replication and Invariance Across Time in the CARE Consortium Sample. Am J Sports Med. 2020;48(11):2783–95.doi:10.1177/0363546520946056.
- Hurtubise JM, Hughes CE, Sergio LE, Macpherson AK . Comparison of baseline and postconcussion SCAT3 scores and symptoms in varsity athletes: an investigation into differences by sex and history of concussion. BMJ Open Sport Exerc Med 2018;4:e000312 doi:10.1136/bmjsem-2017-000312.
- Herrmann N, Rapoport MJ, Rajaram RD, Chan F, Kiss A, Ma AK, Feinstein A, M C Cullagh S, Lanctôt KL . Factor Analysis of the Rivermead Post-Concussion Symptoms Questionnaire in Mild-to-Moderate Traumatic Brain Injury Patients. J Neuropsychiatry Clin Neurosci. 2009;21(2):181–88.doi:10.1176/jnp.2009.21.2.181.
- McCrory P, Johnston K, Meeuwisse W, Aubry M, Cantu R, Dvorak J, Graf-Baumann T, Kelly J, Lovell M, Schamasch P.Summary and agreement statement of the 2nd International Conference on Concussion in Sport, Prague 2004. British Journal of Sports Medicine Prague, 2005. 39(Supplement 1): p.i78–i86.
- SCAT3. British Journal of Sports Medicine. 2013;47(5):259.
- Asken BM, Houck ZM, Bauer RM, Clugston JR . SCAT5 vs. SCAT3 Symptom Reporting Differences and Convergent Validity in Collegiate Athletes. Archives of Clin Neuropsychology. 2019;35(3):291–301.doi:10.1093/arclin/acz007.
- Rosenthal R. Rubin DB.Further issues in effect size estimation for one-sample multiple-choice-typedata. 1991.
- Karadimitriou SM, Marshall E, Knox C. Mann-Whitney U Test. Sheffield: Sheffield Hallam University; 2018.
- Osbourne JW. . In: Best practices in quantitative methods. (SAGE Publications, Inc.). 2008. p. 21.
- Henson RK.Use of Exploratory Factor Analysis in Published Research Common Errors and Some Comment on Improved Practice. Sage Publications, 2006. 66 Number 3: p. 24.
- McCrea M, Guskiewicz KM, Marshall SW, Barr W, Randolph C, Cantu RC, Onate JA, Yang J, Kelly JP . Acute Effects and Recovery Time Following Concussion in Collegiate Football Players. JAMA. 2003;290(19):2556.doi:10.1001/jama.290.19.2556.
- Alla S, Sullivan SJ, McCrory P, Schneiders AG, Handcock P . Does exercise evoke neurological symptoms in healthy subjects? J Sci Med in sport/Sports Medi Australia. 2009;13(1):24–26.doi:10.1016/j.jsams.2008.12.629.
- Gorman M, Hecht S, Samborski A, Lunos S, Elias S, Stovitz SD . SCAT3 assessment of non-head injured and head injured athletes competing in a large international youth soccer tournament. Appl Neuropsychol Child. 2017;6(4):364–68.doi:10.1080/21622965.2016.1210011.
- Collins SM, Lininger MR, Bowman TG. The Effect Of Mild Exercise Induced Dehydration On Sport Concussion Assessment Tool 3 (SCAT3) Scores: a within-subjects design. Int J Sports Phys Ther. 2021;16(2): 511–517. doi:10.26603/001c.21534.
- Chin EY, Nelson LD, Barr WB, McCrory P, McCrea MA . Reliability and Validity of the Sport Concussion Assessment Tool–3 (SCAT3) in High School and Collegiate Athletes. Am J Sports Med. 2016;44(9):2276–85.doi:10.1177/0363546516648141.
- Master CL. In: British Journal of Sports Medicine Blogs. British Journal of Sports Medicine; 2021.
- Merritt VC, Arnett PA.Premorbid predictors of postconcussion symptoms in collegiate athletes. J Clin Exp Neuropsychol. 2014;36(10):1098–111.doi:10.1080/13803395.2014.983463.