
ABSTRACT
Aim
To identify treatment provider sequences and healthcare pathway characteristics and outcomes for people with mild traumatic brain injury (mTBI) in New Zealand.
Methods
Total mTBI costs and key pathway characteristics were analysed using national healthcare data (patient’s injury and services provided). Graph analysis produced sequences of treatment provider types for claims with more than one appointment and healthcare outcomes (costs and time to exit pathway) were compared. Key pathway characteristics’ effect on healthcare outcomes were evaluated.
Results
In two years, 55,494 accepted mTBI claims cost ACC USD$93,647,261 over four years. For claims with more than one appointment (36%), healthcare pathways had a median 49 days (IQR, 12–185). The 89 treatment provider types resulted in 3,396 different provider sequences of which 25% were General Practitioners only (GP), 13% Emergency Department to GP (ED-GP) and 5% GP to Concussion Service (GP-CS). Pathways with shorter time to exit and lower costs had correct mTBI diagnosis at initial appointment. Income maintenance comprised 52% of costs but only occurred for 20% claims.
Conclusions
Improving healthcare pathways for people with mTBI by investing in training of providers to enable correct mTBI diagnosis could yield longer term cost savings. Interventions to reduce income maintenance costs are recommended.
Introduction
Over 50 million traumatic brain injuries occur annually worldwide, with more than 90% of the cases being mild traumatic brain injuries (mTBI) (Citation1). In New Zealand (NZ), 35,000 people sustain an mTBI each year (Citation2), with a total lifetime cost of USD$4,636 per person (Citation3). Although classified as mild in severity, the consequences experienced by people with mTBI can be significant and persist for months or years if inadequate and inefficient treatment is provided (Citation4,Citation5). Whilst approximately half of the people with mTBI recover spontaneously within 7–14 days of injury, the other half require additional support to facilitate recovery (Citation5–9). Unresolved symptoms experienced by some people with mTBI may reduce performance at work or prevent a return to work, with some people never fully returning to work at pre-mTBI levels (Citation10–12).
In mTBI healthcare pathways, a person can first present to a range of healthcare services and professions such as general practitioners (family practitioners), emergency departments (ED), and physiotherapists (Citation13). Given symptoms and impacts of mTBI can vary widely, multiple health professionals may provide follow-up care to support a person’s recovery in response to their individual needs, including allied health professionals (health professionals who are not part of the medical, dental, or nursing professions) (Citation3). Some countries (e.g., NZ, Australia, United Kingdom, United States of America, Canada) have established multidisciplinary concussion clinics (rehabilitation services) and sport-specific concussion clinics to meet the multifaceted needs of people with mTBI (Citation14–17). The sequence of health professionals seen by a person with mTBI in their healthcare pathway form an mTBI treatment provider sequence. Primarily, the treatment provider sequences a patient experiences depends on the patient and the injury need. For example, a patient with a cervicogenic predominant symptom cluster may be referred to an osteopath, while a patient who is showing signs of a more severe injury may be referred to a radiologist. Likewise, patients with multiple symptom clusters affected may be referred to a multidisciplinary concussion clinic. Secondary factors that affect the treatment provider sequence may include residential location (urban vs rural) and hence provider accessibility, physician collaborating networks (practitioner preference), patient provider preference, and practitioner mTBI treatment knowledge and confidence. It was unknown how many treatment provider sequences existed following mTBI, which were the most common, and how sequences compared in healthcare pathway outcomes such as cost and time to pathway exit. mTBI healthcare pathway characteristics and outcomes information are critical to understand how people move through the healthcare system to enable the exploration of possible inefficiencies.
Globally, follow-up care after initial mTBI appointment is uncommon, despite suggestions that continued care is required (Citation1). Only 36% of the patients received follow-up care in a national NZ study of 55,000 people with mTBI (Citation13). Follow-up proportions for people with mTBI have been reported as low as 13.2% in countries across Europe and in the US (Citation18–20). Additionally, early access to care, correct diagnosis, and early follow-up have been linked to improved self-perceived mTBI recovery (Citation6,Citation21–24). However, little research has explored potential cost implications of providing early access to healthcare and effectiveness of initial diagnosis.
In NZ, treatment costs following mTBI are covered by the Accident Compensation Corporation (ACC), a tax-payer funded, no-fault national injury insurance scheme. Compensated services include approved medical treatment, income replacement, social and vocational rehabilitation, and ancillary services (equipment, transportation, and accommodation) as part of the person’s healthcare pathway (Citation25). Other countries have different health care systems and funders. However, a key question for all mTBI providers is ‘how can we provide best value care?’ The NZ system provides a context to explore characteristics of pathways of relevance to other countries without additional complicating factors such as litigation and cause of injury influencing ACC data. ACC’s database stores demographics, injury details, treatment providers, and services given (including costs), which enable national level mTBI healthcare pathway analysis.
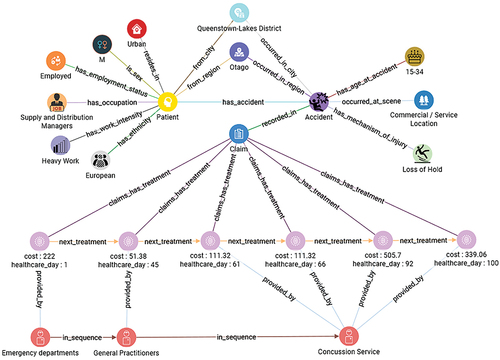
Analytically, a treatment provider sequence is produced by connecting providers (entities) through multiple referrals (relationships; hops). This type of analytical problem (path identification) is difficult to analyse using traditional relational databases because they require multi-table joins that become computationally expensive. Queries that require more than a few hops between entities can even become impossible to compute. Additionally, the tabular format of relational databases limits the visualization of paths and complex relationships found in healthcare data. In contrast, graph databases are built to model and analyse relationships within the data (Citation26). Data are stored, visualized, and analysed as a network of nodes (entities), connected by edges (relationships) (). This reflects the real-world connected nature of data, making it easy to understand and results in superior computational performance for tasks that involve multi-table joins, pattern matching, and path identification (Citation27). Therefore, a graph database of ACC data was created and used to identify treatment provider sequences for people with mTBI and key characteristics and outcomes of their healthcare pathways were compared.
Figure 1. Example of a treatment provider sequence and related data for a person with a mTBI claim, stored and visualized in a graph database (TigerGraph).
Methods
Ethical approval
This project was approved by the ACC Ethics Committee (#426) and the Auckland University of Technology Ethics Committee (AUTEC #20/21). As the study utilized routinely collected, de-identified data for purposes of service improvement, no patient consent was obtained.
ACC data
In NZ, a mTBI can only be diagnosed by a medical professional. The diagnosis is based on the clinical decision of the medic, which may include a variety of diagnostic tests and considers the Glasgow Coma Scale (mTBI = 13–15) and Post-Traumatic Amnesia for TBI severity. Once the diagnosis is made, an ACC claim is created and injury diagnostic codes (readcodes or ICD 10 codes) are applied during the appointment by the medical professional or after the appointment by clinic administrative staff based on the diagnosis of the doctor. The claim is then submitted to ACC for processing. Given the claim is accepted, providers invoice ACC for compensated continued care of the patient. Information relating to this process is captured in ACC’s database. ACC data stored in three datasets (claims; payments; purchase orders) include patient demographics, their injury (mechanism of injury, injury location, and diagnoses), services provided (including cost), service providers, referrals made, and key ACC claim and referral processing dates. ACC does not collect or store injury severity and clinical outcome variables and are therefore not included in this study. Cross-Industry Process for Data Mining (CRISP-DM) methodology (Citation28) was applied to ACC data to understand and prepare data for reliable healthcare pathway analyses (Citation13).
Part 1:Total cost of mTBI claims and key population and pathway characteristics
Inclusion criterion
mTBI diagnostic codes (ICD10 codes and readcodes) were used for the operational definition of mTBI. Accepted ACC claims of all ages that had at least one mTBI diagnostic code, with a NZ residential or occupational address, occurring between September 1st 2016 and September 1st 2018, were included. Corresponding payment and purchase order data for claims were extracted until September 1st 2020 (Citation13). Claims were excluded if a moderate or severe TBI code was also listed. The eligible dataset for the total cost of mTBI claims and key population and pathway characteristics contained 55,494 unique claims ().
Figure 2. Flow chart of eligible claims, number of claims excluded by exclusion criteria, and number of claims used for pathway analysis (All Pathways). A sub-analysis was performed on claims with more than 90 days from injury to pathway exit (>90 Days Pathways).
Data preparation and analyzes
Key population characteristics from the claims dataset were analysed including sex, age, mechanism of injury, ethnicity, and employment status. The pathway characteristics of interest (number of appointments, time to access care, and number of missed diagnoses) were calculated for all 55,494 claims using the claims and payments dataset. If the medical provider missed the mTBI diagnosis at the initial appointment, the claim would not have a mTBI diagnostic code prior to being registered by ACC. Therefore, an incorrect diagnosis at initial appointment was identified when an mTBI code was added to a claim after the claim registration date. The number of first appointments, where the claim only contained one appointment, was calculated per provider type to understand which provider types are most likely to see patients without continued care (only 1 appointment). To reflect the real-world clinical scenario, this study contains people with mTBI that have comorbid injuries (the claim contained additional diagnostic codes not in the mTBI operational definition used). To contextualize the results, the number of claims with comorbid injuries was calculated. Comorbid injury severity ranged from contusions to fractures. Lastly, time from injury to pathway exit (days from injury date to the last service date) was calculated for all claims.
Claim costs were calculated based on amounts charged to ACC per service. Specific costs per appointment were not available for services provided by Emergency Departments because ACC is bulk billed by governing District Health Boards for these services. However, to enable costs of these services to be included, the median cost of available Emergency Department services at USD$155 (NZD$222) was used. Services were labeled with a service type (treatment, treatment administration, treatment provider travel, patient travel, income maintenance, lump sum, and other) based on service item descriptions. Total cost and total service type costs for the 55,494 claims were calculated. The 2016 NZD to USD average exchange rate of 0.6972 was used for cost comparisons with literature.
Part 2:Treatment provider sequences and healthcare outcome comparisons
Inclusion criterion
For healthcare pathway outcome analyses, claims were excluded if there was only one appointment (63% of all claims) (). Current mTBI recovery timeframes show that 50% of people recover within 1 to 2 weeks of the injury (Citation5–9). Therefore, due to recovery, it is likely that a proportion of claims only had one appointment because there was no need for continued care. However, 50% of the people also take more than 2 weeks to recover, and low mTBI follow-up rates after initial medical presentation are reported worldwide (Citation18–20). For example, 48% of the patients in the TRACK-TBI study did not have a follow-up after the initial emergency department visit, despite having concussion symptoms at 3 months post injury (Citation19). The authors of the study discussed the lack of care coordination and poor clinician knowledge of mTBI as possible culprits for low follow-up rates. In NZ, the lack of care coordination is apparent (Citation29) and primary care clinicians have low confidence in the management of mTBI (Citation30). Therefore, while claims with only one appointment may result from good mTBI care and full recovery, it is also possible that a proportion of the claims in this study only had one appointment because of a lack of follow-up by treatment providers, despite incomplete recovery. Hence, with no clinical outcome data that could have provided pathway exit motive, claims with only one appointment were excluded from pathway analyses due to a large uncertainty of recovery at pathway exit. Claims were excluded if pathway exit was unknown (less than 90 days between last service received and study period end) to ensure that complete pathways were captured. Claims were excluded if a person with mTBI received a lump sum (compensation for serious permanent impairments), which indicated the claims contained a very severe comorbid disabling injury that would have skewed pathway outcomes. Lump sum payments would not be made in cases of mTBI recovery observed over many years. The eligible dataset for healthcare pathway analyzes contained 19,786 unique claims (36% of all claims) ().
Graph analyses
Graph design using TigerGraph (version 3.1.6) produced graphs to represent ACC data and patient journeys from claim, payment, and purchase order files. Graphs were queried using Graph Structured Query Language (GSQL) to find provider sequences of each claim. If a person with mTBI received a treatment from a provider more than once, only the first provider occurrence was kept. Analyses were conducted for all claims (All Pathways) and a sub-cohort of claims taking over 90 days to pathway exit (>90 Day Pathways) () to capture people with prolonged persisting concussion symptoms. Outputs were saved as csv files for statistical analyses.
Statistical analyses
Healthcare pathway outcomes used to compare provider sequences for All Pathways and > 90 Days Pathways were the total cost of claim (sum of all service item costs to ACC on a claim) and days from injury to pathway exit (days from injury date to the last service date). To understand and contextualize pathway outcome results, six pathway characteristics were derived and analysed for each provider sequence: percentage of claims requiring return-to-work (RTW) services (income maintenance, vocational services, or occupational services); percentage of claims with comorbid injuries; number of appointments (days where a treatment service was delivered); appointment density (appointment numbers divided by days to pathway exit); cost per number of appointments (total claim cost divided by appointment numbers); and days to last provider (days from injury date to date of first treatment with last provider).
Statistical analyses were conducted in Python (version 3.9.2). Characteristics and outcomes for ten most common provider sequences of All Pathways and > 90 Day Pathways were plotted on box plots to illustrate data distributions. Data were non-normally distributed and provider sequences had different data distributions. Therefore, Glass rank biserial correlation, a non-parametric effect size (ES) measure, was used to show the magnitude of differences in outcomes between provider sequences for All Pathways and >90 Day Pathways (Citation31,Citation32). Small, medium, and large effect sizes were interpreted as 0.1–0.29, 0.3–0.49, and 0.5–1.0, respectively, in both positive and negative directions (Citation33). Heat maps were created to illustrate effect size results. When the data in the treatment provider sequence of the x-axis is greater than in the y-axis, the coefficient is positive. When the data in the treatment provider sequence of the y-axis is greater than in the x-axis, the coefficient is negative. Medians are presented for comprehension, and means are reported for comparison with literature.
Part 3:Effect of key pathway characteristics on healthcare outcomes
Data preparation and statistical analyzes
The All Pathway cohort () was used to evaluate the impact of correct diagnosis at initial appointment, early access to care, and early continued care on time to exit pathway, and total claim cost. Glass rank biserial correlation was again used as a non-parametric effect size measure to show the magnitude of differences in key pathway characteristics between dichotomous groups of each category: claims with correct mTBI diagnosis vs incorrect diagnosis at initial appointment (TBI code added to claim on vs after date of first appointment); first medical appointment within vs more than three days of injury; and second medical appointment within vs more than ten days of injury.
While literature has stated that ‘early’ access to care is important, no studies have provided a timeframe (Citation14,Citation34). However, it has been shown that each additional day to first appointment increases the average recovery time by 2% (Citation6). For subsequent care, a follow-up appointment within one to two weeks of the injury has been recommended to assess concussion symptom improvement (Citation35). Therefore, based on clinical and healthcare pathway pragmatics, a first medical appointment within three days of injury (70th percentile) and second appointment within ten days of injury (57th percentile) were used as cutoffs. Access to medical care within three days of an mTBI allows clinicians to assess whether the person requires hospital evaluation promptly and mitigates the effect of subsequent delays in healthcare pathways (e.g. provider availability or referral processing delays) that prevent early access to specialty care. Similarly, access to a second appointment within ten days of injury allows providers to assess whether the person requires specialty care and initiate an early referral, enabling specialty care to be provided in a timely manner (two to three weeks from initial injury).
Results
Part 1: Total cost of mTBI claims and key population and pathway characteristics
Descriptive analysis of the dataset has been reported (Citation13). Of all 55,494 mTBI claims, males had 59% of claims, 41% were for people aged 15–34, 49% were fall-related accidents, 65% were of European ethnicity, and 17% were NZ Indigenous population (Māori), with 39% employed or self-employed pre-injury. Of all people with mTBI, 64% (35,085) received only one appointment, 94% (51,112) had correct diagnosis at initial medical presentation, and 88% (48,862) took within one week to access care after an mTBI. The two provider types that had the highest number and percentage of initial appointments that did not result in continued care were GPs (61%) and EDs (67%). Of all claims, 30,066 claims (54%) had a comorbid injury. The median time from injury to pathway exit for all 55,494 claims was 4 days (mean, 55; IQR, 1–25) and 49 days (mean, 142; IQR, 12–185) for claims with more than one appointment.
The 55,494 accepted claims for people with mTBI occurring between September 2016 and September 2018 cost ACC NZD$134,319,078 (USD$ 93647,261) over four years (September 2016 to September 2020). The median NZD$222 (USD$155) and average NZD$2,421 (USD$1,688) total cost per claim had an IQR of NZD$70–$273. The median total cost per claim without a comorbid injury was NZD$151 (USD$105; IQR, NZD$56-$222), and the median total cost per claim with a comorbid injury was NZD$222 (USD$155; IQR, NZD$95-$473). Income maintenance contributed 52% of the total cost (NZD$68,255,662, USD$47,587,848) followed by treatments (38%, NZD$50,766,952, USD$35,394,719), treatment provider travel (3%, NZD$4,394,212, USD$3,063,645), treatment administration (3%, NZD$4,328,638, USD$3,017,926), patient travel (2%, NZD$2,644,010, USD$1,843,404), other (2%, NZD$3,545,382, USD$2,471,840), and lump sum (<1%, NZD$384,222, USD$267,880).
Part 2:Treatment provider sequences and healthcare outcome comparisons
Return-to-work services and types of treatment providers and provider sequences in healthcare pathways
Of 19,786 claims in All Pathways (36% of all claims), 3,927 (20%) claims received return-to-work (RTW) services, and of these, 2,203 claims (56%) received income maintenance but did not receive occupational or vocational services. The 3,891 (20%) claims that included income maintenance had a mean and median time of 100 (SD, 147) and 49 (IQR, 13–124) days on income maintenance, respectively.
There were 89 different treatment providers that resulted in 3,334 unique provider sequences, with 25% being General Practitioners only (GP), 13% ED-GP (Emergency Department to GPs), and 5% GP-CS (GPs to Concussion Service). More people with GP-CS (21%) and ED-GP-CS (34%) sequences required return-to-work (RTW) services with less than 10% of people requiring RTW services in all other provider sequences ().
Table 1. Top ten treatment provider sequences for all claims (All Pathways) and claims with more than 90 days from injury to pathway exit (>90 Days Pathways). Number of claims, number and percentage of claims who received return to work (RTW) services and who had a comorbid injury on the claim, means and medians for pathway outcomes (total claim cost, days from injury to pathway exit), and medians for pathway characteristics including number of appointments, appointment density (number of appointments/days to pathway exit), cost per number of appointments, and days to last provider.
Of All Pathway claims, 36% (7,086) were >90 Days Pathways. In this sub-cohort, there were 2,973 unique provider sequences (8% GP-CS, 7% GP-only and 3% ED-GP) and one-third of the claims (2,586) received RTW services. Provider sequences with the highest percentage of people who required RTW services contained CS ().
Cost of healthcare pathways by provider sequence
The GP provider sequence was the least costly sequence in both All Pathways and >90 Days Pathways, with a median total claim cost of NZD$133 and NZD$134 (both USD$93), respectively (, ). In All Pathways, the difference in the total cost between the GP provider sequence and all other pathways was large, except for GP to Osteopath (ES = −0.23), GP to Physiotherapist (−0.37), and GP to Radiologist (−0.42). In >90 Days Pathways, the GP provider sequence exhibited larger total cost differences to other provider sequences than in All Pathways. In >90 Days Pathways, the GP to Chiropractor (median, NZD$263; ES = −0.46) and GP to Osteopath (median, NZD$246; ES = −0.45) were more expensive with a medium difference, while a large difference existed for all other provider sequences with the GP provider sequence (). The GP provider sequence had the second lowest number of appointments in both All Pathways (median, 2) and >90 Days Pathways (median, 3), and the third and fourth cheapest cost per appointment in All Pathways (median, NZD$51, USD$36) and >90 Days pathways (median, NZD$46, USD$32) ().
Figure 3. Heat map showing the Glass rank-biserial correlation coefficient as a measure of effect size between the top 10 treatment provider sequences in All Pathways (all claims) and in > 90 Days Pathways (for claims with more than 90 days from injury to pathway exit) for total cost of claim and days from injury to pathway exit.
Time to exit pathway by provider sequence
Provider sequences with CS had the longest days from injury to pathway exit (GP-CS, 106 days; ED-GP-CS, 108 days; ED-CS; 76 days). The largest difference was between ED-GP-CS and ED-GP (ES = −0.84), with ED-GP having the shortest days to pathway exit (10 days) (, ). Provider sequences with CS had the longest time from injury to last provider and therefore the lowest appointment densities (). Conversely, days to last provider and appointment densities for >90 Days Pathways provider sequences with CS were similar to all other provider sequences. Provider sequences with CS exhibited fewer days from injury to pathway exit compared to all other provider sequences, with the ED-GP-CS sequence having the lowest median (147) days to pathway exit (). Effect sizes for this comparison were small to medium, with medium effect sizes observed for ED-GP and GP provider sequences ().
Part 3:Effect of pathway characteristics on healthcare pathway outcomes
Early access to care (first appointment within three days of injury) was cheaper (median, NZD$388) and resulted in shorter pathways (median, 35 days) compared to access to care after three days of injury (median, NZD$627; median, 99 days). However, these differences were negligible (ES = 0.04) to small (ES = −0.28) (). A second appointment within ten days of injury was also preferable in total cost (median, NZD$377) and days to pathway exit (median, 24 days) compared to a second appointment over ten days of injury (median, NZD$507; median, 93 days). The difference in total cost was negligible (ES = −0.04), but the difference in days from injury to pathway exit was medium (ES = −0.38) (). Lastly, claims with a correct diagnosis at initial appointment were also cheaper (median, NZD$354) and resulted in shorter pathways (median, 39 days) compared to claims with late diagnosis (median, NZD$3,295; median, 195). These differences were large for total cost (ES = −0.50) and medium for days from injury to pathway exit (ES = −0.38) (). (). Of All Pathways, 46% (9,040) of claims exhibited early access to care and correct diagnosis characteristics.
Table 2. Evaluation of early access to care (first appointment within three days), correct diagnosis at initial appointment, and second appointment within ten days of injury versus their counterparts on pathway outcomes (total claim cost and days from injury to pathway exit).
Box plots illustrating data distributions and full descriptive statistics of the total claim cost, days to pathway exit, number of appointments, appointment density, days to last provider, and cost per appointment by provider sequences for All Pathways and > 90 Days Pathways are reported in supplementary figures and tables.
Discussion
New Zealand’s tax-payer funded injury insurance scheme (ACC) means that ACC data analyses enable a full picture of mTBI healthcare pathways, which is not possible in other countries due to their accident and health fundings structures. New Zealand’s mTBI findings reported in this study serve as a lens into mTBI patients’ journeys and, therefore, potential care applications around the world. The most common healthcare pathway entry points were GPs and EDs. This analysis provided evidence that improving the efficiency of healthcare pathways (including correct mTBI diagnosis at initial appointment, access to care within three days of injury, and a follow-up appointment within ten days of injury) may reduce financial costs and time to exit pathway following an mTBI. Income maintenance was identified as the greatest contributor to total mTBI costs; therefore, interventions to reduce this cost are recommended.
Types of treatment providers and provider sequences in mTBI healthcare pathways
For claims with more than one appointment, the three most common provider sequences were GP only, then ED-GP and GP-CS. Nine of the 10 most common provider sequences started with GP or ED. This finding highlighted where efficiencies in provider diagnosis and referral for follow-up should primarily be targeted. The wide range of professions and services included within mTBI healthcare pathways indicate that it is unlikely that one single provider sequence for all people with mTBI is most efficient. A key challenge in making comparisons between provider sequences is that some people likely had higher symptom burdens and injury impacts than others. For example, those who present to the GP may have less severe symptoms than those who present to the ED or who are referred to concussion services. The low cost and short time to pathway exit of provider sequences with GP only or GP to an allied health professional indicate that these may be the most appropriate provider sequences for people with less severe impact of an mTBI.
mTBI management guidelines recommend multidisciplinary concussion clinics as the preferred management for complex mTBIs, persistent concussion symptoms, and people who require additional support (Citation14,Citation34). This was highlighted in CS provider sequences and in the >90 Days Pathways cohort, where a higher proportion of claims required RTW services, indicative of higher impact of injury on daily functioning. Therefore, people with mTBI who required multidisciplinary care from concussion services and vocational rehabilitation had higher costs (also influenced by their high cost per appointment) but are likely relative to the person’s need and must be interpreted cautiously. In >90 Days Pathways, there were a higher proportion of provider sequences with CS. These provider sequences had the highest number of appointments per days in pathways (appointment density) and shortest days to exit pathways. Therefore, this study has indicated that people with mTBI who required long-term care may have been better supported by provider sequences with CS. Whilst GP pathways were cheapest, this does not necessarily mean that GP pathways are most clinically effective for every person with an mTBI. Noteworthy, 44% of All Pathways claims had ‘other’ treatment provider sequences, a proportion which was far higher (72%) for >90 Days Pathways. This finding indicates that people that took longer to recover were more likely to have received inconsistent and more fragmented care, suggesting the importance of structured pathways of care for people with mTBI.
To reduce time to access care, the sports concussion service treatment provider reported in this study was established as a self-referral service. Interestingly, a GP was still the most common initial treatment provider for provider sequences containing a sports concussion service. This finding is likely because the public is accustomed to a GP or an ED being their first point of contact with the healthcare system. It is therefore important to consider historical and current healthcare system processes when designing interventions to improve mTBI healthcare pathways, such as implementing new services or changing mTBI healthcare policies.
Cost of mTBI claims
The high total cost of all 55,494 mTBI claims highlighted that impacts of mild TBI were considerable. The average NZD$2,421 (USD$1,688) cost per claim in our NZ study was less than the USD$4,123 total first year costs per person reported in an earlier study of population-based study of first year and lifetime costs of TBI in NZ (Citation3). The difference in costs per claim likely reflect that our analysis did not include personal costs to people with mTBI such as supplementing treatment costs or loss of income (ACC provides a maximum of 80% of pre-injury income).
Only a third of people with mTBI were eligible for RTW services (i.e., were employed or self-employed prior to the injury), yet income maintenance formed half of the total costs. As a result, low costs of GP-only, GP to Osteopaths, and GP to Physiotherapists pathways were influenced by the small proportion of claims that received RTW services, the low number of appointments, and cheapest cost per appointment of these pathways. Half of those who received income maintenance did not receive occupational or vocational services. However, the average duration of time a person received income maintenance for was substantial (100 days). Therefore, providing occupational and vocational services early to people with mTBI to facilitate RTW will likely reduce the total costs of mTBI claims in the longer term.
A large variation in total cost existed for claims with comorbid injuries, which likely reflects the range in severity of comorbidity. However, comorbid injuries did not appear to affect differences in the total cost of claims and days from injury to pathway exit observed between treatment provider sequences.
Key pathway characteristics for improved outcomes
Previous research has shown that early access to care, correct diagnosis, and early follow-up were linked to reduced symptom burden and quicker recovery (Citation21–24). Our study has augmented previous evidence by showing that correct TBI diagnosis at initial appointment may result in shorter times to exit pathway and cheaper total mTBI rehabilitation cost, and a second appointment within ten days of injury may result in shorter times to exit pathway. These trends were also apparent for access to care within three days of injury, but with smaller magnitude. However, our analysis revealed that thousands of people each year did not experience mTBI treatment pathways with these characteristics. Therefore, interventions designed to increase public awareness of benefits of early mTBI care and increased accessibility of services may improve early access to care.
It is recommended that training of treatment providers who are the first point of contact for people following mTBI is provided, so they know how to diagnose and refer people for medical review and care. Tools designed to make referral processes easier such as the Brain Injury Screening Tool (BIST), (Citation36) which has been trialed successfully in NZ, may facilitate suitability of referral to different mTBI pathways based on the person’s need while healthcare system integration can improve the efficiency of care, consequently improving mTBI recovery and reducing health care costs.
Another consideration is that delays in processing claims for those accessing CS may have contributed to the long time taken to receive care from specialist concussion services. At the time, data were collected in NZ; all referrals to a concussion service required pre-approval from ACC before treatment could be provided. The median referral processing and approval time by ACC was one month, delaying access to care (Citation13). Evaluation of, and interventions to reduce time to concussion clinics and specialty care, are needed to improve outcomes for people with mTBI.
Delimitations
ACC’s treatment provider data collection and storage procedure meant that GPs providing initial care at an Accident and Medical clinic (urgent care clinic) were not distinguishable from initial GP care at a family medical clinic. Therefore, Accident and Medical clinics were not captured as a treatment provider in this study. The differences in the patient-provider relationship and scope of practice of a GP in these two contexts may have impacted the likelihood of follow-up care in GP treatment provider sequences and resulted in different healthcare pathway outcomes. Diagnostic codes were used as the operational definition of mTBI, based on the clinical decision of a medical practitioner. However, it is acknowledged that errors in diagnostic codes may exist and clinical assessments of mTBI between medical practitioners varied. The lack of mTBI impact and symptom burden indicators on initial presentation meant that initial severity could not be considered. Given that initial symptom burden and severity of impact have been associated with longer recoveries (Citation7,Citation37,Citation38), initial mTBI severity could contribute to the GP provider sequence having the cheapest and shortest pathways. Lack of outcome data for people with mTBI prevented conclusive recommendations of the most cost and clinically efficient provider sequences. Similarly, lack of outcome data prevented the inclusion of all 55,494 claims for healthcare pathway analyses due to unknown recovery after only one appointment. ACC does not collect or store patient outcome data such as number and severity of symptoms, daily functioning measures, self-reported recovery, or clinical discharge due to recovery. Therefore, as a replacement for time to recovery, time to pathway exit (cessation of services) was used. However, while time to pathway exit represented time without full recovery, it cannot affirmatively represent time to recovery. People may have left pathways because they recovered from mTBI. However, pathway exit may also have occurred because people who decided to stop seeking care, were not advised to continue seeking care when required, sought care privately, or because cover for services was terminated by ACC. These alternatives may have occurred even though recovery may not have been achieved or people did not receive referral for follow-up care after their initial assessment. While total cost of claims and times to pathway exit provided insight into current provider sequences and their pathways characteristics, they did not enable conclusive recommendations for the best provider sequence for care for people with mTBI. There is a need to integrate indicators of injury impact and symptom burden on first medical presentation and self-reported recovery or clinical discharge due to recovery within routine data collection to assist healthcare providers in further identifying improvements to mTBI healthcare pathways.
Conclusions
From a national analysis of mTBI healthcare pathways, these results indicated that early and correct diagnosis and early follow-up are key characteristics of healthcare pathways with lower time to exit pathway. Early and correct diagnosis also appeared key to lower costs per mTBI. Nine of the top ten frequent provider sequences started with a GP or ED. Therefore, GP and ED training to ensure their ability to identify mTBI and provide appropriate healthcare pathway referral is essential. Interventions to reduce income maintenance costs are recommended to reduce total mTBI costs. Initial mTBI severity measures and ongoing mTBI outcome measures need to be collected and made accessible to further identify improvements to mTBI healthcare pathways.
Key definitions
Mild traumatic brain injury (mTBI) healthcare pathways: The patient journey through the healthcare system during mTBI assessment, treatment, and recovery.
Treatment provider sequence: The sequence of health professionals seen by a person with mTBI in their healthcare pathway.
Supplemental Material
Download Zip (2.4 MB)Acknowledgments
The authors would like to thank Dr. Stephen Kara for his clinical expertise and feedback provided for this paper. Alice Theadom (AT) is supported by a Rutherford Discovery Fellowship administered by The Royal Society Te Apārangi.
Disclosure statement
Renata Bastos Gottgtroy (RBG), Patria Hume (PH) and Alice Theadom (AT) declare that they have no conflicts of interest relevant to the content of this article.
Supplementary material
Supplemental data for this article can be accessed online at https://doi.org/10.1080/02699052.2023.2230878
Data availability statement
Due to restrictions on use of data stated in the data sharing agreement with ACC, the research team are not able to share data used for these analyzes. However, datasets generated and analyzed during the current study may be requested via ACC.
Additional information
Funding
References
- Maas AIR, Menon DK, Manley GT, Abrams M, Åkerlund C, Andelic N, Aries M, Bashford T, Bell MJ, Bodien YG, et al. Traumatic brain injury: progress and challenges in prevention, clinical care, and research. Lancet Neurol. [Internet]. 2022;21(11):1004–60. doi:10.1016/S1474-4422(22)00309-X.
- Feigin VL, Theadom A, Barker-Collo S, Starkey NJ, McPherson K, Kahan M, Dowell A, Brown P, Parag V, Kydd R, et al. Incidence of traumatic brain injury in New Zealand: a population-based study. Lancet Neurol. [Internet]. 2013;12(1):53–64. doi:10.1016/S1474-4422(12)70262-4. Cited in; PMID: 23177532.
- Te Ao B, Brown P, Tobias M, Ameratunga S, Barker-Collo S, Theadom A, McPherson K, Starkey N, Dowell A, Jones K, et al. Cost of traumatic brain injury in New Zealand: evidence from a population-based study. Neurol. [Internet]. 2014;83(18):1645–52. doi:10.1212/WNL.0000000000000933. Cited in; PMID: 25261503.
- Theadom A, Starkey N, Barker-Collo S, Jones K, Ameratunga S, Feigin V, Sharma P. Population-based cohort study of the impacts of mild traumatic brain injury in adults four years post-injury. Plos One. 2018;13(1):e0191655. doi: 10.1371/journal.pone.0191655. Cited in; PMID: 29385179.
- Theadom A, Parag V, Dowell T, McPherson K, Starkey N, Barker-Collo S, Jones K, Ameratunga S, Feigin VL. Persistent problems 1 year after mild traumatic brain injury: a longitudinal population study in New Zealand. Br J Gen Pract. [Internet]. 2016;66(642):e16–e23. doi: 10.3399/bjgp16X683161.
- Kara S, Crosswell H, Forch K, Cavadino A, McGeown J, Fulcher M. Less than half of patients recover within 2 weeks of injury after a sports-related mild traumatic brain injury: a 2-Year prospective study. Clin J Sport Med. [Internet]. 2020;30(2):96–101. doi: 10.1097/JSM.0000000000000811.
- McGeown JP, Kara S, Fulcher M, Crosswell H, Borotkanics R, Hume PA, Quarrie KL, Theadom A. Predicting sport-related mTBI symptom resolution trajectory using initial clinical assessment findings: a retrospective cohort study. Sports Med. 2020;50(6):1191–202. doi: 10.1007/s40279-019-01240-4.
- Meehan WP, Mannix R, Monuteaux MC, Stein CJ, Bachur RG. Early symptom burden predicts recovery after sport-related concussion. Neurol. [Internet]. 2014;83(24):2204–10. doi: 10.1212/WNL.0000000000001073.
- Collins M, Lovell MR, Iverson GL, Ide T, Maroon J. Examining concussion rates and return to play in high school football players wearing newer helmet technology: a Three-Year prospective cohort study. Neurosurg. [Internet]. 2006;58(2):275–86. doi: 10.1227/01.NEU.0000200441.92742.46.
- Watkin C, Phillips J, Radford K. What is a ‘return to work’ following traumatic brain injury? Analysis of work outcomes 12 months post TBI. Brain Inj. [Internet]. 2020;34(1):68–77. doi:10.1080/02699052.2019.1681512.
- Chu S-Y, Tsai Y-H, Xiao S-H, Huang S-J, Yang C-C. Quality of return to work in patients with mild traumatic brain injury: a prospective investigation of associations among post-concussion symptoms, neuropsychological functions, working status and stability. Brain Inj. [Internet]. 2017;31(12):1674–82. doi:10.1080/02699052.2017.1332783.
- de Koning ME, Scheenen ME, van der Horn HJ, Timmerman ME, Hageman G, Roks G, Spikman JM, van der Naalt J. Prediction of work resumption and sustainability up to 1 year after mild traumatic brain injury. Neurol. [Internet]. 2017;89(18):1908–14. doi: 10.1212/WNL.0000000000004604.
- Bastos Gottgtroy R, Hume P, Theadom A. Healthcare pathways for mild traumatic brain injury patients in New Zealand, determined from accident compensation corporation data. N Z Med J. [Internet]. 2022;135(1563):36–51.
- Ontario Neurotrauma Foundation. Guideline for concussion/mild traumatic brain injury & persistent symptoms [internet]. 2018 [Accessed 2022 Mar 21]. Available from: https://braininjuryguidelines.org/concussion/.
- Find a Clinic — Concussion Legacy Foundation Canada [Internet]. [Accessed 2022 Nov 16]. Available from: https://www.concussionfoundation.ca/find-a-clinic.
- Concussion service providers[Internet]. [Accessed 2022 Nov 16]. Available from: https://www.acc.co.nz/for-providers/treatment-recovery/referring-to-rehabilitation/concussion-service-providers/.
- Concussion Clinics Finder | Concussion Legacy Foundation [Internet]. [Accessed 2022 Nov 16]. Available from: https://concussionfoundation.org/concussion-clinics-finder.
- Foks KA, Cnossen MC, Dippel DWJ, Maas AIR, Menon D, van der Naalt J, Steyerberg EW, Lingsma HF, Polinder S. on behalf of CENTER-TBI investigators and participants. Management of mild traumatic brain injury at the emergency department and hospital admission in Europe: a survey of 71 Neurotrauma centers participating in the Center-TBI Study. J Neurotrauma. [Internet]. 2017;34(17):2529–35. doi: 10.1089/neu.2016.4919.
- Seabury SA, Gaudette É, Goldman DP, Markowitz AJ, Brooks J, McCrea MA, Okonkwo DO, Manley GT, Adeoye O, Badjatia N, et al. Assessment of follow-up care after emergency department presentation for mild traumatic brain injury and concussion: results from the TRACK-TBI study. JAMA Netw Open. 2018;1(1):e180210. doi:10.1001/jamanetworkopen.2018.0210.
- Ramsay S, Dahinten VS, Ranger M, Babul S. Follow-up visits after a concussion in the pediatric population: an integrative review. NRE. [Internet]. 2023;52(3):315–28. doi: 10.3233/NRE-220216.
- Corwin DJ, Arbogast KB, Haber RA, Pettijohn KW, Zonfrillo MR, Grady MF, Master CL. Characteristics and outcomes for delayed diagnosis of concussion in pediatric patients presenting to the emergency department. J Emerg Med. Internet. 2020;59(6): 795–804. 10.1016/j.jemermed.2020.09.017.
- Desai N, Wiebe DJ, Corwin DJ, Lockyer JE, Grady MF, Master CL. Factors affecting recovery trajectories in pediatric female concussion. Clin J Sport Med. [Internet]. 2019;29(5):361–67. doi:10.1097/JSM.0000000000000646. [Internet].
- Reid-Arndt SA, Schopp L, Brenneke L, Johnstone B, Poole AD. Evaluation of the traumatic brain injury early referral programme in Missouri. Brain Inj. [Internet]. 2007;21(12):1295–302. doi:10.1080/02699050701721802.
- Kontos AP, Jorgensen-Wagers K, Trbovich AM, Ernst N, Emami K, Gillie B, French J, Holland C, Elbin RJ, Collins MW. Association of time since injury to the first clinic visit with recovery following concussion. JAMA Neurol. [Internet]. 2020;77(4):435–40. doi: 10.1001/JAMANEUROL.2019.4552. Cited in; PMID: 31904763.
- King D, Hume PA, Hardaker N, Cummins C, Gissane C, Clark T. Sports-related injuries in New Zealand: National insurance (Accident Compensation Corporation) claims for five sporting codes from 2012 to 2016. Br J Sports Med. [Internet]. 2019;53(16):1026–33. doi: 10.1136/bjsports-2017-098533. Cited: in; PMID: 29530942
- Wood PT. Graph Database. In Liu L, Özsu MT editors. Encyclopedia of Database Systems [Internet]. Boston, MA: Springer US; 2009pp. 1263–66. http://link.springer.com/10.1007/978-0-387-39940-9_183
- Cheng Y, Ding P, Wang T, Lu W, Du X. Which category is better: benchmarking relational and graph database management systems. Data Sci Eng. [Internet]. 2019;4():309–22. doi: 10.1007/s41019-019-00110-3.
- Chapman P, Clinton J, Randy K, Thomas K, Thomas R, Colin S, Wirth R CRISP-DM 1.0 step-by-step data mining guide. 2000.
- Accident Compensation Corporation. Traumatic brain injury strategy and action plan (2017-2021) [Internet]. 2017 [Accessed 2019 Nov 3]. Available from: www.acc.co.nz.
- Stuart C, Reid D, Theadom A, Fulcher M, Hardaker N. Knowledge and management of sport-related concussion in primary care in New Zealand. N Z Med J. [Internet]. 2022;135(1548):31–41.
- Glass GV. A ranking variable analogue of biserial correlation: implications for short-cut item analysis National council on measurement in education. J Educ Meas. [Internet]. 1965;2(1):91–95. doi: 10.1111/j.1745-3984.1965.tb00396.x.
- Tomczak M, Tomczak E. The need to report effect size estimates revisited. An overview of some recommended measures of effect size. Trends Sport Sci. 2014;21(1):19–25.
- Cohen J. Statistical power analysis for the behavioral sciences. 2nd ed. Hillsdale, NJ: Lawrence Erlbaum Associates; 1988.
- Silverberg ND, Iaccarino MA, Panenka WJ, Iverson GL, McCulloch KL, Dams-O’Connor K, Reed N, McCrea M, Cogan AM, Park Graf MJ, et al. Management of concussion and mild traumatic brain injury: a synthesis of practice guidelines. Arch Phys Med Rehabil. [Internet]. 2020;101(2):382–93. doi:10.1016/j.apmr.2019.10.179.
- Ontario Neurotrauma Foundation. Post-concussion care pathway | concussions ontario [internet]. [Accessed 2023 Apr 29]. Available from: https://concussionsontario.org/concussion/resources/tools-resources/post-concussion-care-pathway.
- Theadom A, Hardaker N, Bray C, Siegert R, Henshall K, Forch K, Fernando K, King D, Fulcher M, Jewell S, et al. The Brain Injury Screening Tool (BIST): tool development, factor structure and validity. PLoS One. [Internet]. 2021;16(2):e0246512. doi:10.1371/journal.pone.0246512. Cited in: PMID: 33539482.
- Forrest RHJ, Henry JD, McGarry PJ, Marshall RN. Mild traumatic brain injury in New Zealand: factors influencing post-concussion symptom recovery time in a specialised concussion service. J Prim Health Care. 2018;10(2):159–66. doi: 10.1071/HC17071. Cited in; PMID: 30068471
- Lingsma HF, Yue JK, Maas AIR, Steyerberg EW, Manley GT, Cooper SR, Dams-O’Connor K, Gordon WA, Menon DK, Mukherjee P, et al. Outcome prediction after mild and complicated mild traumatic brain injury: external validation of existing models and identification of new predictors using the TRACK-TBI pilot study. J Neurotrauma. [Internet]. 2015;32(2):83–94. doi:10.1089/neu.2014.3384.