
ABSTRACT
This study proposes a protocol for assessing speech motor control in children using maximum performance tasks with simultaneous acoustic and ultrasound recording. The protocol was piloted on eight children with autism spectrum disorders and nine typically developing children. Diadochokinesis rate, accuracy, and consistency were elicited using an imitation paradigm where speakers repeat mono-, bi-, and tri-syllabic stimuli at increasing rates. Both traditional measures of rate, accuracy and consistency and an ultrasound tongue-shape analysis of slow versus fast productions were undertaken. Preliminary results suggest that the protocol is feasible with children with communication disorders. Instrumental measures suggest greater variability in tongue movements in the children with autism that is not detected using perceptual measures of accuracy. A subgroup of children with autism showed some evidence of differences in speech motor control. Ultrasound tongue imaging appears to be a useful method for gaining additional insight into speech motor control.
Introduction
In the speech therapy clinic diagnosis of motor speech disorders usually involves standardised assessments including maximum performance tasks. One type of maximum performance task, diadochokinesis (DDK), has been shown to be particularly useful in identifying motor speech disorders (Thoonen et al., Citation1996). In this task speakers are asked to repeat mono-syllables, bi-syllables and tri-syllables at maximum rate. The stimuli usually consists of plosives at different places of articulation, for example, the mono-syllables: [pə pə pə], [tə tə tə] and [kə kə kə], bi-syllable [tə kə], and tri-syllable[pə tə kə]. Maximum rates increase with age. The rate and accuracy of targets produced are indicative of different subtypes of speech disorders. That is, slower monosyllabic repetition rates have been found to be indicative of dysarthria (Duffy, Citation2000), whereas a normal rate of monosyllabic production, but reduced rate of tri-syllabic production and significant inaccuracy of targets is indicative of CAS (Thoonen et al., Citation1996). Williams and Stackhouse (Citation2000) take the idea that accuracy, as well as rate, might be important further. They suggest that is may be possible to differentiate between sub-groups of children with speech difficulties by looking at both the accuracy of the segments produced, and whether they are produced in a consistent manner. For example, a child with a phonological delay might inaccurately produce/pə tə kə/as [pə tə tə] but do so consistently across multiple repetitions, whereas a child with a motor planning problem might produce a variety of correct and incorrect productions on each repetition, for example, [pətətə pətəkə pəkətə kəkə pətətətə]. Whilst the speech abilities required for DDK tasks differ from normal speech production, they provide information on motor speech and potential impairment in this area (Williams & Stackhouse, Citation2000).
Measuring DDK
DDK rate is easily calculated by audio recording productions and using basic acoustic analysis software to measure the number of syllables produced per second. It can therefore be an objective measure, when performed in this way. Accuracy and consistency measures, on the other hand, require phonetic transcription which is known to be vulnerable to difficulties with inter-rater reliability, especially when SSDs occur (Shriberg & Lof, Citation1991). Moreover, subtle differences in motor control are not easily identified using perceptual analysis. Despite this, instrumental methods for assessing DDK in children are rare. In contrast, instrumental studies of acquired motor speech disorders reveal subtle articulatory differences that are important. For example, Folker et al. (Citation2011), used electromagnetic articulography, to measure tongue kinematics during a DDK task for adults with Friedreich’s ataxia and found subtle articulatory difficulties during the closure phase of the consonant. Such differences cannot be detected with perceptual measures alone. However, this type of articulography involves gluing sensors to the speaker’s tongue, which we suggest might be too invasive for children with communication disorders.
Measuring DDK is also compounded by difficulties and differences in eliciting the stimuli from children. Protocols in published tests typically require clinicians to provide a live model before asking the child to “go as fast as they can”. The model provided by the clinician is not standardised, and given that adult DDK rates are higher than children’s, it may be very difficult for the clinician to model an appropriate rate. Moreover, children, particularly those with communication disorders, might find following verbal instructions such as “go as fast as you can” difficult to understand. In fact, Williams and Stackhouse (Citation2000) say that even typically developing children approach the task in different ways when asked to do this, with some children producing very careful, slow productions and others going very fast at the cost of accuracy. This speed-accuracy trade-off is well known in the literature on both speech and fine motor control, yet DDK tasks typically also do not usually compare accuracy at different rates of production.
McCann and Wrench (Citation2007) suggest a protocol for instrumental analysis of DDK rate and accuracy which circumvents some of these problems. This study used electropalatography to measure DDK in children with Down syndrome. The study used pre-recorded standardised audio prompts which children were asked to imitate, rather than the traditional “repeat after me” or “go as fast as you can” paradigm where prompts are provided live by the clinician. They hypothesised that the imitation paradigm would be easier for children with Down syndrome who have difficulty with complex verbal instructions. They created pre-recorded audio prompts in which the target mono-, bi- or tri-syllable was recorded at different standardised rates using a metronome. Each prompt for imitation is given first at a very slow rate of −3SD from the mean for typically developing children, increasing in SD bands to +2SD. This protocol therefore provides a method of comparing repeated syllables at slow and fast rates using an elicitation method that is easy to control. A recent large study by Diepeveen et al. (Citation2019) also used imitation for some parts of a DDK protocol. Dutch children aged two to seven were first asked to produce mono and then bi- or tri- syllables at their normal speaking rate, then at five syllables per second after an audio prompt and finally “as fast as possible”. Nevertheless, since audio prompts were only provided at one rate this does not allow control over whether children favour speed or accuracy when asked to go at maximum rate (Williams & Stackhouse, Citation2000).
For measuring accuracy most studies use phonetic transcription. However, McCann and Wrench (Citation2007) use an automatic EPG measure of tongue-palate contact for detecting /t/ and /k/ closures. This has the advantage that it can record the kinematics of tongue-palate contact and it easily measures closure during lingual stops such as /t/ and /k/. Adding articulatory measures to DDK is potentially useful as it allows identification of increased sub-phonemic variability, a hallmark of motor speech disorder, and, in the case of EPG, it allows identification of unusual articulations such as double articulations, which again might indicate a motor speech issue. However, the technique is expensive and may be invasive for some children. Therefore, a non-invasive and child-friendly instrument may be needed.
Ultrasound tongue imaging for measuring motor speech differences
Ultrasound tongue imaging (UTI) is cheaper, does not require intra-oral hardware and has fast enough frame rates (typically up to 200 Hz) to measure DDK. It allows direct measurement of tongue-movements using a medical ultrasound probe placed under the chin. It allows visualization of the surface of the tongue in the mid-sagittal view from near the tip to the root. Using ultrasound in clinical phonetics is in its infancy, although it has been used as a biofeedback tool for speech therapy since the 1980s (Sugden et al., Citation2019). A small number of studies have used ultrasound to measure tongue movements in speakers with speech disorders. For example, Heyde et al. (Citation2016) used ultrasound to show that people who stuttered had an increased variation in tongue shapes and decreased mean peak velocity. Ultrasound can also easily measure differences in tongue-shape across multiple repetitions. In an ultrasound study comparing four children who stutter to four who do not, Lenoci and Ricci (Citation2018) found that the children who stutter had a wider range of tongue-shapes for repeated productions, which they suggest indicates articulatory instability. To our knowledge UTI has not previously been used as an articulatory technique to gain insight into articulatory stability during DDK tasks. This study pilots a DDK protocol that uses the imitation paradigm described in McCann & Wrench (Citation2007), but with UTI in place of EPG. We take as our test group children with Autism Spectrum Disorders (ASD).
Speech motor control in children with Autism
ASD is characterised by difficulties with social communication and interaction, but this is compounded by an increased likelihood of speech sound disorders (SSD), though the cause of SSDs in this group is not well understood (Cleland et al., Citation2010). Given that children with ASD also present with general motor difficulties (Esposito & Pasca, Citation2013) and with disordered prosody, a hallmark of Childhood Apraxia of Speech, CAS, (Shriberg et al., Citation2001), the possibility that the SSD in ASD is a type of motor speech disorder has also been investigated. Shriberg et al. (Citation2019) found that 14.3% of verbal children with ASD had Speech Motor Delay (SMD). This diagnosis is given when children show a delay in the development of precise and stable articulation that nevertheless does not meet the full diagnostic criteria for childhood dysarthria or CAS. Furthermore, recent studies of low or minimally verbal children with ASD also show that around a quarter of children show signs of CAS (Chenausky et al., Citation2019). It seems then that there is perhaps a subgroup of children with ASD that present with either significant or subtle motor speech difficulties, albeit not necessarily meeting the full criteria for CAS. Children with autism therefore make a potentially interesting, and challenging group to investigate DDK rates in.
There is an indication that DDK performance in children with ASD may be affected but there is very little research in this area. In an unpublished thesis Deshmukh (Citation2012) found that children with high functioning ASD actually had faster DDK rates than typically developing children. However, they showed significantly reduced accuracy and consistency. These results may indicate presence of speech motor coordination and control difficulties in children with ASD. This is especially interesting when considered in light of a growing body of research which suggests that (general and fine) motor impairment might be a core feature of autism (Trevarthen & Delafield-Butt, Citation2013).
Study aims and predictions
The principle aim of this study was to test the feasibility of using ultrasound to measure articulatory stability during DDK tasks with children with ASD. We compared DDK rate, accuracy, and consistency in children with ASD to typically developing children. We predicted that at least some children with ASD would show normal rate, but reduced accuracy and consistency, in line with the findings of Shriberg et al. (Citation2019) that some children present with motor speech delay. Since, articulatory instability is also a hallmark of both CAS and motor speech delay (Shriberg et al., Citation2019), if children with ASD show evidence of either disorder we would expect this to show as increased variability in tongue-shape when measured with UTI compared to children with typical speech development. Finally, we expect to find differences in both groups between slow and fast productions. When there is time pressure the articulators have less time to move to the correct place of articulation, resulting in undershoot (Lindblom, Citation1963). This undershoot model would predict that there will be a significant difference in tongue shapes at slow and fast rates.
Method
We performed both perceptual and instrumental measures of DDK. In the perceptual measures we compared rate, accuracy, and consistency in DDK of two groups of children matched for age: typically developing (TD) children and children with autism spectrum disorders (ASD). In order to extend our findings we additionally compared these measures to previously published norms by Fletcher (Citation1978) and Williams and Stackhouse (Citation2000). We then used UTI to determine whether either group of children showed evidence of articulatory instability in terms of variability of tongue-shape in repeated productions of perceptually accurate consonants at slow versus maximum rate.
Participants
Children aged 6–13 years were recruited from local schools in the west of Scotland. TD children had no history of speech, language, or cognitive disorders or autism. Children with ASD had a confirmed diagnosis (including Asperger syndrome) made by a multidisciplinary team of health care professionals. To confirm the presence of ASD traits in this group, and exclude it in the TD group, we administered the Social Communication Questionnaire (Rutter et al., Citation2003). All of the children in the control group had scores within the normal range, while all of the children in the ASD group had either a current or life-time score indicative of autism (see ). Children in both groups were excluded if they had no spoken English; evidence of severe or profound hearing loss; a structural abnormality of the vocal tract; or a severe physical disability. Children in both groups were screened for speech disorders using the Diagnostic Evaluation of Articulation and Phonology screening test (Dodd et al., Citation2002), results are presented in table one. In both groups some children made developmental errors such as gliding of /r/, these errors are not further analysed here.
Table 1. Demographic details and assessment scores
Ten children were recruited to the ASD group, but two children completed only a limited number of the DDK tasks and were therefore excluded from the final analysis. The ASD group therefore comprised eight children aged 6;4 to 12;8 (six males) and the TD group comprised nine children aged 6;0 to 12;6 (six males). An independent samples t-test confirmed no significant difference in age, t(16) = 1.582, p = .133 between groups. The children with autism completed a battery of speech, language and cognitive assessments. Scores are given in , but not analysed further here.
Ethical approval
Ethical approval was granted by the West of Scotland REC 3 NHS Ethics Committee. For recruitment of children from local schools, ethical approval was granted by the University Ethics Committee from the University of Strathclyde.
Stimuli
We used the DDK task reported in McCann and Wrench (Citation2007), with the exception that we used UTI in place of EPG (see below). In this task, participants repeat both single syllables and sequences at increasing rates from a pre-recorded prompt. We used the original prompts created for the McCann and Wrench (Citation2007) study. Prompts were recorded in a sound-proofed study by a female native English speaker. A metronome was set to specific rates and the speaker was instructed to produce one syllable per metronome beat. Rates were based on those reported for typically developing children in Robbins and Klee (Citation1987) for single syllables and Williams and Stackhouse (Citation2000) for sequences and are reported in . Prompts were five repetitions of single syllables /pə/, /tə/ and /kə/ and sequences /pə tə kə/ and /tə kə/ at six rates: −3SD, −2SD, −1SD, mean, +1SD, +2SD. Prompts were played free-field directly on the AAA software (Articulate Instruments Ltd, Citation2014) used for recording ultrasound and audio (see below). Children were asked to “listen to the computer saying some sounds and try to copy it, the first sound you are going to say is [pə], can you say that?” All participants started with the slowest rate, if they were able to produce the syllables or sequence accurately then they moved on to the next rate. All of the children imitated all of the prompts at all of the rates, resulting in five prompts at six speeds = a maximum of 30 prompts per child. The DDK task took around 10 mins for each participant.
Table 2. Prompt rates in syllables per second from McCann and Wrench (Citation2007)
Ultrasound and audio recording set up
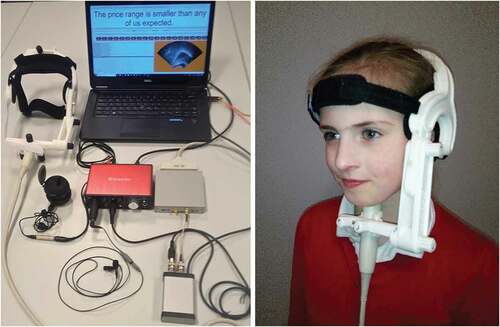
High-speed UTI data were acquired using a Micro machine controlled via a PC running Articulate Assistant Advanced (Articulate Instruments Ltd, Citation2014). The echo return data were recorded at □100 fps over a field of view of 162°. This field of view allowed a view of the tongue which included both the hyoid and mandible shadows. A 5–8 MHz 10 mm radius microconvex ultrasound probe was stabilized with a lightweight plastic headset. An Audio Technica3350 microphone was attached to the headset to record the audio data. shows the ultrasound equipment and headset. All data were collected in a quiet room at the university.
Figure 1. Ultrasound equipment (L) and headset (R). Note: Photograph on left copyright articulate instruments, reproduced with permission. Photograph on right copyright Joanne Cleland, reproduced with permission.
Perceptual and acoustic analysis: rate, accuracy, and consistency
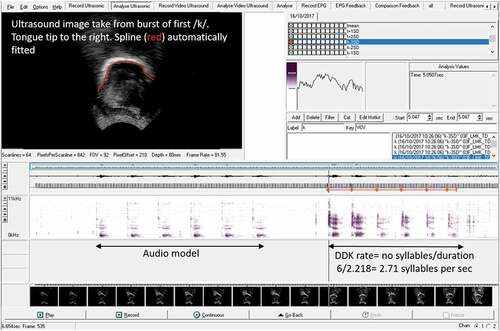
We used the spectrogram and waveform in Articulate Assistant Advanced software to calculate rate in syllables per second for each prompt (see ), from which we report the maximum. For accuracy and consistency we used the method reported in Williams and Stackhouse (Citation2000): an accuracy score of 1 is given when the phonetic transcription of the first syllable or sequence produced by the participants correctly matches the prompt or 0 when it does not. For consistency a score of 1 is given when the participant’s subsequent productions of syllables or sequences of syllables matches the first production, or 0 when it does not. For example, a child who produces [tə tə tə tə tə] for the target/kə/receives an accuracy score of 0 but a consistency score of 1.
Figure 2. Screen shot of AAA software showing ultrasound image and spectrogram.
For each measure we report individual results and compared groups using Bayes factor-independent sample tests. For maximum rate of each mono, bi, or tri-syllable, we also compared individual results to the norms reported in Fletcher (Citation1978), enabling us to determine whether or not each child was performing as expected for their age.
Ultrasound analysis
For the articulatory analysis we compared only the slowest and maximum rate productions for both single syllables and single segments from within the bi- and tr-syllables. Note, unlike the lingual plosives /t/ and /k/, /p/ does not have constraints on the tongue shape it is produced with – instead we expect it to have a similar tongue shape to the following vowel, [ə]. We include it in the analysis, expecting it to be more stable than lingual consonants as the speaker is not required to move their tongue between repetitions, although small movements are expected due to the trough effect (Vazquez-Alvarez & Hewlett, Citation2007). We report two measures: articulatory t-tests to determine whether slow and fast productions of the same segment are produced with the same or different tongue-shapes; and standard deviations of averaged tongue-shapes as a measure of articulatory instability.
Data annotation
Using AAA v2.18 software (Articulate Instruments Ltd, Citation2014) /p/, /t/ and /k/ segments were annotated at the burst. The corresponding ultrasound frame was then selected and a spline indicating the tongue surface fitted to the image using the semi-automatic edge-detection function in AAA software, see . Each tongue spline comprises 42 co-ordinates situated on a radial fanline with the probe as origin. The AAA edge detection algorithm incorporates a confidence rating based on brightness of the ultrasound image, brighter images have higher confidence levels and are more reliable. We therefore took as a threshold a 50% confidence rating for each tongue spline, enabling us to eliminate areas of low confidence from our analyses. Multiple splines were exported to a spline workspace to average and compare.
Ultrasound statistical analyses
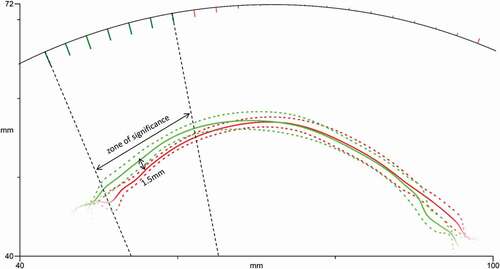
To compare tongue-shapes for consonants produced at different rates, we averaged and compared the multiple attempts at individual consonants at the slowest and fastest rate produced by each participant for each syllable. We then computed t-tests using the inbuilt function in AAA software to determine whether there was a difference in tongue-shape between consonants produced at a slow versus fast rate. The t-test is computed radially along 42 fan-lines emanating from the probe. We chose to use this polar co-ordinate system, rather than a Cartesian system, because tongue splines based on Cartesian coordinates have been shown to create errors for any sections of the tongue that are not parallel to the horizontal axis (Mielke, Citation2015). The t-test is a similar method to smoothing splines ANOVA (Heyne & Derrick, Citation2015). Our threshold for reporting significant difference between means is a minimum of six adjacent radii where the mean difference is significant at p < .05 (Cleland et al., Citation2015) and the confidence level is ≥50. These ≥six adjacent radii are over a contiguous region of the tongue surface (approximately 2–3 cm of surface), reflecting the fact that the adjacent parts of the tongue are not independent. shows example mean tongue curves for one speaker taken from the burst of /p/ at slow (red) and fast (green) rates. Standard deviations are shown as dotted lines. In the anterior region the tongue curves overlap, however there is a statistically significant difference in the posterior region. Any apparent difference in the anterior region in not significant due to low confidence in the tongue tracing (i.e. the image is faint or in shadow in some productions). We report the mean p-value for these regions of significance. To determine whether increased rate leads to greater articulatory instability we compared the standard deviation of the tongue splines of the slowest rate productions to the fastest rate productions, by syllable, bi-syllable or tri-syllable, using Bayes independent sample test between groups. Similar studies, for example, Lenoci et al. (Citation2020) and Zharkova and Hewlett (Citation2009) also report standard deviations for token to token variability (though at normal speaking rate), but in both these studies the nearest-neighbour method is used, which is based on Euclidian distances within a Cartesian co-ordinate system. Again, we choose to use a polar co-ordinate system to avoid errors where the tongue is not parallel to the horizontal axis. We predicted that the ASD group would have larger SDs, that is, greater articulatory instability. To avoid difficulties calculating standard deviations at the far ends of the tongue, which can be difficult to image, we report the mean standard deviation within regions of at least six adjacent fanlines with again at least 50% confidence level.
Figure 3. Example mean tongue curves from /p/ at slow (red) and fast (green) rates with standard deviations in dotted lines. A zone of significantly different radii are shown as green spokes on the arc. In this example 7 consecutive radii have an average radial difference of 1.5 mm.
Results
Rate
shows each child’s maximum rate in syllables per second for all prompts. Rates more than one standard deviation below the means reported in Fletcher (Citation1978) are indicated with shaded cells. The Bayes factor-independent sample test showed there was no significant difference between maximum rate in the children with ASD and the control group for any of the single syllables, bi- or tri-syllables (p values and Bayes factors are given in table). The Bayes factors between 1–3 indicate that there is also only anecdotal evidence for the null hypothesis, suggesting results are inconclusive. However, by comparing the DDK rates to the norms from Fletcher (Citation1978) we can see that one child with autism, 01ASDM, had DDK rates below the normal range for all single syllable productions and one other child with ASD also showed slower than normal rates in single syllable production of/k/. In contrast, only one TD child had one DDK rate slower than expected. We also observed that in 56% of prompts in the ASD group, and 38% in the TD group DDK, rates were actually more than one standard deviation faster than those reported in Fletcher (Citation1978), perhaps due to the differing methodology in eliciting the DDK tasks.
Table 3. Maximum rate in syllables per second
Accuracy
Individual accuracy scores are reported in . Both groups were very accurate at imitation of single syllables, with the TD group performing at ceiling. However, two children in the ASD group had significant difficulty with the accuracy of sequences, with 03ASDM unable to accurately imitate /p t k/ at all and 09ASDM only imitating two attempts out of five accurately. The Bayes factor-independent sample test p values and Bayes factors are given in the table. There was no statistically significant difference in the accuracy of single syllables or sequences between groups, perhaps due to the limited sample size. Interestingly, for/tk/there was moderate evidence for the null hypothesis, that is there is likely to be no difference in the accuracy of this bi-syllable.
Table 4. Accuracy
Consistency
Individual consistency scores, p values and Bayes factors are reported in . Most of the children with ASD showed inconsistency, in both single syllable and sequences. In contrast, the TD children appear more consistent in single syllables, but not in sequences, although neither group comparison met statistical significance. For the most part the Bayes factors were between 1–3 suggesting that there is only anecdotal evidence for the null hypothesis and results are therefore inconclusive. However, for /p/ there was moderate evidence for alternative hypothesis and for /t/ there was anecdotal evidence for the alternative hypothesis, suggesting that the children with autism may have been less consistent than the TD children.
Table 5. % consistent
Ultrasound results
Differences in tongue-shape
shows the t-test results for the tongue-shape comparison between slow and fast productions of each speech sound. We summarise this in as the number of children per group with a significantly different tongue shape for slow and fast productions, that is a tongue-shape different in at least six adjacent fanlines. For all of the single syllable productions the children with autism were more likely to show tongue shape differences than typically developing children. Single syllables were also more likely than bi- or tri-syllables to show variation in tongue shape in both groups. In the bi-syllable /t k/, /t/ was more likely to show differences in tongue-shape than /k/.
Table 6. Articulatory t-test results comparing tongue shapes at slowest and fastest rates
Figure 4. Percentage of each group with significant tongue-shape differences in slow versus fast productions.
Articulatory stability: standard deviations of tongue-shapes
shows the standard deviations for single syllables (pooled), bi-syllables and tri-syllables. A Bayes factor-independent samples test showed no significant differences in standard deviations between children with autism and typically developing children. Bayes factors between 1 and 3 however suggest there is only anecdotal evidence for the null hypothesis that there is no difference between groups. One exception to this was the tri-syllabic condition where the Bayes factor between 3 and 10 suggests moderate evidence for no difference between the groups. shows that in all cases the children with autism had larger standard deviations of tongue shapes, that is greater articulatory instability, than the typically developing children and it is therefore likely that the small sample size led to non-significant results. We also noted that in both groups of children there was a wide range of values, from standard deviations of less than 1 mm up to 36 mm. In general, standard deviations were similar across the board for single, bi-, and tri- syllables at both rates.
Table 7. Standard deviations of tongue-shapes at slow and fast rates in mm
Figure 5. Mean standard deviations for single, bi- and tri-syllables in both groups.
Results summary
In summary, we find no difference between groups in rate, accuracy, consistency and articulatory measures of DDK rate. exemplify a trend towards increased differences in tongue shape and variance between slow and fast productions. Two children with ASD evidenced difficulty with tri-syllabic production and it is therefore likely that a subgroup of children with autism present with subtle motor speech differences or with subtle differences at the threshold of current instrumental measurement.
Discussion
This study presents a new ultrasound protocol for assessing repeated mono-, bi- and tri-syllabic speech at increasing rates to evaluate speech motor control in children. Using a protocol originally designed for EPG (McCann & Wrench, Citation2007), we designed a method for using ultrasound tongue imaging as a tool for evaluating articulatory stability during the production of these syllables at different rates. To the best of our knowledge no other study has used an instrumental method to evaluate speech in children with ASD. To that end, we found that the method was feasible and school-aged verbal children with autism were mostly able to comply with the procedure. However, we note that two children with autism did not complete data collection and therefore some children may find it difficult to comply with using the ultrasound equipment. We expect that this issue would be compounded with younger children, those with more severe autism, or other severe communication disorders.
Rate, accuracy, and consistency
While this small pilot study is not able to offer conclusive results at a group level, we do offer observations about the differences in rate, accuracy, consistency and articulatory stability between children who have ASD and those who do not, as an illustration of how this protocol might be used in other groups of children. We found no differences in rate between groups, consistent with our hypothesis. Rate differences can be found in speakers with dysarthria and this was not predicted in ASD (Shriberg et al., Citation2019). Moreover, a previous study of children with ASD found that DDK rates were actually faster in this group (Mahler, Citation2012). However, if we compare DDK rates to the norms from a much larger group of typically developing children (Fletcher, Citation1978) we can see that one child with autism, 01ASDM, had DDK rates below the normal range for all single syllable productions and one other child with ASD also showed slower than normal rates in single syllable production of /k/. Interestingly, in many cases the DDK rates were actually faster than those in the traditional norms. We suggest this may be due to the differing methods of elicitation. In traditional tasks children are asked to “go as fast as they can”. Williams and Stackhouse (Citation2000) point out that this instruction is interpreted by different children in different ways. Using the protocol suggested by McCann and Wrench (Citation2007) circumvented this because the children imitated stimuli at increasing rates, perhaps allowing a true maximum performance to be achieved. We suggest that a study collecting DDK data using this method from a larger number of typically developing children would be needed to confirm this. Diepeveen et al. (Citation2019) used a similar imitation protocol with 1,524 Dutch-speaking children and found that it was suitable for children aged over three years; however, norms were only collected for children up to the age of seven.
In terms of accuracy, both groups were very accurate at imitation of single syllables, with the typically developing group performing at ceiling. Given that /p/, /t/, and /k/ are all early acquired phonemes (McLeod & Crowe, Citation2018) this was expected for the typically developing children. Although the children with ASD presented with some evidence of SSD in terms of percentage consonants correct (see ), again we did not expect significant difficulty in imitating individual speech sounds, even at maximum rate. However, two children in the ASD group had significant difficulty with the accuracy of sequences, with 03ASDM unable to accurately imitate /p t k/ at all and 09ASDM only achieving two attempts out of five. While these results do not meet significance at the group level, it is worth pointing out that difficulty sequencing tri-syllables in DDK tasks is characteristic of motor speech disorders (Thoonen et al., Citation1996). The same children with ASD, 03ASDM and 09ASDM, presented with difficulties in consistency, again suggesting that these children are part of a subgroup of children with ASD with characteristics of motor speech disorders (for example, speech motor delay or CAS), in line with Shriberg et al. (Citation2019).
In terms of consistency at a group level, the Bayes factors provided some evidence that for /p/ and /t/ mono-syllables the children with autism may have been less consistent than the TD children. This is surprising given that no such difference was found in the bi- and tri-syllables and a larger study would be needed to confirm or refute this pattern. In both groups, some children had difficulty with consistency. This was surprising given the age of the children in the typically developing group.
Ultrasound analysis of tongue-shape during DDK
We performed two analyses of tongue-shapes to compare productions at the slowest and fastest rate. Note, DDK tasks typically only look at maximum rate, because this taxes the speech motor control system. By comparing productions at more than one rate we were able to determine whether children show evidence of different tongue shapes at different rates, predicting that consonants would be produced differently at different speeds because increased speaking rate leads to undershoot (Lindblom, Citation1963). We did not find significant articulatory t-test results across the board. This was not surprising for the bilabial stop /p/ where the tongue is not required to move between syllables (except for small differences due to the trough effect), but we note a high number of non-significant results across all mono, bi- and tri-syllables in both groups, which was contrary to our expectations. These articulatory t-tests incorporate differences between at least six adjacent fanlines and are therefore likely to be robust findings (Cleland et al., Citation2017). Moreover, shows that children with ASD were more likely to have different tongue shapes for slow and fast rates than typically developing children, perhaps suggesting some differences in articulatory strategies. This highlights the advantages of using articulatory analysis to measure DDK rate, as only with techniques that directly measure the movements of the articulators are we able to draw conclusions about motor control of the tongue. In order to comment further on whether undershoot was present an analysis of the distances between tongue curves, such as that described in Lenoci and Ricci (Citation2018), would be required, but space considerations prevent us from performing this analysis and we leave it for future work.
As a measure of articulatory stability we calculated the standard deviation of tongue shapes. For this analysis we pooled together the mono, bi-, and tri-syllable data. Again, there were no significant differences between groups, suggesting the children with autism showed no more articulatory instability than the typically developing children. However, in all cases the Bayes factors suggest there is only anecdotal evidence for the null hypothesis, results are therefore inclusive for this small sample size. Indeed, in all cases the children with autism as a group had larger standard deviations, though it is worth noting a wide range in both groups, from less than a mm up to 35 mm. It would be very useful to obtain norms from a large group of typically developing children to determine the range of differences in tongue-shape across multiple repetitions as there is at least some evidence that this is increased in children with motor speech disorders (Lenoci & Ricci, Citation2018).
Limitations and future directions
The small sample size has obvious limitations, although we were able to make useful observations about the feasibility of the methods for school aged-children with autism. The protocol presented here therefore has the potential to be a useful method for collecting in-depth information about DDK rate, accuracy, consistency, and articulatory stability in children with a variety of speech or communication disorders. Moreover, DDK is also widely used in the assessment of acquired motor speech disorders and similar assessment methods can be used for the differential diagnosis of motor speech disorders in adults (Allison et al., Citation2020). Nevertheless, there were some practical issues with using ultrasound as a method of collecting DDK data. While the tool itself is non-invasive and data was relatively easy to collect, the process of annotating data and extracting the articulatory t-tests and standard deviations was time consuming. It was for this reason that we chose to perform the articulatory analysis only the slowest and fastest productions, rather than intermediate rates. It is possible that a full analysis of all rates would have elucidated further information about the motor control system and we leave this for future work. Nevertheless, instrumental methods of assessment such as this have the advantage of being more objective and other studies have shown that a computerised method of collecting data such as this can be more reliable (Diepeveen et al., Citation2019) and may be considered in future work. Furthermore, while DDK norms for rate, and to a lesser extent, accuracy and consistency exist, there are no norms for articulatory measures. A future study on typically developing children stratified for age would be very useful, both for articulatory measures and for calculating new DDK rates as there was some evidence that the rates produced in this study were faster than those previously published in the literature (Fletcher, Citation1978).
Summary and conclusions
In summary this pilot study shows ultrasound tongue imaging can be used as an additional measure of speech motor control during maximum performance tasks. Preliminary group comparisons suggest no, or only small differences in DDK rate, accuracy, and consistency between children with autism and typically developing children, but two children in our sample showed significant difficulty sequencing tri-syllabic sequences. This is consistent with the view of Shriberg et al. (Citation2019) that measurable motor speech disorders are not necessarily a universal feature of ASD but may be present in a small subgroup. For this subgroup of children, diagnosis of a motor speech disorder, such as speech motor delay, will enable clinicians to choose appropriate, motor-based, interventions for treating any speech disorders.
Acknowledgments
Thank you to the children and their parents who took part in the study. Thank you to the Maxwell Bequest Fund for funding a PhD bursary for the first author.
Disclosure statement
No potential conflict of interest was reported by the author(s).
Correction Statement
This article has been corrected with minor changes. These changes do not impact the academic content of the article.
Additional information
Funding
References
- Allison, K. M., Cordella, C., Iuzzini-Seigel, J., & Green, J. R. (2020). Differential diagnosis of apraxia of speech in children and adults: A scoping review. Journal of Speech, Language, and Hearing Research, 63(9), 2952–2994. https://doi.org/https://doi.org/10.1044/2020_JSLHR-20-00061
- Articulate Instruments Ltd. (2014). Articulate assistant advanced ultrasound module user manual, revision 2.14. Articulate Instruments.
- Chenausky, K., Brignell, A., Morgan, A., & Tager-Flusberg, H. (2019). Motor speech impairment predicts expressive language in minimally verbal, but not low verbal, individuals with autism spectrum disorder. Autism & Developmental Language Impairments, 4, 1–12. https://doi.org/https://doi.org/10.1177/2396941519856333
- Cleland, J., Gibbon, F. E., Peppé, S. J., O’Hare, A., & Rutherford, M. (2010). Phonetic and phonological errors in children with high functioning autism and Asperger syndrome. International Journal of Speech-Language Pathology, 12(1), 69–76. https://doi.org/https://doi.org/10.3109/17549500903469980
- Cleland, J., Scobbie, J. M., Heyde, C., Roxburgh, Z., & Wrench, A. A. (2017). Covert contrast and covert errors in persistent velar fronting. Clinical Linguistics & Phonetics, 31(1), 35–55. https://doi.org/https://doi.org/10.1080/02699206.2016.1209788
- Cleland, J., Scobbie, J. M., & Wrench, A. A. (2015). Using ultrasound visual biofeedback to treat persistent primary speech sound disorders. Clinical Linguistics & Phonetics, 29(8–10), 575–597. https://doi.org/https://doi.org/10.3109/02699206.2015.1016188
- Deshmukh, R. (2012). Motor speech characteristics of children with Autism. The Ohio State University. http://rave.ohiolink.edu/etdc/view?acc_num=osu1337956015
- Diepeveen, S., Van Haaften, L., Terband, H., De Swart, B., & Maassen, B. (2019). A standardized protocol for maximum repetition rate assessment in children. Folia Phoniatrica Et Logopaedica, 71(5–6), 238–250. https://doi.org/https://doi.org/10.1159/000500305
- Dodd, B., Zhu, H., Crosbie, S., Holm, A., & Ozanne, A. (2002). Diagnostic evaluation of articulation and phonology (DEAP). Psychology Corporation.
- Duffy, J. R. (2000). Motor speech disorders: clues to neurologic diagnosis. In Parkinson’s disease and movement disorders (pp. 35–53). Humana Press.
- Esposito, G., & Pasca, S. (2013). Motor abnormalities as a putative endophenotype for Autism Spectrum Disorders. Frontiers in Integrative Neuroscience, 7, 43. https://doi.org/https://doi.org/10.3389/fnint.2013.00043
- Fletcher, S. G. (1978). The Fletcher time-by-count test of diadochokinetic syllable rate. PRO–ED.
- Folker, J. E., Murdoch, B. E., Cahill, L. M., Delatycki, M. B., Corben, L. A., & Vogel, A. P. (2011). Kinematic analysis of lingual movements during consonant productions in dysarthric speakers with Friedreich’s ataxia: A case-by-case analysis. Clinical Linguistics & Phonetics, 25(1), 66–79. https://doi.org/https://doi.org/10.3109/02699206.2010.511760
- Heyde, C. J., Scobbie, J. M., Lickley, R., & Drake, E. K. E. (2016). How fluent is the fluent speech of people who stutter? A new approach to measuring kinematics with ultrasound. Clinical Linguistics & Phonetics, 30(3–5), 292–312. https://doi.org/https://doi.org/10.3109/02699206.2015.1100684
- Heyne, M., & Derrick, D. (2015). Using a radial ultrasound probe’s virtual origin to compute midsagittal smoothing splines in polar coordinates. The Journal of the Acoustical Society of America, 138(6), EL509–EL514. https://doi.org/https://doi.org/10.1121/1.4937168
- Lenoci, G., Celata, C., Ricci, I., Chilosi, A. & Barone, V. (2020). Vowel variability and contrast in Childhood Apraxia of Speech: Acoustics and articulation. Clinical Linguistics & Phonetics. Advance online publication. https://doi.org/https://doi.org/10.1080/02699206.2020.1853811
- Lenoci, G., & Ricci, I. (2018). An ultrasound investigation of the speech motor skills of stuttering Italian children. Clinical Linguistics & Phonetics, 32(12), 1126–1144. https://doi.org/https://doi.org/10.1080/02699206.2018.1510983
- Lindblom, B. (1963). Spectrographic study of vowel reduction. The Journal of the Acoustical Society of America, 35(11), 1773–1781. https://doi.org/https://doi.org/10.1121/1.1918816
- Mahler, B. (2012). Comparing motor speech skills of children with high functioning autism versus those of typically developing children using diadochokinetic tasks (Doctoral dissertation). The Ohio State University.
- McCann, J., & Wrench, A. A. (2007). A new EPG protocol for assessing DDK accuracy scores in children: A down’s syndrome study. Proceedings of the 16th International Congress of the ICPhS (pp. 1359), Saarbrücken. http://www.icphs2007.de/
- McLeod, S., & Crowe, K. (2018). Children’s consonant acquisition in 27 languages: A cross-linguistic review. American Journal of Speech-Language Pathology, 27(4), 1546–1571. https://doi.org/https://doi.org/10.1044/2018_AJSLP-17-0100
- Mielke, J. (2015). An ultrasound study of Canadian French rhotic vowels with polar smoothing spline comparisons. The Journal of the Acoustical Society of America, 137(5), 2858–2869. https://doi.org/https://doi.org/10.1121/1.4919346
- Robbins, J., & Klee, T. (1987). Clinical assessment of oropharyngeal motor development in young children. Journal of Speech and Hearing Disorders, 52(3), 271–277. https://doi.org/https://doi.org/10.1044/jshd.5203.271
- Rutter, M., Bailey, A., & Lord, C. (2003). The social communication questionnaire: Manual. Western Psychological Services.
- Shriberg, L. D., & Lof, G. L. (1991). Reliability studies in broad and narrow phonetic transcription. Clinical Linguistics & Phonetics, 5(3), 225–279. https://doi.org/https://doi.org/10.3109/02699209108986113
- Shriberg, L. D., Paul, R., McSweeny, J. L., Klin, A., Cohen, D. J., & Volkmar, F. R. (2001). Speech and prosody characteristics of adolescents and adults with high-functioning autism and Asperger syndrome. Journal of Speech, Language, and Hearing Research, 44(5), 1097–1115. https://doi.org/https://doi.org/10.1044/1092-4388(2001/087)
- Shriberg, L. D., Strand, E. A., Jakielski, K. J., & Mabie, H. L. (2019). Estimates of the prevalence of speech and motor speech disorders in persons with complex neurodevelopmental disorders. Clinical Linguistics & Phonetics, 33(8), 707–736. https://doi.org/https://doi.org/10.1080/02699206.2019.1595732
- Sugden, E., Lloyd, S., Lam, J., & Cleland, J. (2019). Systematic review of ultrasound visual biofeedback in intervention for speech sound disorders. International Journal of Language & Communication Disorders, 54(5), 705–728. https://doi.org/https://doi.org/10.1111/1460-6984.12478
- Thoonen, G., Maassen, B., Wit, J., Gabreels, F., & Schreuder, R. (1996). The integrated use of maximum performance tasks in differential diagnostic evaluations among children with motor speech disorders. Clinical Linguistics & Phonetics, 10(4), 311–336. https://doi.org/https://doi.org/10.3109/02699209608985178
- Trevarthen, C., & Delafield-Butt, J. T. (2013). Autism as a developmental disorder in intentional movement and affective engagement. Frontiers in Integrative Neuroscience, 7, 49. https://doi.org/https://doi.org/10.3389/fnint.2013.00049
- Vazquez-Alvarez, Y., & Hewlett, N. (2007). The ‘trough effect’: An ultrasound study. Phonetica, 64(2–3), 105–121. https://doi.org/https://doi.org/10.1159/000107912
- Williams, P., & Stackhouse, J. (2000). Rate, accuracy and consistency: Diadochokinetic performance of young, normally developing children. Clinical Linguistics & Phonetics, 14(4), 267–293. https://doi.org/https://doi.org/10.1080/02699200050023985
- Zharkova, N., & Hewlett, N. (2009). Measuring lingual coarticulation from midsagittal tongue contours: Description and example calculations using English /t/ and /ɑ. Journal of Phonetics, 37(2), 248–256. https://doi.org/https://doi.org/10.1016/j.wocn.2008.10.005