
 ?Mathematical formulae have been encoded as MathML and are displayed in this HTML version using MathJax in order to improve their display. Uncheck the box to turn MathJax off. This feature requires Javascript. Click on a formula to zoom.
ABSTRACT
Ultrasound Tongue Imaging is increasingly used during assessment and treatment of speech sound disorders. Recent literature has shown that ultrasound is also useful for the quantitative analysis of a wide range of speech errors. So far, the compensatory articulations of speakers with cleft palate have only been analysed qualitatively. This study provides a pilot quantitative ultrasound analysis, drawing on longitudinal intervention data from a child with submucous cleft palate. Two key ultrasound metrics were used: 1. articulatory t-tests were used to compare tongue-shapes for perceptually collapsed phonemes on a radial measurement grid and 2. the Mean Radial Difference was reported to quantify the extent to which the two tongue shapes differ, overall. This articulatory analysis supplemented impressionistic phonetic transcriptions and identified covert contrasts. Articulatory errors identified in this study using ultrasound were in line with errors identified in the speech of children with cleft palate in previous literature. While compensatory error patterns commonly found in speakers with cleft palate have been argued to facilitate functional phonological development, the nature of our findings suggest that the compensatory articulations uncovered are articulatory in nature.
Introduction
Orofacial clefts are the most common craniofacial condition, with an incidence of approximately 1.2/1000 live births worldwide (Rahimov et al., Citation2012). Several cleft types exist, including submucous clefts, where there is intact oral surface mucosa, but palatal muscle defects. Both overt and submucous cleft palate (CP) give rise to similar speech difficulties (Boyce et al., Citation2018). Due to difficulties achieving velopharyngeal closure, children with CP often present with compensatory articulations, characterized by retraction of anterior sounds (Harding & Grunwell, Citation1998). While these speech errors are mostly articulatory in nature, they may have phonological consequences (Harding & Grunwell, Citation1996).
Assessment of speech in children with CP begins with a phonetic transcription. Deemed the gold standard for perceptual assessment of speech in CP, there are nevertheless issues with the reliability and objectivity of transcriptions (Howard, Citation2011; Sell, Citation2005). Transcribing speech in this population is particularly challenging because it is often characterised by non-native productions, such as pharyngeal articulations (non-native in English-speaking children), weak articulations, nasal realisations, and nasal emissions. To circumvent some of these issues, multiple-listener perceptual evaluations can be undertaken to provide inter and intra-rater reliability measures (Roxburgh et al., Citation2016). Alternatively, a large body of small n studies suggests that instrumental articulatory techniques such as electropalatography (EPG) can be used to identify covert contrasts or covert errors in an objective manner (Gibbon, Citation2004; Howard, Citation2004). A covert contrast is defined as a perceptual neutralisation of two or more phonemes where acoustic, articulatory, or more sophisticated perceptual measures such as visual analogue scales, reveal subtle differences between target phonemes (Hewlett, Citation1988; Munson et al., Citation2012). This type of error is important because it points towards the child having phonological knowledge of the target phonemes.
Covert contrasts are not detectable by phonetic transcription alone, but may be diagnostically important, often suggesting a phonetic or articulatory cause to a speech error, rather than a phonological cause. EPG allows visualisation of tongue-palate contact, and a number of well-defined EPG metrics are described in the literature which can be used to quantify covert contrasts (see Lee, Citation2021, for an overview). For example, Gibbon and Crampin (Citation2001) used the EPG metric “Centre of Gravity” to show that an adult with repaired cleft produced /k/ and /t/ targets differently, despite both being transcribed as [c]. However, due to the requirement for individualised palates and cost implications of these, recent literature has suggested that ultrasound tongue imaging (UTI) might be a cheaper alternative. UTI analyses the tongue surface, unlike the contact patterns of tongue against the hard palate familiar from EPG. Ultrasound tongue images extend from near the tongue tip to root, making uvular and pharyngeal articulations visible, which is an advantage over EPG. UTI can be used either qualitatively or quantitatively (i.e., using metrics similar to EPG). In quantitative approaches, the ultrasound data is annotated by tracking the surface of the tongue and extracting Cartesian or polar coordinates to enable, for example, the analyst to determine whether two sets of tongue curves are statistically different from one another (Cleland, Citation2021). In contrast, qualitative approaches typically involve experienced UTI users simply viewing the ultrasound data and making observations about the nature of the movements, for example, observing movement of the tongue dorsum when tongue tip movement is expected in the case of backing. Currently, UTI has less well-defined metrics than EPG, particularly for disordered speech (See Cleland, Citation2021 for an overview of ultrasound metrics). Nevertheless, UTI has been noted as a promising tool for the assessment of CP speech (Bressmann et al., Citation2011; Cleland et al., Citation2019) and in therapy for a range of SSDs (Cleland et al., Citation2015b; Preston et al., Citation2014), with increasing evidence (Sugden et al., Citation2019). While there is growing evidence for the use of UTI in the assessment of SSDs in CP, there is limited evidence of its effectiveness in treatment (Roxburgh, Citation2018; Roxburgh et al., Citation2016).
A small number of studies have used UTI to investigate compensatory articulations in CP. Two studies have taken qualitative approaches. Bressmann et al. (Citation2011) investigated compensatory articulations of voiceless velar stops in the speech of five individuals with CP. Qualitative analysis of the data revealed a variety of typical CP compensatory strategies such as pharyngeal stops and mid-palatal stops. In a larger study, Cleland et al. (Citation2019) investigated inter-rater reliability and the number and type of errors identified by UTI, using it as an additional modality during the transcription of speech from 35 speakers with CP. Again, the ultrasound images were analysed only qualitatively. They compared audio-only transcription of disordered speech to transcription accompanied by UTI. Errors were transcribed and then classified using Gibbon’s (Citation2004) EPG taxonomy of speech errors. Cleland et al. (Citation2019) provided example ultrasound images and descriptions, using the same taxonomy of errors. Some compensatory articulation patterns could be detected in both EPG and UTI data: increased contact; retraction; fronting; complete closure; open pattern (EPG) /uvular or pharyngeal articulation (UTI); double articulations; increased variability; and abnormal timing. Additionally, retroflexion was detected via UTI (but was not visible with EPG). Results showed no significant difference between transcribers in terms of the number of items identified as “correct”. Transcribers who were given additional ultrasound information found increased instances of double articulations, retraction to pharyngeal/uvular articulations, and retroflexion within the productions they identified as “incorrect”, suggesting covert errors. However, this study used qualitative observations only, and was therefore unable to determine whether covert contrast was present. Covert contrasts are best identified by comparing tongue-shapes, preferably from minimal pair data, statistically.
Quantitative measures are therefore crucial in the analysis of ultrasound data, particularly that of any clinical population, to identify any covert errors or covert contrasts, such as those found by Cleland et al. (Citation2017) in speakers with speech disorders of unknown origin. Cleland. and Scobbie (Citation2021) provided norms from 30 typically developing children with which to compare potentially incorrect /t/ and /k/ productions. They quantified the dorsal differentiation between alveolars and velars, on the assumption that tighter dorsal constrictions in a /k/ relative to the same speaker’s /t/ can be a precursor to successful contrastive closure. A visible “dorsal crescent” formed by the mean tongue surface splines for /k/ (further from the probe) and /t/ (closer), which conveys the additional dorsality of /k/ relative to /t/, formed the basis for their quantification. A radial measurement fan was superimposed on the midsagittal image, with the probe as origin. “KTmax” was defined as the maximum value from the series of radial length differences within this dorsal crescent. Articulate Assistant Advanced (AAA) software (Articulate Instruments Ltd, Citation2012) provided a ready-made fan-shaped grid with 42 radii appropriate for the hardware. AAA semi-automatically fitted splines to the image and measured, averaged and exported them via (a subset of the available) 42 spline knots: AAA easily provided pairs of distances between comparable splines along measurement vectors oriented radially to the nominal centre of the ultrasound probe, i.e., along a series of radii. KTmax differed in different vowel environments due to the effects of coarticulation of the vowel on the /k/ and /t/ tokens e.g., because a high front vowel context palatalises /k/’s primary place of constriction or adds secondary palatalisation to /t/.
Cleland. and Scobbie (Citation2021) also reported these measures for children with SSD during the course of ultrasound biofeedback intervention. By considering the magnitude and number of the radial differences in the dorsal crescent (including their significance as calculated by t-tests in AAA), they showed that some children acquired the /k/-/t/ contrast in an articulatorily gradient manner, suggestive of a motor, rather than phonological, error. This study therefore suggests that quantitative measures can also be useful for measuring progress in intervention towards correct productions, even though most studies of ultrasound biofeedback use only perceptual measures of percentage consonants correct to report outcomes (Sugden et al., Citation2019).
These attempts to quantify the spatial characteristics of the dorsal difference between alveolars and velars, to chart the emergence of a statistically significant contrast in this area, and to relate it to typical speech do, however, rely on the identification of a canonical dorsal crescent in the disordered speech. This may be a drawback for cases of atypical speech production in which there is no such indicator of canonical contrast. Sometimes it may be necessary to analyse instead (or additionally) non-canonical differences in any zone of the vocal tract in which significant differences in tongue shape or location can be found. Moreover, differences beyond this dorsal crescent might be just as important, for example, in the tongue root.
Despite an increasing number of ultrasound studies employing metrics such as those described by Cleland (Citation2021) and a large body of small n EPG studies suggesting that articulatory analysis might be useful for children with CP, to our knowledge ultrasound biofeedback and its metrics have been under-utilised in this population (Sugden et al., Citation2019). It was therefore a goal of the current study to apply quantitative ultrasound analysis to longitudinal ultrasound data from a child with CP undergoing both ultrasound visual biofeedback intervention, as well as more traditional therapy.
Aims and research questions
This paper provides an ultrasound analysis of data from a Scottish speaker, Andrew, with submucous CP. Data is from Roxburgh et al. (Citation2016), and Roxburgh (Citation2018). Our key aim was to determine whether it was possible to apply quantitative analysis to ultrasound data from speakers with CP. For our quantitative analysis we chose two main measures: articulatory t-tests (see for example, Cleland et al., Citation2017) and a new measure that could augment KTMax, Mean Radial Difference (MRD, see below). T-tests were used to both determine whether covert contrasts occurred in perceptually neutralised phonemes and to determine whether, over the course of intervention, a contrast emerged. MRD was used to determine the magnitude in mm of that difference. Our questions were therefore:
1. Do the articulatory t-tests reveal covert contrasts in perceptually neutralised phonemes before intervention?
Non-significant t-tests do not disprove the null hypothesis of complete neutralisation, whereas significant t-test results indicate a covert contrast.
2. Do the articulatory t-tests change over time, in line with improvement following intervention?
Improvement during intervention will be indicated by a significant difference in articulatory t-tests comparing tongue shapes for previously neutralised phonemes.
3. What is the magnitude of the statistical difference in articulatory t-tests, as measured by MRD?
We expect post-intervention MRD to be larger than pre-intervention MRD
Method
Speaker
Andrew was 9;2 years at the outset of data collection and was noted to be backing /n/ to palatal or velar place of articulation and distorting /s/ by his Speech and Language Therapist (SLT, see below). In addition to repaired submucous CP, Andrew also had a diagnosis of hemifacial microsomia with unilateral microtia on the right side, resulting in a mild unilateral conductive hearing loss. He was referred to the specialist CP SLT service at age 2;11 to assess palatal movement. On referral, Andrew’s phonetic inventory consisted of the consonants /m/ and /n/ and a range of vowels. He had a history of grommet insertion and fluctuating conductive hearing loss. He had a tongue tie clipped in infancy. Further surgery was carried out to improve velar palsy at age 6;0 and 8;5 years. Andrew had received therapy from the community SLT and from the CP specialist SLT from age 3;11 to the point of referral to the current study at age 9;2. At outset of the current study, Andrew had normal resonance with no audible nasal emission, however he did have inconsistent nasal turbulence. He had adequate oral pressure for high pressure consonants. The referring SLT requested /n/, which was backed, as a treatment priority for the study. He did not receive therapy from the community or CP specialist SLT for the duration of the study.
Andrew’s current speech production was assessed using the phonology subtest of the Diagnostic Evaluation of Articulation and Phonology (DEAP, Dodd et al., Citation2002) and is summarised in Appendix A. Atypical errors, including cleft-type characteristics such as palatalisation, retraction and double articulations, made up 58% of Andrew’s errors, with retraction of /n/ to [ŋ] being the most consistent error.
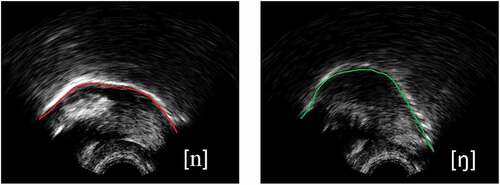
Since Andrew presented with a merger between alveolar and velar targets through phonetic transcriptions, correct production of /n/ was set as the therapy target. shows example ultrasound images from a typical child speaker for /n/ (left) and /ŋ/(right) with the tongue tip facing to the right. As we can see from the images, the tongue body is low for /n/ and raised for /ŋ/. In a post-hoc analysis of articulatory data gathered during therapy, it was predicted that Andrew would have non-significant t-tests between /n/ and /ŋ/ targets and MRDs near zero in pre-therapy probes. Following successful intervention, larger MRDs and significant t-tests were anticipated. However, if significant t-tests had existed prior to intervention this would indicate a covert contrast had been present.
Figure 1. Example ultrasound images from a typical child speaker for n (left) and ŋ (right) with the tongue tip facing to the right.
Ethical approval was granted by the National Health Service Research Ethics Committee (REC01) and Research and Development Office; and the Queen Margaret University Ethics Committee.
Therapy
Andrew received two blocks of therapy, each consisting of eight one-hour sessions of motor-based therapy. The first block used a visual articulatory model (VAM) on the Speech Trainer 3D iPad app (Apple, Citation2012; Smarty Ears, Citation2011) to provide articulatory support for therapy, but the treating clinician did not use ultrasound for assessment or treatment (though ultrasound data was recorded). The second block used ultrasound visual-biofeedback (U-VBF). Full details of the mixed intervention approach are reported in Roxburgh (Citation2018), but in summary, the case study reported here involved two separate blocks of intervention. The first used traditional articulation intervention, supplemented by dynamic visual models of articulation using the application “Speech Trainer 3D” to demonstrate correct articulations to the speaker. The second used real-time ultrasound images to allow biofeedback of articulations. Overall results suggest improvements in accuracy of targeted consonants. This is not further reported here, instead we focus on how ultrasound metrics can be used to supplement both the assessment and progress monitoring phase of intervention by considering ultrasound data gathered during both blocks.
Recording set up
Synchronised ultrasound, audio and video camera data (frontal view of the lips) was recorded. A headset stabilised the ultrasound probe. shows the assessment and treatment schedule, with indication of which speech measures and probes were recorded in each of six assessment sessions.
Table 1. Assessment and treatment schedule
Data was recorded using an Ultrasonix SonixRP machine remotely controlled via Ethernet from a PC running Articulate Assistant Advanced softwareTM (Articulate Instruments Ltd., Citation2012) version 2.14, which internally synchronised the ultrasound and audio data. Echo return data were recorded at ~121 frames per second (fps), i.e., ~8 ms per frame, with a 135 degree field of view in the mid-sagittal plane. Within each session, the headset kept the probe stable, permitting analysis of all tongue shapes in a common vocal tract space. Between sessions, there is no guarantee that the probe can be replaced in a comparable position, so while the size and significance of within-session differences can be tracked longitudinally, we did not attempt to replace the probe in the same position each time nor to compare tongue shapes directly between sessions.
Probes/speech measures
An untreated wordlist targeting Andrew’s specific lingual errors was recorded at each assessment time-point. Untreated wordlists, to check for generalisation, consisted of 36 words and contained 39 tokens of /n/. See Appendix B for a complete word list. Additionally, a wordlist containing alveolar consonants and treated /n/-/ŋ/ minimal pairs was used to measure contrasts between /n/ and /ŋ/ pre- and post- therapy (see Appendix C).
Phonetic transcriptions
All speech assessments were phonetically transcribed using IPA (International Phonetics Association [IPA], Citation1999) and extIPA symbols (Ball et al., Citation2018) by the treating clinician (the first author), using both the acoustic signal and the front-view camera capturing the lips to inform narrow transcription. After therapy block one had been completed, the first author was able to create narrow phonetic transcription of the untreated wordlist data and the DEAP data using data from both the acoustic signal and front-view camera, plus the previously collected but unseen ultrasound data.
Since the first author was also the treating clinician, to mitigate bias, broad phonetic transcriptions were also completed for all tokens in the untreated wordlists by the second and third authors (the second author is both a clinician and phonetician and the second author is a phonetician experienced in disordered speech) for inter-rater reliability measures. The order of the sessions was randomised so that the listeners were blinded to the time point of the data. Fleiss Kappa was used for statistical analysis of inter-rater reliability. Percent Target Consonant Correct (PTCC) was calculated from the broad transcriptions. Inter-rater reliability will be presented as both percentages and Fleiss Kappa scores.
Ultrasound analysis
Annotation and spline fitting
Single words from the untreated wordlist and additional wordlist, containing six treated minimal pairs, were annotated using AAA v2.16 software (Articulate Instruments Ltd, Citation2015). The onset and offset of nasal segments were annotated using spectral and waveform characteristics and the midpoints annotated for articulatory analysis. The nearest ultrasound frames were then selected and splines indicating the tongue surface were fitted to the images using the semi-automatic edge-detection function in AAA. This edge-fitting function is high speed and provides a confidence rating for the 42 knots on the 42 radii of AAA’s fan-shaped analysis grid. Six splines were averaged for both the alveolar, and the velar target: all mean splines reported passed a confidence threshold of 80%. Manual measurements were used within systematic quality checks to ensure splines were accurate, particularly in the anterior and posterior regions of the tongue that have lower confidence intervals due to poorer image quality in these regions.
Articulatory t-tests
The built-in t-test function within AAA was used to identify radial differences between tongue curves for Andrew’s target /n/ and the minimal pair token /ŋ/ productions. Such tests were made within-session only, i.e., we did not directly compare production of /n/ in one session with production of /n/ in a different session to avoid issues with session-specific probe placement. Instead, we computed t-tests for each of the 42 radii on which the mean spline’s knot had a confidence value above 80% within sessions, and then compared any substantial contiguous subset showing significant differences longitudinally, as described below.
The mean difference for a given fan-line is treated as significant at p <.05, but it is important to note that the presence of one highly significant t-test within an arc of non-significant fan-lines should not be interpreted as more important than a span of several contiguous fan-lines each of which just passes the threshold of p =.05, on edges that had been detected with a high degree of confidence. Cleland et al. (Citation2017) use six adjacent fan-lines with significant t-tests as the threshold for reporting a significant difference between two tongue-shapes. Such a “Zone of Significance” (ZoS) occupies a contiguous arc in the vocal tract, occupied by the two tongue splines found to be significantly different. Here, the zone was operationalised using AAA’s built-in t-tests, with a minimum requirement for five radii (see below), so the amount of tongue surface involved is no less than 2–3 cm, depending on how far the tongue surface was from the probe. Alternative techniques such as radial SS-ANOVA (Heyne & Derrick, Citation2015) could also be used, but whatever the statistical approach, it is important to quantify differences in spatial terms, otherwise the motoric, acoustic and impressionistic ramifications of any differences found are hard to draw.
In a preliminary scan of the data, we found only one ZoS spanning six adjacent fanlines in our data, but several spanning five, so we relaxed our criterion to a minimum of five adjacent fan lines with significance. We justify this on the grounds that Andrew seemed to have an unusually small vocal tract that was likely due to his additional medical diagnoses: he certainly had a small sub-mental space (under the chin), which also made probe placement difficult.
Mean Radial Difference (MRD)
We report a new measure, mean radial difference (MRD), between sets of splines. It was measured using the less conservative ZoS, one comprising no fewer than five contiguous significantly different radii, augmented both by adjacent crossovers and by further contiguous radii on which the alveolar and velar targets were also significantly different. Unlike the KTMax measure reported in Cleland. and Scobbie (Citation2021), this measure does not capture just the size of a canonical dorsal crescent between the two tongue curves, but is more global. The MRD is therefore a suitable measure for comparing a wider range of significantly different tongue shape configurations (rather than only the depth of a canonically-shaped alveolar vs. velar contrast near the velum). Because it can measure both dorsal and tongue root differences and incorporates the cross-over between these areas in which the two tongue splines are the same distance from the origin of measurement fan, the MRD measure, from data presented in this paper is not directly comparable to KTMax (Cleland. & Scobbie, Citation2021). It is also unclear whether it is better to limit MRD to just a ZoS or report a value for all the confidently-detected tongue surfaces. It remains to be seen how the MRD of two mean splines including non-significant anterior or posterior differences beyond the ZoS, or where there are no zones of significance at all, differs from the MRD based on two splines forming a ZoS.
Results
First, error pattern analyses based on phonetic transcriptions will be provided, following which, quantitative ultrasound analyses will be presented. Minimal pair comparisons followed by comparisons of /n/ in different word positions will be reported.
details the transcriptions of the untreated /n/ wordlist. Andrew presented with variable productions. At baseline (prior to any intervention), 95% of attempts at words containing /n/ were transcribed as [ŋ]. Assessments four and six had the highest number of correct productions in WI position (6/12 productions; 50%), assessment 4 had the highest number of correct productions in all word positions (31%). Correct productions occurred most commonly in word initial position.
Table 2. Andrew’s error pattern analysis for /n/ tokens in single words *N.B brackets indicate the number of occurrences
Inter-rater reliability (untreated /n/ wordlist)
Inter-rater reliability results show that three transcribers (the first, second, and third authors) agreed the majority of the time (mean = 72% range = 59%-80%). Statistical analysis showed that the highest agreement across transcribers was found in the Maintenance session (Fleiss’ Kappa = .6538 “intermediate to good”) with all three transcribers agreeing on 31/39 tokens. The lowest agreement was found in the pre-VAM session (Fleiss’ Kappa = .0969), despite all three transcribers agreeing on 30/39 tokens (Roxburgh, Citation2018).
Ultrasound analysis
Articulatory analysis identified a contrast (based on finding a ZoS) in the minimal pair wordlist between /n/ and /ŋ/ at all time points. This suggests a covert contrast, at least at baseline where 95% of attempts at /n/ were transcribed as [ŋ], confirming the alternative hypothesis for research question one that significant articulatory t-tests reveal this type of contrast. displays in six panels (one per session) pairs of mean tongue surfaces for /n/ (green) and /ŋ/ (purple). Solid markers indicate a significant t-test for the relevant radius, while hollow markers indicate a non-significant t-test. Some confidently detected markers are not shown: only those in a pair with a corresponding target, suitable for statistical testing, are shown.
Figure 2. Mean midsagittal tongue surface curves of /n/ (green) /ŋ/ (purple) from minimal pair probes in assessment sessions one to six (tongue tip to the left, on a 1 cm grid, with a 22.5° rotation). Co-radial solid markers indicate a significant radia.
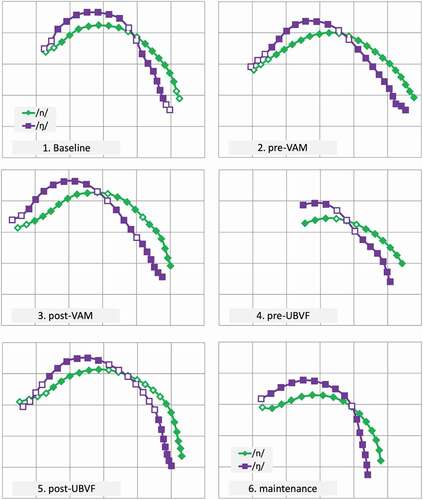
Research question two asked whether the articulatory t-tests changed over time, with the expectation that significant t-tests would be more likely as intervention progressed. shows the spatial aspect of the statistically significant differences between Andrew’s productions of /n/ and /ŋ/, session by session. Visually, long stretches of tongue contour are distinct, reflecting the zones of significance between the radial distance means: t-tests are significant both in the dorsal region and in the tongue root. The crossovers in are generally small, except in session 5. It is tempting to assume there is an active dorsal gesture in each session for /ŋ/, with concomitant tongue root advancement, but ultrasound does not reveal if, or how often, such a dorsal gesture resulted in complete velar closure. Finally, in some sessions (1, 2, 5) there is evidence for a similar alveolar gesture in both /n/ and /ŋ/. Sessions 1, 2 and 5 also had the lowest percent target consonant correct (5%, 8% and 5% respectively).
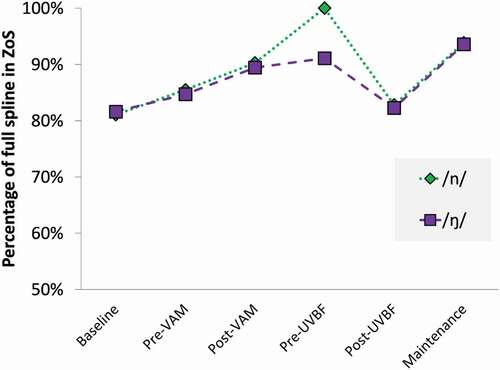
At each time-point, over 80% of the tongue surface in the image fell into a ZoS, (). The pre-UVBF session (session 4) had the highest proportion of tongue in the ZoS (100% for /n/ and 91% for /ŋ/ on 12 radii). However, this is likely to be due to poor image quality failing to show enough of the tongue. The ZoS in the post-UVBF session (83% for /n/ and 82% for /ŋ/, on 24 radii) and in the baseline session (81% for /n/ and 82% for /ŋ/, on 19 radii) were relatively smaller due to good imaging of the tip or root where no significant difference was detected, but longer in absolute terms.
Figure 3. Proportion of the full spline pairs forming a Zone of Significance (5 or more contiguous significant different radii augmented by any cross-over and further significant radii).
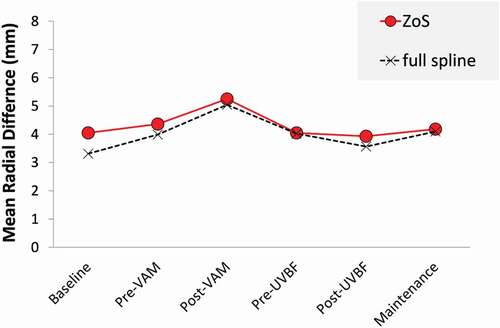
To determine whether the magnitude of any differences between productions of /n/ and /ŋ/ increased over time in response to intervention, we measured the MRD (research question three) in each session (). The MRD difference between /n/ and /ŋ/ in the ZoS was largest mid-way through the interventions, at the post-VAM stage (5.2 mm), indicating that the visual representation of the post-VAM session in (panel 3) is the one in which the tongue-shapes are most different. The MRD for all the radii, including those where there was not a significant difference, is very similar, though with slightly lower values, as shown in . The contrast between these two ways of calculating MRD was also found to be largest in the baseline (4.0 mm vs. 3.3 mm) and smallest in the pre-UVBF session in which the values were the same (4 mm).
Figure 4. Mean Radial Difference between /n/ and /ŋ/, limited to ZoS (red circles) or using all the tongue spline for which both targets exceed the 80% confidence threshold (crosses).
Discussion
This study sought to determine whether quantitative ultrasound metrics could be applied to longitudinal data from a speaker with cleft palate. Specifically, we sought to determine whether articulatory analysis detected a change in tongue-shapes post-therapy and whether any covert contrasts were present in a child with submucous cleft palate. First, articulatory t-tests were significant in each of the assessment sessions, even when 95% of tokens were perceptually neutralised, confirming that covert contrast was present in the data. Because there were significant t-tests at every time point, we were unable to confirm our second hypothesis that the articulatory t-tests would change over time. This highlights the limits of “signficance” alone as a way of measuring change, especially if covert contrasts are present at the outset of intervention. Our third hypothesis was also not confirmed, with no changes in MRD over time, although there was a peak after his first block of intervention.
To our knowledge this is the first study to report covert contrasts in a speaker with CP using ultrasound data. Gibbon et al. (Citation2004) highlighted the importance of distinguishing between covert contrast and contrast neutralisation for diagnostic purposes in their study using EPG as this may differentiate errors which are phonetic in nature from those that are more likely to be phonological. This is of particular importance for the therapy used in the current study, which adopted a motor-based approach. If errors had been phonological in nature, then a motor-based approach would have been unsuitable. The quantitative ultrasound measurements performed here measured not only the presence or absence of any significant difference (a contrast) but also how big the difference was (MRD), therefore distinguishing between covert contrast and contrast neutralisation.
Transcription data showed that /n/ was transcribed as [ŋ] most of the time. Perceptually, there was a merger between alveolar and velar nasal targets. However, the ultrasound analysis identified differences indicating both the presence of covert contrast and abnormal or underspecified articulations (Cleland et al., Citation2015b). While there was dorsal raising for both the alveolar (incorrect) and velar targets in minimal pair data, the analysis showed significant differences in the tongue root, with the suggestion that /n/ was produced with a post-velar articulation. This demonstrates an advantage of ultrasound over EPG, which is not equipped to distinguish between velar, uvular, and pharyngeal productions, as even velar articulations can be made beyond the limits of the EPG palate.
In the current set of data we did not find evidence of covert error, i.e., imperceptible errors or unusual articulations in productions transcribed as correct (Cleland et al., Citation2017). However, we do report these types of errors in a more exploratory analysis of data from the DEAP, reported in Roxburgh (Citation2018)– space considerations prevent us from analysing this data further here, though we note this as an important avenue for further research. While these types of errors do not give rise to a phonological merger, they do provide articulatory evidence of motor-based difficulties. Various covert errors have been identified in EPG and ultrasound literature. Gibbon (Citation1999) describes undifferentiated lingual gestures in EPG, where difficulty differentiating between coronal and dorsal tongue gestures suggest motor impairment. Other errors identified through the use of EPG include misdirected articulatory gestures and, more specifically to cleft palate, double articulations (Hardcastle & Gibbon, Citation2005). Similarly, Bressmann et al. (Citation2011) used UTI to investigate the compensatory articulations for velar stops in speakers with CP and found covert articulatory movements. Most recently, Cleland et al. (Citation2019) provide a comparison of perceptual and ultrasound-aided transcriptions and proposed a description of compensatory errors based on Gibbon (Citation2004). The current study both replicates and extends some of the findings by both Bressmann et al. (Citation2011), Cleland et al. (Citation2019), and Bressmann et al. (Citation2011) described midpalatal stops, which are commonly identified in the EPG literature as middorsal palatal stops (Gibbon, Citation2004), or retraction in Cleland et al. (Citation2019). These were also seen in our data, however we identified them in both phonetic transcriptions and ultrasound data and they were therefore perceptible, rather than covert. Pharyngeal stops were identified in Bressmann et al. (Citation2011) and Cleland et al. (Citation2019) but not in the current study. However, with tongue root retraction for /n/ evident in Andrew’s data, it is uncertain whether this is in the uvular or pharyngeal region.
Limitations
While the measurements performed were promising in confirming and identifying important diagnostic information our findings are limited by the case-study approach and should be extended to a larger group of children, including those with other cleft types. It would also be useful to apply the measures to other types of SSD, for example, childhood apraxia of speech. From a diagnostic point of view, the ultrasound analysis provided crucial information, such as whether covert contrasts were present. While it is clear from a qualitative inspection of the images in that there were phonetic similarities and phonological place differences in Andrew’s tongue-shapes from session to session, these were only revealed by the analysis of high quality recorded data. Moreover, statistical analysis and quantitative measures, which will be key for identifying subtle differences between tongue-shapes, also require the use of specialist recording and analysis software in addition to ultrasound scanners.
Due to the time-consuming nature of the task at that time the interventions were undertaken (2013–2014), both types of analysis were carried out after therapy. Clearly the averaged tongue shapes would have been useful for informing the therapy plan, had they been available more quickly. Even relatively clear differences later uncovered were not easily detected during the impressionistic viewing of live, real-time raw ultrasound images (Cleland et al., Citation2019). Quantitative or spatial analysis of recorded data is therefore advisable in all cases and is likely to be a necessity for identifying subtle errors. Clinically, such analysis requires additional preparation, recording and analysis time. Such factors could make ultrasound a time-consuming and potentially costly tool. Although the current study used semi-automatic tracking, some manual tracking was still required. There is therefore a need for fully automatic tracking of tongue surfaces in ultrasound data for clinical applications, so that, paired with automatically annotated speech signals, synchronised ultrasound can be more readily available for clinicians as a quick, efficient and effective tool for assessment purposes.
Conclusions
This paper proposed articulatory measures for ultrasound analysis of speech data in speakers with CP. We discussed the benefits of including instrumental analysis in the assessment of speech characteristics associated with CP, providing information on covert contrast that are typically not identified through perceptual assessment alone. While compensatory error patterns found in speakers with CP are reportedly adopted to facilitate phonological development, the instrumental assessment here suggests that compensatory articulations in Andrew’s data, including covert contrasts, are in fact articulatory in nature. These findings suggest that instrumental analysis can be essential in assessment, diagnosis and intervention planning for children with CP.
Declaration statement
No potential competing interest was reported by the authors.
Acknowledgments
The authors would like to thank the university for providing a PhD Bursary to support this study, the NHS clinicians for supporting recruitment and the participants for taking part in the study.
Correction Statement
This article has been corrected with minor changes. These changes do not impact the academic content of the article.
Additional information
Funding
References
- Apple. (2012). The new iPad. Retrieved March 16, 2012 from http://store.apple.com/uk/browse/home/shop_ipad/family/ipad
- Articulate Instruments Ltd. (2012). Articulate assistant advanced user guide: Version 2.14.
- Articulate Instruments Ltd. (2015). Articulate assistant advanced user guide: Version 2.16.
- Ball, M. J., Howard, S. J., & Miller, K. (2018). Revisions to the extIPA chart. Journal of the International Phonetic Association, 48(2), 155–164. https://doi.org/https://doi.org/10.1017/S0025100317000147
- Boyce, J. O., Kilpatrick, N., & Morgan, A. T. (2018). Speech and language characteristics in individuals with nonsyndromic submucous cleft palate—A systematic review. Child: Care, Health and Development, 2018(44), 818–831. https://doi.org/https://doi.org/10.1111/cch.12613
- Bressmann, T., Radovanovic, B., Kulkarni, G. V., Klaiman, P., & Fisher, D. (2011). An ultrasonographic investigation of cleft-type compensatory articulations of voiceless velar stops. Clinical Linguistics & Phonetics, 25(11–12), 1028–1033. https://doi.org/https://doi.org/10.3109/02699206.2011.599472
- Cleland, J. (2021). Ultrasound tongue imaging. In M. J. Ball (Ed.), Manual of clinical phonetics (1st ed) (pp. 399–416). Routledge.
- Cleland, J., Lloyd, S., Campbell, L., Crampin, L., Palo, J.-P., Sugden, E., Wrench, A., & Zharkova, N. (2019). The impact of real-time articulatory information on phonetic transcription: Ultrasound-aided transcription in cleft lip and palate speech. Folia Phoniatrica Et Logopaedica, 72(2), 120–130. https://doi.org/https://doi.org/10.1159/000499753
- Cleland., J., & Scobbie, J. M. (2021). The dorsal differentiation of velar from alveolar stops in typically developing children and children with persistent velar fronting. Journal of Speech Language and Hearing Research, 64(6S), 2347–2362. https://doi.org/https://doi.org/10.1044/2020_JSLHR-20-00373
- Cleland, J., Scobbie, J. M., Heyde, C. J., Roxburgh, Z., & Wrench, A. A. (2017). Covert contrast and covert errors in persistent velar fronting. Clinical Linguistics & Phonetics, 31(1), 35–55. https://doi.org/https://doi.org/10.1080/02699206.2016.1209788
- Cleland, J., Scobbie, J. M., & Wrench, A. A. (2015b). Using ultrasound visual biofeedback to treat persistent primary speech sound disorders. Clinical Linguistics & Phonetics, 29(8–10), 575–597. https://doi.org/https://doi.org/10.3109/02699206.2015.1016188
- Dodd, B., Hua, Z., Crosbie, S., Holm, A., & Ozanne, A. (2002). Diagnostic evaluation of articulation and phonology. The Psychological Corporation.
- Gibbon, F. E. (1999). Undifferentiated lingual gestures in children with articulation/phonological disorders. Journal of Speech, Language, and Hearing Research, 42(2), 382–397. https://doi.org/https://doi.org/10.1044/jslhr.4202.382
- Gibbon, F. E. (2004). Abnormal patterns of tongue-palate contact in the speech of individuals with cleft palate. Clinical Linguistics & Phonetics, 18(4–5), 285–311. https://doi.org/https://doi.org/10.1080/02699200410001663362
- Gibbon, F. E., & Crampin, L. (2001). An electropalatographic investigation of middorsum palatal stops in an adult with repaired cleft palate. The Cleft Palate-Craniofacial Journal, 38(2), 96–105. https://doi.org/https://doi.org/10.1597/1545-1569_2001_038_0096_aeiomp_2.0.co_2
- Gibbon, F. E., Ellis, L., & Crampin, L. (2004). Articulatory placement for t, d, k and g targets in school age children with speech disorders associated with cleft palate. Clinical Linguistics & Phonetics, 18(6–8), 391–404. https://doi.org/https://doi.org/10.1080/02699200410001703691
- Hardcastle, W. J., & Gibbon, F. (2005). Electropalatography as a research and clinical tool. 30 Years on. In W. J. Hardcastle & J. M. Beck (Eds.), A figure of speech: A festschrift for John Laver (pp. 39–62). Routledge.
- Harding, A., & Grunwell, P. (1996). Characteristics of cleft palate speech. European Journal of Disorders of Communication: The Journal of the College of Speech and Language Therapists, London, 31(4), 331–357. https://doi.org/https://doi.org/10.3109/13682829609031326
- Harding, A., & Grunwell, P. (1998). Active versus passive cleft-type speech characteristics. International Journal of Language & Communication Disorders, 33(3), 329–352. https://doi.org/https://doi.org/10.1080/136828298247776
- Hewlett, N. (1988). Acoustic properties of /k/ and /t/ in normal and phonologically disordered speech. Clinical Linguistics & Phonetics, 2(1), 29–45. https://doi.org/https://doi.org/10.3109/02699208808985242
- Heyne, M., & Derrick, D. (2015). Using a radial ultrasound probe’s virtual origin to compute midsagittal smoothing splines in polar coordinates”. Journal of the Acoustical Society of America, 138(6), 509–514. https://doi.org/https://doi.org/10.1121/1.4937168
- Howard, S. (2004). Compensatory articulatory behaviours in adolescents with cleft palate: Comparing the perceptual and instrumental evidence. Clinical Linguistics & Phonetics, 18(4–5), 313–340. https://doi.org/https://doi.org/10.1080/02699200410001701314
- Howard, S. (2011). Phonetic transcription for speech related to cleft palate. In S. Howard & A. Lohmander (Eds.), Cleft palate speech: Assessment and intervention (pp. 127–144). Wiley-Blackwell.
- International Phonetics Association (IPA). (1999). Handbook of the international phonetic association. Cambridge University Press.
- Lee, A. (2021). Electropalatography. In M. J. Ball (Ed.), Manual of clinical phonetics(pp. 339–353). Routledge.
- Munson, B., Schellinger, S. K., & Carlson, K. U. (2012). Measuring speech-sound learning using visual analog scaling. Sig 1 Perspectives On Language Learning And Education, 19(1), 19–30. https://doi.org/https://doi.org/10.1044/lle19.1.19
- Preston, J., McCabe, P., Rivera-Campos, A., Whittle, J., Landry, E., & Maas, E. (2014). Ultrasound visual feedback treatment and practice variability for residual speech sound errors. Journal of Speech Language and Hearing Research, 57(6), 2102–2115. https://doi.org/https://doi.org/10.1044/2014_JSLHR-S-14-0031
- Rahimov, F., Jugessur, A., & Murray, J. C. (2012). Genetics of nonsyndromic orofacial clefts. The Cleft Palate-Craniofacial Journal, 49(1), 73–91. https://doi.org/https://doi.org/10.1597/10-178
- Roxburgh, Z. (2018). Visualising articulation: Real-time ultrasound visual biofeedback and visual articulatory models and their use in treating speech sound disorders associated with submucous cleft palate [PhD Thesis]. Queen Margaret University.
- Roxburgh, Z., Cleland, J., & Scobbie, J. M. (2016). Multiple phonetically trained-listener comparisons of speech before and after articulatory intervention in two children with repaired submucous cleft palate. Clinical Linguistics & Phonetics, 30(3–5), 398–415. https://doi.org/https://doi.org/10.3109/02699206.2015.1135477
- Sell, D. (2005). Issues in perceptual speech analysis in cleft palate and related disorders: A review. International Journal of Language & Communication Disorders, 40(2), 103–121. https://doi.org/https://doi.org/10.1080/13682820400016522
- Smarty Ears. (2011). Speech trainer 3D. Retrieved November 1, 2011, from http://smartyearsapps.com
- Sugden, E., Lloyd, S., Lam, J., & Cleland, J. (2019). Systematic review of ultrasound visual biofeedback in intervention for speech sound disorders. International Journal of Language and Communication Disorders, 54(5), 705–728. https://doi.org/https://doi.org/10.1111/1460-6984.12478
Appendix A.
Andrew’s DEAP phonology error pattern analysis, separating non-cleft processes and atypical processes more commonly associated with CP.
Table
Appendix B.
Untreated /n/ wordlist organised into word positions, vowel environments, clusters and sentences. Brackets indicate the number of tokens of /n/ in each environment.
Appendix C.
Additional alveolar wordlist, containing treated minimal pairs (in bold).
Table