
 ?Mathematical formulae have been encoded as MathML and are displayed in this HTML version using MathJax in order to improve their display. Uncheck the box to turn MathJax off. This feature requires Javascript. Click on a formula to zoom.
ABSTRACT
This study aims to reveal dynamic changes in prosodic prominence patterns associated with Parkinson’s disease (PD). To fulfill this purpose, the study proposes an exploratory methodology involving measuring a novel syllable-based prosody index (SPI) and performing functional principal component analyses (fPCAs) in a semi-automatic manner. First, SPI trajectories were collected from 31 speakers with PD before and after speech therapy and from 36 healthy controls. Then, the SPI trajectories were converted to continuous functions using B-splines. Finally, the functional SPIs were examined using fPCAs. The results showed that PD was associated with an increase of overall prominence for male speakers. The findings regarding higher prominence patterns in PD were supported by traditional phonetic measurements. For female speakers, however, there were no significant differences in prosodic prominence between speakers with PD and healthy controls. The results encourage to explore the proposed methodology also in analyses of other forms of atypical speech.
Introduction
Specific changes in speech prosody, such as reduced pitch range and atypical variation in rhythm, can be related to speech disorders of neurologic origin (Hawthorne & Fischer, Citation2020; Patel, Citation2002). One of the most studied neurodegenerative diseases in clinical speech research has been Parkinson’s disease, which is known to cause various prosodic changes, or even speech prosody impairment, i.e. dysprosody (Harris et al., Citation2016; Jones, Citation2009; Ramig et al., Citation1995, Citation2008). Parkinson’s disease (PD) is a neurodegenerative disorder classified by the loss of dopamine within structures in the basal ganglia (Moore et al., Citation2005). Typical motor symptoms include tremor, bradykinesia, and rigidity, but cognitive changes and social symptoms have also been described (Prenger et al., Citation2020).
Previous phonetic studies have shown that PD patients have atypical pitch and rhythmic characteristics compared to control speakers (Basirat et al., Citation2018; Lowit et al., Citation2018; Ma et al., Citation2010). However, previous studies have mainly analysed prosodic changes in PD via conventional statistics, e.g. mean and standard deviation, which lack information about the dynamics of prosodic variation within an analysed speech segment. Even though prosodic prominence patterns have an impact on naturalness and intelligibility of speech (Thies et al., Citation2020), to our knowledge, few studies have investigated their changes in PD.
In this pilot study, we propose functional data analysis (FDA) as an extension for conventional statistical methods to capture the true dynamic nature of prosodic prominence related to PD. FDA includes a set of statistical methods, which are functional versions of their conventional counterparts (Ramsay et al., Citation2009). In FDA, discrete values are first converted to continuous functions and then analysed using a functional method. One of the most popular FDA methods has been functional principal component analysis (fPCA). Furthermore, FDA offers a robust framework for time series data because it allows analysis of dynamic changes in time series in addition to traditional statistics. For phonetic data, which is fundamentally dynamic, FDA and particularly fPCA have already been shown to be an effective alternative to traditional statistics (Cronenberg et al., Citation2020; Gubian et al., Citation2009, Citation2011, Citation2015; Zellers et al., Citation2010).
In addition to the FDA, this study will address the applicability of the syllabic prosody index (Tavi & Werner, Citation2020), a measure for prosodic prominence, in the analysis of atypical speech. Because the syllabic prosody index (SPI) combines a syllable’s pitch, duration, and energy features into a single value, smoothed SPI trajectories can be used to model the long-term dynamics of prosodic prominence for long speech segments.
This study is structured as follows: The effects of PD on speech and hypotheses of the study are introduced in Section 2. The speech materials, phonetic measurements, and FDA techniques are presented in Section 3. Finally, the findings are shown in Section 4 and discussed in Sections 5 and 6.
Parkinson’s disease and speech
Approximately 90% of individuals diagnosed with PD experience some changes in their communication abilities, commonly diagnosed as hypokinetic dysarthria (Logemann et al., Citation1978; Miller et al., Citation2007; Ramig et al., Citation2018; Spielman et al., Citation2011). Hypokinetic dysarthria is a motor speech disorder characterised primarily by harsh and breath voice quality, imprecise articulation, and dysprosody (prosodic loss) (Ramig et al., Citation2018; Schalling et al., Citation2017;). For example, people with PD (PWPD) tend to produce less effective intonation cues compared to controls (e.g. Basirat et al., Citation2018; Ma et al., Citation2010) and suffer from rhythmic disturbances while producing sentences (e.g. Lowit et al., Citation2018). Speech of PWPD is often described as monotonous and non-emotional (Prenger et al., Citation2020; Schröder et al., Citation2010). Additionally, PWPD has difficulty identifying the emotional prosody of others’ speech (Cheang & Pell, Citation2007; Mitchell & Bouças, Citation2009).
Prosodic impairment has been observed in several motor speech disorders like in apraxia of speech and dysarthria (Hawthorne & Fischer, Citation2020). Darley, Aronson, and Brown (as cited in Duffy, Citation2005, p. 196) have listed the most deviant (prosodic) speech dimensions associated with hypokinetic dysarthria in order of severity: (1) monopitch (most severe), (2) reduced stress and (3) monoloudness. The monotonous speech in PWPD is characterised by reduced f0 variation and range, compared to healthy control speakers (Rusz et al., Citation2011; Skodda et al., Citation2009).
In hypokinetic dysarthria, the abnormalities in speech rhythm manifest as slow speech rate with rapid short rushes, disfluencies and inappropriate silences (Bunton & Keintz, Citation2008). Compared to healthy speakers, PWPD has exhibited longer short silent intervals, possibly reflecting a delay in the fluent segment-to-segment transition between words (Whitfield & Gravelin, Citation2019), and decreased contrasts between unstressed and stressed syllables (Ma et al., Citation2015). In addition, Liss et al. (Citation2009) studied rhythm patterns between different types of dysarthric speech and found that the rhythmic variation was decreased in PWPD, amyotrophic lateral sclerosis, and ataxic dysarthria.
Prosodic marking involves dynamic changes in the glottal, subglottal and supraglottal systems. Dysregulation in prosodic production due to Parkinson’s disease, especially problems producing prosodic prominence, decreases the naturalness and intelligibility of speech (Thies et al., Citation2020). By adjusting prosodic prominence, speaker can highlight information within an utterance and, for example, distinguish statement from question (Thies et al., Citation2018, Citation2020). However, PWPD may use an excessive amount of effort in the glottal and subglottal system and less effort in the supraglottal system leading to inappropriate prominence marking (Thies et al., Citation2019). In addition, PWPD overuse f0 and intensity in prominent positions (Thies et al., Citation2020), which may also reflect abnormalities in the regulatory mechanism for expressing prosodic prominence.
Communication changes in PWPD are treated with different forms of speech therapy (Duffy, Citation2005, p. 465). The most studied speech therapy method for PWPD is the Lee Silverman Voice Treatment (LSVT LOUD) (Ramig et al., Citation2018), which focuses on loud voice production. In addition, singing as a form of speech therapy has been shown to impact positively respiratory health and swallowing function in a healthy older population (Segall, Citation2017). Studies have noted that singing improves sound level pressure (Butala et al., Citation2022; Haneishi, Citation2001; Paronen & Vuomajoki, Citation2019; Tamplin et al., Citation2020; Yinger & Lapointe, Citation2012), f0 and f0 variation (Tanner et al., Citation2016), and maximal phonation time (Han et al., Citation2018; Shih et al., Citation2012). In general, speech therapies are more effective when started in the early stages of PD (Holmes et al., Citation2000).
In Hawthorne and Fischer (Citation2020) study, speech therapists (N = 245) reported that dysprosody is a highly common symptom in several speech disorders. Still, they rarely assess prosody with formal methods, like with acoustic-phonetic analysis. Although prosodic analyses are already utilised to detect neurodegenerative diseases in academic research (e.g. Bocklet et al., Citation2011; Kato et al., Citation2018; Khodabakhsh et al., Citation2015), there is a need to develop impactful clinical tools for assessment to support clinical practice.
This pilot study demonstrates a functional approach for analysing prosodic prominence in PD via the following hypotheses: (1) PD is associated with dynamic changes in prosodic prominence and (2) the changes can be influenced by speech therapy. The possible prosodic changes related to PD are expected to increase overall speech prominence and to decrease variability of prominence patterns, reflecting the aforementioned effects of PD on speech production. Speech therapy, on the other hand, can strengthen prominence patterns, which may have become overly steady due to PD. The proposed prosodic analyses are performed semi-automatically to improve their applicability in clinical practice.
Materials and methods
Speech data
In this pilot study, we used two speech corpora collected by the ‘Kuuluva Ääni – To be heard’ project: Parkinson’s Disease Speech corpus of Tampere (PDSTU) and Healthy Adults Speech corpus of Tampere (HASTU) (Liu et al., Citation2021; To be heard, Citation2018). The first corpus, PDSTU, includes dysarthric speech data from both Finnish (n = 35) and Finland Swedish (n = 7) speaking adults with PD. Participants with PD were recruited via speech therapists and the Finnish Parkinson Association. The inclusion criterion for participants in ‘Kuuluva Ääni – To be heard’ project was a diagnosis of idiopathic Parkinson’s disease. The exclusion criteria were Deep Brain Stimulation (DBS) treatment, dementia and communication disorders preceding the PD diagnosis (namely dysphonia, stuttering, aphasia, dysarthria and apraxia of speech). PDSTU includes speech data from different speaking tasks: word and sentence repetitions, regular and emotional reading tasks, spontaneous speech task and diadochokinesia test before and after group speech therapy. Seventeen individuals from PDSTU received singing-based speech therapy carried out by two speech therapists and one music educator. This group intervention consisted of a 90-minute session once a week for eight weeks. The sessions were designed to target increased vocal loudness and kinaesthetic awareness (motor learning/muscle memory) through singing exercises with a low cognitive load. Twenty-five individuals from PDSTU received LSVT-based speech therapy. This group intervention consisted of a 90-minute session twice a week for four weeks. The sessions were designed to increase vocal loudness and recalibrate sensory feedback through speech exercises and visual feedback. A speech therapist carried out the intervention.
The second corpus, HASTU, contains speech data from healthy Finnish-speaking adults (n = 38). Healthy controls were recruited based on convenience sampling throughout Finland. Primary inclusion criteria were Finnish language as the mother tongue, age of 18 years or more and a self-reported absence of developmental or acquired communication disorders, learning disability, hearing loss or neurodegenerative diseases. HASTU includes the same speech tasks used in PDSTU. Both PDSTU and HASTU datasets include participants’ background information and different self-rated measures for voice and speech.
We chose those native Finnish PDSTU-speakers, whose speech data contained both pre and post recordings (n = 35-4 = 31) (see ). Those recordings were collected within 1–4 hours of the last levodopa dose, in so-called ‘ON-stage’. From HASTU, we chose speakers who had determined their gender, either male or female, because the analyses were gender-dependent (n = 38-1 = 37).
Table 1. Information of participants. Columns group ID, condition, and gender present abbreviations for each speaker group, whether they belong to the PD or the control group and the gender, respectively. N and BY show the number of participants in the groups and their mean birthyear. VHI-9 (before/after speech therapy) and HY present mean short-scale voice handicap index-9 and Hoehn and Yahr scale.
A speech sample from the regular reading task ‘The Northwind and the Sun’, which has been commonly used in clinical and research settings in Finland (Kankare et al., Citation2020), was selected for both speaker groups. This speech sample was recorded in a quiet room using a headset microphone, which was kept 4 cm from the corner of the speaker’s mouth at a 45-degree angle. Recordings were made at a sampling rate of 44.1 kHz in WAV (Waveform Audio File) format, through Praat software (Boersma & Weenink, Citation2018) and Focusrite audio interface.
In addition to general information (i.e. gender and the birthyear), shows Hoehn & Yahr disease severity ratings (Rabey & Korczyn, Citation1995) and self-ratings from Voice Handicap Index-9 (VHI-9; Nawka et al., Citation2009). VHI-9 is a 9-item questionnaire where scores range from 0 to 36, with higher values indicating a more severe voice-related handicap (Nawka et al., Citation2009). The Hoehn and Yahr scale is a measure to assess the progression of disease stage in PD (Rabey & Korczyn, Citation1995). This scale consists of seven stages from 1 to 5; the larger the value, the more severe the disorder. Because the PD groups received speech therapy during the Kuuluva Ääni project, VHI-9 was collected before and after the therapy.
Permission to conduct the present study on PDSTU and HASTU was obtained from the Ethics Committee of Tampere University. All subjects provided written informed consent according to the Declaration of Helsinki.
Syllabic prosody index
To investigate the dynamics of prosodic prominence in PD, speech prosody was quantified using the syllabic prosody index (SPI). The SPI is a novel measure for prosodic prominence, which is based on common phonetic measurements (Tavi & Werner, Citation2020). Equation 1 shows how the SPI measures the amount of prominence by combining median pitch, relative energy proportion below 1 kHz (in a frequency range of 0–4 kHz) and duration in syllables into one index:
Equation 1. Syllabic prosody index (SPI).
Phonetically prominence, or linguistic emphasis, is characterised as changes in pitch, duration and energy (Streefkerk, Citation1997). SPI increases when f0 and duration increase and energy proportion below 1 kHz decreases, i.e. the relative acoustic energy in a spectrum shifts towards higher speech frequencies.
Although the SPI is a novel measure for dysarthric speech analysis, we utilised the SPI in this study because it (1) combines well-known phonetic measures into single prominence index and (2) analysing SPI trajectories can reveal more information about (dys)prosodic patterns than analysing the phonetic measures separately. SPI trajectories were measured from syllables of ‘The North Wind and the Sun’ passage spoken by the participants. We performed the measurements using Praat. To avoid manual syllable segmentation, we used the Vocal toolkit (Corretge, Citation2020), which adapts a script from De Jong and Wempe (Citation2009) to produce markings for syllabic units automatically. Even though automatic syllable segmentation is less accurate compared to professional manual segmentation (hence the term syllabic unit), we chose to apply the automatic approach due to the fact that producing professional manual segmentations is usually too time-consuming especially for clinical research. Furthermore, the focus of this study was on long-term dynamics of prosodic prominence rather than high-frequency prominence variation in adjacent syllables. The algorithm from De Jong and Wempe (Citation2009) was chosen because it does not require training data and is not language dependent.
Functional data analysis
B-splines
The first step in FDA is to transform discrete data values to continuous functions, or curves, using some basis function system. For non-periodic signals, such as f0 trajectories, basis (B) splines are conventionally chosen (Gubian et al., Citation2015). When modelling a trajectory of data points using B-splines, the trajectory is divided into sub-intervals, which each contains a spline or polynomial function of fixed degree (Ramsay et al., Citation2009). One benefit in the construction of spline systems is the control of the smoothness of the final curves. shows an example of a functional SPI (fSPI) curve along with discrete SPI values. The logarithmic transformation was performed on the original SPI values as the logarithmic scale better corresponds to human speech perception.
Figure 1. A fSPI curve of a healthy female speaker. Scalar SPI values (dots) correspond to syllabic units in ‘The North Wind and the Sun’ passage.
We carried out all the steps of FDAs using the R (R Core Team, Citation2020) package FDA (Ramsay et al., Citation2020). Also, other statistical analyses were performed in R. To build appropriately smoothed curves, we tested different parameters for the spline basis functions and inspected the resulting curves visually. Finally, the order was set to four and the number of the basis functions to 152. Lambda parameter, which controls the amount of smoothness, was set to 0.01. Because minor pronunciation errors occurred in some of the readings and the number of syllabic units produced by the automatic segmentation varied slightly, the lengths of the fSPI curves were normalised.
Functional principal component analysis
Like traditional principal component analysis (PCA), functional PCA is used to investigate primary modes of variation in data. However, in functional cases, eigenvalues have corresponding eigenfunctions, or functional principal components, instead of eigenvectors (Ramsay et al., Citation2009). Both methods can be used for dimension reduction and to reconstruct data. In this study, fSPI curves are modelled as
Equation 2. Approximation of a function f(t) using functional PCA.
where the fSPI curve f(t) is approximated as the sum of a mean fSPI curve µ(t), a number of n principal component curves PCi(t) and their weights si. The more PCs and their weights are used, the more similar the reconstructed curve is to the original curve. Because these weights can be utilised to describe, or scalarize, the shape of the original curves, fPCA has been considered a ‘shape-to-number converter’ (Gubian et al., Citation2015).
Results
Phonetic analyses
A total of four prominence-related prosodic features were extracted from automatically segmented syllabic units: median f0, duration (s), energy proportion below 1 kHz and the SPI. Both male (PM) and female (PF) speakers with PD were divided into two groups depending on whether ‘The North Wind and The Sun’ passages were recorded before (PMb/PFb) or after the therapy (PMt/PFt). Although 16 speakers received singing-based and 15 speakers LSVT-based therapy, they were combined into same gender-dependent groups due to small sample sizes. present the mean prosodic values.
Table 2. Mean values of the four prosodic features (male speakers).
Table 3. Mean values of the four prosodic features (female speakers).
There was a moderate increase in f0, duration, energy proportion below 1 kHz and the SPI after speech therapy for all PD groups. The differences in the prominence-related features between PFs and control females (CF) were quite small. For PMs, f0 and duration were higher than those of control males (CM) indicating higher mean prominence. The only exception was greater energy proportion below 1 kHz since usually energy concentrates more at the higher frequencies in prominent syllables (Van Kuijk & Boves, Citation1999).
When f0 and duration do not change, harsh or breathy syllabic units will have slightly lower SPI compared to modal (i.e. regular) syllabic units due to greater spectral tilt. However, based on the mean values of the other prominence features, especially PD-male speakers’ SPI trajectories are expected to be higher compared to those of control male speakers. In addition, speech therapy seems to have an increasing effect on prominence within the PD groups.
fPC scores
shows the mean fSPIs of the control (CM/CF) and of the PD groups before and after the therapy (PMb/PFb and PMt/PFt). The top panel in reveals that the mean fSPI curves of the three male groups are located and shaped differently. The mean curve of CM is below the mean curves of PMb and PMt, and the PMt curve has more prominent peaks than the PMb curve. These observations suggest that both PD and receiving speech therapy affect the fSPI for male speakers. However, the differences are less clear between the female PD and control groups since the mean curves are located close to each other, although PFt seems to have a few more peaks prominent peaks than PFb or CF.
Figure 2. Male and female groups’ mean fSpis.
fPCA was carried out to examine the variation in the fSPI curves related to PD and speech therapy. demonstrates the effects of the first two fPCs on the mean fSPI curves. The first two PC functions for male speakers are shown on the left, while the first two PC functions for female speakers are shown on the right: The first PC explains 38.6% of fSPI variation in male speech, while for female speech, it explains 20.3%. For the second PC, (rounded) percentages for explained variation are 5% for both genders. Because the remaining (>2) PCs explain only less than 5% of fSPI variation and are most likely related to minor inter-speaker differences in irregular prominence peaks, following analyses will focus on the first two PCs.
Figure 3. Male and female speakers’ fSpis. The first two PC functions for male (left) and female (right) speakers’ fSpis. The solid lines are the mean fSPI curves. The dash and dot curves are obtained by multiplying PCi function by the standard deviation of PCi score, which is then added to (dashes) or subtracted (dots) from the mean curve.
As described in Equation 2, fPCA models input curves in terms of mean curve and PCs, which serve as shape modifiers. Each input curve is associated with a PC score (si) that determines the weight of the modification. In , the standard deviation of s1 and s2 are multiplied with PCs and either added to or subtracted from the mean curve (solid lines), resulting in dash and dot curves. In top panels, the dash and dot curves demonstrate how the first PC and the s1 modify the height rather than the shape of both female and male speakers’ fSPIs: higher scores for the first PC increase the height, while lower scores lower the curves. The shape of the fSPI curves is more related to the second PC and the s2, which, however, modify the shape somewhat differently for male and female speech. For example, higher s2 amplifies prominence peaks in the male speakers’ mean curve located around thirtieth, seventieth and ninetieth syllabic units.
presents each speaker plotted in two-dimensional PC score (i.e. s1–s2) spaces. Male (above) and female (below) speakers’ PC score spaces are presented separately. Speakers in the control groups are indicated by a green c, and speakers with PD are indicated by a red b or blue t depending on whether the speaker has received therapy. Additionally, each speaker’s ID is marked below the letters mentioned above.
Figure 4. Male and female PC score spaces. The s1 and s2 values of each speaker are located at the x-axis and y-axis, respectively. The panels show each speaker’s group marked using b, t, or c and individual ID, located below the group identifier.
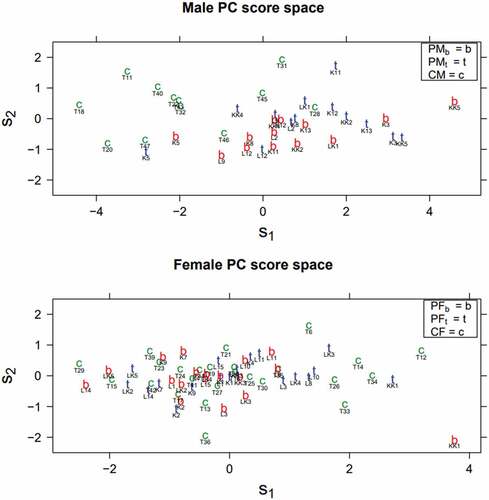
Female speakers’ PC score space is somewhat scattered and lacks consistent clusters of control speakers or speakers with PD (PFb or PFt). In male PC score space, speakers in control and PD groups are more clustered: the control speakers are mainly at the upper left side of the PC score space, and the speakers with PD are mainly located at the lower right side. In addition, the speakers with PD are primarily located at the top – right or bottom – right depending on whether they have received therapy. As mentioned above, higher s1 (the right side) indicates higher overall prominence and higher s2 (the upper side) is associated with specific amplified prominence peaks.
To test whether the differences in PC scores between the groups are statistically significant, traditional one-way ANOVAs were carried out. Due to small sample sizes and the lack of consistent clusters for the singing-based and LSVT-based therapy groups in the PC score spaces (see ), the therapy groups were combined into same gender-dependent groups. The results gathered in confirm previous observations that there are significant differences between the male groups in the s1 and the s2.
Table 4. Results from traditional one-way ANOVAs. Statistically significant p-values (<0.05) are marked using bold type.
Post hoc tests, performed using Tukey’s ‘Honest Significant Difference’ method, revealed statistically significant differences (p<0.05) in s1 between CM and PMt and CM and PMb (see ). In addition, there was a statistically significant difference in s2 between CM and PMb. Therefore, the post-analyses of the PC scores conclude that PD is associated with the increase of prosodic prominence. Although there was no significant difference between PMt and PMb in s2 (or s1), the fact that difference in s2 was statistically before (i.e. between CM and PMb) but not after (i.e. between CM and PMt) speech therapy suggests the received therapy had some influence on prominence patterns.
Table 5. TukeyHSD for the male groups’ s1 and s2. Statistically significant p-values (<0.05) are marked using bold type.
As mentioned in Section 3.3.2, fPCA can be used for dimension reduction, but also to reconstruct original data. shows an example of a healthy speaker’s original and reconstructed fSPIs. The reconstructed curves were built using Equation 2. We chose to use the first 13 PCs and their scores in the reconstruction, because the remaining PCs each explain only less than 2% of fSPI variation. The reconstructed fSPI curve using 13 PCs captures variation of original prominence relatively well, although some sharp peaks have been slightly reduced (see top panel).
Figure 5. A control speaker’s original (top panel), reconstructed original (top and bottom), and reconstructed PD (bottom) fSPI curve.
To demonstrate the plausible effect of PD on prosodic prominence using the s1 and the s2, we also reconstructed the same fSPI curve using mean s1 and mean s2 values calculated from PMb instead of the control speaker’s original s1 and s2 values. Otherwise, PCs and the remaining scores were kept the same as with the previously reconstructed curve. The bottom panel in shows how replacing the first two PC scores of the control speaker with the mean PC scores of PMb resulted in a higher prominence pattern, demonstrating the effect of PD on prosody.
Discussion
This study presented an exploratory methodology for examining atypical prosody related to PD. The methodology consists of automated SPI measurements, and functional data analyses performed using Praat and R-scripts. The results are presented as visualised functions instead of only static values; the advantage of the visualised functional results is the access to the dynamics of the measured speech feature, which is lacking from conventional statistics. Therefore, the proposed methodology offers a straightforward and more comprehensive tool for assessment of prominence patterns compared to those traditional approaches, where mean values of various prosodic measures are tested statistically. On the other hand, a potential limitation for the functional approach is the fact that it requires understanding of rather advanced statistical techniques.
The functional visualisations showed that PD-male speakers had a higher mean fSPI compared to that of the control group. In addition, PD-male speakers had a more prominent fSPI after speech therapy especially at the middle part of the curve. The fPCAs, which were used to quantify the dynamic changes in the fSPIs, indicated similar findings, but post-hoc analyses of the PC scores supported only the former observation. For the female groups, no significant differences in prominence patterns were found in this study.
There are several plausible reasons why the prosodic differences between the male PD- and control groups were greater than the differences between the female PD- and control groups. First, the self-rated voice handicap (VHI-9) was more severe in males (14.85/10.62) than females (10.83/8.56), although the H&Y -severity ratings for males (1.77) were slightly lower compared to females (1.86). Second, it is known that male and female PD patients differ as females have more tremor-dominant PD and males have more rigid-dominant disease (Georgiev et al., Citation2017). This rigidity in speech muscles can decrease the contrasts between stressed and unstressed syllables (Ma et al., Citation2015), possibly seen as differences in the fSPIs between PD males and controls. However, as the PDSTU-corpus didn’t provide information of dominance between rigidity or tremor in speakers, this explanation should be observed carefully. Furthermore, it cannot be excluded that also age partly affects the SPI; the fact that numerous studies have reported an increase of f0 for older healthy men (Torre & Barlow, Citation2009), and the fact that f0 has an impact on the SPI, indicate that also the SPI can increase while ageing.
Overall, the proposed methods have revealed the effects of PD on prosodic prominence: even though prosodic prominence increases possibly due to the use of excessive amount of effort in the glottal and subglottal system, prosodic patterns can be less prominent due to insufficient effort in the supraglottal system in PWPD (Thies et al., Citation2019). Nevertheless, the effort in supraglottal system may be improved due to speech therapy resulting in stronger prominence patterns.
The limitations of the study include the relatively small group sizes and a number of recording sessions. Due to the small group sizes, statistical analyses of the effects of covariates (see ) on fSPIs were excluded from this study. For instance, it should be noted that the speakers with PD are older on average than the control speakers. Mixed effect models, for example, can be used for investigating the effects of covariates when more data is available. Additionally, because the speech samples were collected only at one time point, it would be beneficial to have more recording sessions and to calculate mean fSPIs for each speaker using several time points. The speaker-specific mean fSPI curves would better take natural intra-speaker variation into account. They could be analysed similarly as the one-time point measurements were analysed in this study.
Lastly, we believe that the strength of the proposed methodology is the fact that it combines these speech characteristics into one continuous feature. Therefore, the changes in prominence are visible during the whole selected speech segments and there is no need for analyses of numerous phonetic measures. The visual presentation of the results can also be useful for the patient, for example when discussing the effect of speech therapy on the patient’s performance. In addition, the approach is semi-automatic, so the acoustic analysis does not require time consuming manual annotations. However, one must remember that automatic syllable detection is not as accurate as manual syllable detection, so whenever possible, it would be good to utilise a hybrid model where the automatic segmentations are checked manually. Although the fSPIs reveal dynamic changes in prominence as stand-alone visualisations, overall prominence levels should always be compared to some type of baseline, and as in many other acoustic measurements, cautionary approach is recommended. In the future, the methodology has the potential to develop into a practical tool for clinical speech research and therapy. Before that, we aim to further explore and to apply the proposed methodology to other forms of atypical speech, such as autistic speech or stuttering and develop this methodology to more user-friendly direction.
Conclusions
The main focus of this study was on demonstrating the use of fSPIs as an exploratory methodology in the analysis of prosodic prominence in PD. In addition, an automatic approach to speech analysis was highlighted. Returning to the hypotheses mentioned in the Introduction, we consider them only partially confirmed. Based on the visible differences between the mean fSPIs and the results of the fPCAs, PD was associated with dynamic changes in prosodic prominence. However, the dynamic changes were significant only in male speech. Compared to the control groups, male-PD groups had higher overall prominence, but weaker prominence peaks. Receiving speech therapy was found to amplify prominence peaks in male speech, but changes in PC1 or PC2 scores were not statistically significant. Additionally, phonetic measurements indicated a moderate increase in prominence-related features after therapy.
Disclosure statement
No potential conflict of interest was reported by the authors.
Additional information
Funding
References
- Basirat, A., Patin, C., & Moreau, C. (2018). Relationship between perception and production of intonation of French in Parkinson’s disease. Proceedings of the 9th International Conference on Speech Prosody 2018, Poznań, Poland (pp.809–813). https://doi.org/10.21437/SpeechProsody.2018-163
- Bocklet, T., Nöth, E., Stemmer, G., Ruzickova, H., & Rusz, J. (2011). Detection of persons with Parkinson’s disease by acoustic, vocal, and prosodic analysis. 2011 IEEE Workshop on Automatic Speech Recognition Understanding, (pp. 478–483). https://doi.org/10.1109/ASRU.2011.6163978.
- Boersma, P., & Weenink, D. (2018). Praat: doing phonetics by computer [Computer program]. Version 6.0.43. https://praat.org
- Bunton, K., & Keintz, C. (2008). The use of a dual-task paradigm for assessing speech intelligibility in clients with Parkinsons disease. Journal of Medical Speech-Language Pathology, 16(3), 141–155. https://doi.org/10.1044/1058-0360(2007/027)
- Butala, A., Li, K., Swaminathan, A., Dunlop, S., Salnikova, Y., Ficek, B., Portnoff, B., Harper, M., Vernon, B., Turk, B., Mari, Z., & Pantelyat, A. (2022). Parkinsonics: A randomized, blinded, cross-over trial of group singing for motor and nonmotor symptoms in idiopathic parkinson’s disease. Parkinsons Disease, 20. https://doi.org/10.1155/2022/4233203
- Cheang, H., & Pell, M. (2007). An acoustic investigation of Parkinsonian speech in linguistic and emotional contexts. Journal of Neurolinguistics, 20(3), 221–241. https://doi.org/10.1016/j.jneuroling.2006.07.001
- Corretge, R. (2020). Praat Vocal Toolkit. http://www.praatvocaltoolkit.com.
- Cronenberg, J., Gubian, M., Harrington, J., & Ruch, H. (2020). A dynamic model of the change from pre-to post-aspiration in Andalusian Spanish. Journal of Phonetics, 83, 1–22. https://doi.org/10.1016/j.wocn.2020.101016
- De Jong, N., & Wempe, T. (2009). Praat script to detect syllable nuclei and measure speech rate automatically. Behavior Research Methods, 41(2), 385–390. https://doi.org/10.3758/BRM.41.2.385
- Duffy, J. (2005). Motor speech disorders: Substrates, differential diagnosis, and management (2nd ed). Elsevier Mosby.
- Georgiev, D., Hamberg, K., Hariz, M., Forsgren, L., & Hariz, G. M. (2017). Gender differences in Parkinson’s disease: A clinical perspective. Acta neurologica Scandinavica, 136(6), 570–584. https://doi.org/10.1111/ane.12796
- Gubian, M., Boves, L., & Cangemi, F. (2011). Joint analysis of f0 and speech rate with functional data analysis. 2011 IEEE International Conference on Acoustics, Speech and Signal Processing (ICASSP), Prague, Czech Republic, (pp. 4972–4975).
- Gubian, M., Torreira, F., & Boves, L. (2015). Using functional data analysis for investigating multidimensional dynamic phonetic contrasts. Journal of Phonetics, 49, 16–40. https://doi.org/10.1016/j.wocn.2014.10.001
- Gubian, M., Torreira, F. J., Strik, H., & Boves, L. W. (2009). Functional data analysis as a tool for analyzing speech dynamics: A case study on the French word c’était. Proceedings of Interspeech, Brighton, UK, (pp. 2199–2202).
- Haneishi, E. (2001). Effects of a music therapy voice protocol on speech intelligibility, vocal acoustic measures, and mood of individuals with Parkinson’s disease. Journal of Music Therapy, 38(4), 273–290. https://doi.org/10.1093/jmt/38.4.273
- Han, E. Y., Yun, J. Y., Chong, H. J., & Choi, K. G. (2018). Individual therapeutic singing program for vocal quality and depression in Parkinson’s disease. Journal of Movement Disorders, 11(3), 121. https://doi.org/10.14802/jmd.17078
- Harris, R., Leenders, K. L., & de Jong, B. M. (2016). Speech dysprosody but no music ‘dysprosody’ in Parkinson’s disease. Brain and Language, 163, 1–9. https://doi.org/10.1016/j.bandl.2016.08.008
- Hawthorne, K., & Fischer, S. (2020). Speech-language pathologists and prosody: Clinical practices and barriers. Journal of Communication Disorders, 87, 106024. https://doi.org/10.1016/j.jcomdis.2020.106024
- Holmes, R. J., Oates, J. M., Phyland, D. J., & Hughes, A. J. (2000). Voice characteristics in the progression of Parkinson’s disease. International Journal of Language & Communication Disorders, 35(3), 407–418. https://doi.org/10.1080/136828200410654
- Jones, H. N. (2009). Prosody in Parkinson’s disease. Perspectives on Neurophysiology and Neurogenic Speech and Language Disorders, 19(3), 77–82. https://doi.org/10.1044/nnsld19.3.77
- Kankare, E., Rantala, L., Ikävalko, T., Latoszek, B. V. B., & Laukkanen, A. -M. (2020). Akustisen äänenlaatuindeksin (AVQI) version 03.01 validointi suomenkielisille puhujille. Puhe Ja Kieli, 40(3), 165–182. https://doi.org/10.23997/pk.101516
- Kato, S., Homma, A., & Sakuma, T. (2018). Easy screening for mild Alzheimer’s disease and mild cognitive impairment from elderly speech. Current Alzheimer Research, 15(2), 104–110. https://doi.org/10.2174/1567205014666171120144343
- Khodabakhsh, A., Yesil, F., Guner, E., & Demiroglu, C. (2015). Evaluation of linguistic and prosodic features for detection of Alzheimer’s disease in Turkish conversational speech. EURASIP Journal on Audio, Speech, and Music Processing, 2015(1), 1–15. https://doi.org/10.1186/s13636-015-0052-y
- Liss, J., White, L., Mattys, S., Lansford, K., Lotto, A., Spitzer, S., & Caviness, J. (2009). Quantifying speech rhythm abnormalities in the dysarthrias. Journal of Speech, Language, and Hearing Research, 52(5), 1334–1352. https://doi.org/10.1044/1092-4388(2009/08-0208)
- Liu, Y., Penttilä, N., Ihalainen, T., Lintula, J., Convey, R., & Räsänen, O. (2021). Language-independent approach for automatic computation of vowel articulation features in dysarthric speech assessment. IEEE/ACM Transactions on Audio, Speech, and Language Processing, 29, 2228–2243. https://doi.org/10.1109/TASLP.2021.3090973
- Logemann, J., Fischer, H., Boshes, B., & Blonsky, R. (1978). Frequency and cooccurence of vocal tract dysfunctions in the speech of large sample of Parkinson patients. The Journal of Speech and Hearing Disorders, 43(1), 47–57. https://doi.org/10.1044/jshd.4301.47
- Lowit, A., Marchetti, A., Corson, S., & Kuschmann, A. (2018). Rhythmic performance in hypokinetic dysarthria: Relationship between reading, spontaneous speech and diadochokinetic tasks. Journal of Communication Disorders, 72, 26–39. https://doi.org/10.1016/j.jcomdis.2018.02.005
- Ma, J., Schneider, C., Hoffmann, R., & Storch, A. (2015). Speech prosody across stimulus types for individuals with Parkinson’s disease. Journal of Parkinsons Disease, 5(2), 291–299. https://doi.org/10.3233/JPD-140451
- Ma, J., Whitehill, T., & So, S. (2010). Intonation contrast in Cantonese speakers with hypokinetic dysarthria associated with Parkinson’s disease. Journal of Speech, Language, and Hearing Research, 53(4), 836–849. https://doi.org/10.1044/1092-4388(2009/08-0216)
- Miller, N., Allcock, L., Jones, D., Noble, E., Hildreth, A., & Burn, D. (2007). Prevalence and pattern of perceived intelligibility changes in Parkinson’s disease. Journal of Neurology, Neurosurgery & Psychiatry, 78(11), 1188–1190. https://doi.org/10.1136/jnnp.2006.110171
- Mitchell, R., & Bouças, S. (2009). Decoding emotional prosody in Parkinson’s disease and its potential neuropsychological basis. Journal of Clinical and Experimental Neuropsychology, 31(5), 553–564. https://doi.org/10.1080/13803390802360534
- Moore, D., West, A., Dawson, V., & Dawson, T. (2005). Molecular pathophysiology of Parkinson’s disease. Annual Review of Neuroscience, 28(1), 57–87. https://doi.org/10.1146/annurev.neuro.28.061604.135718
- Nawka, T., Verdonck de Leeuw, I. M., De Bodt, M., Guimaraes, I., Holmberg, E. B., Rosen, C. A., Schindler, A., Woisard, V., Whurr, R., & Konerding, U. (2009). Item reduction of the voice handicap index based on the original version and on European translations. Folia Phoniatrica & Logopaedica, 61(1), 37–48. https://doi.org/10.1159/000200767
- Paronen, S., & Vuomajoki, M. (2019). Voice-related changes in people with Parkinson’s disease after a group singing intervention. Tampere University. http://urn.fi/URN:NBN:fi:tuni201905151679
- Patel, R. (2002). Prosodic control in severe dysarthria. Journal of Speech, Language, and Hearing Research, 45(5), 858–870. https://doi.org/10.1044/1092-4388(2002/069)
- Prenger, M., Madray, R., Van Hedger, K., Anello, M., MacDonald, P., & Stocchi, F. (2020). Social symptoms of Parkinson’s disease. Parkinson’s Disease, 2020, 10. Article ID 8846544. https://doi.org/10.1155/2020/8846544
- Rabey, J. M., & Korczyn, A. D. (1995). The Hoehn and Yahr rating scale for Parkinson’s disease. In H. Przuntek, P. H. Kraus, P. Klotz, & A. D. Korczyn (Eds.), Instrumental methods and scoring in extrapyramidal disorders. Springer. https://doi.org/10.1007/978-3-642-78914-4_2
- Ramig, L. O., Countryman, S., Thompson, L. L., & Horii, Y. (1995). Comparison of two forms of intensive speech treatment for Parkinson disease. Journal of Speech, Language, and Hearing Research, 38(6), 1232–1251. https://doi.org/10.1044/jshr.3806.1232
- Ramig, L. O., Fox, C., & Sapir, S. (2008). Speech treatment for Parkinson’s disease. Expert Review of Neurotherapeutics, 8(2), 297–309. https://doi.org/10.1586/14737175.8.2.297
- Ramig, L., Halpern, A., Spielman, J., Fox, C., & Freeman, K. (2018). Speech treatment in Parkinson’s disease: Randomized controlled trial (RCT). Movement Disorders, 33(11), 1777–1791. https://doi.org/10.1002/mds.27460
- Ramsay, J. O., Graves, S., & Hooker, G. (2020). fda: Functional Data Analysis. R package version 5.1.5.1. https://CRAN.R-project.org/package=fda
- Ramsay, J. O., Hooker, G., & Graves, S. (2009). Functional data analysis with R and MATLAB. Springer.
- R Core Team. (2020). R: A language and environment for statistical computing. https://www.R-project.org/.
- Rusz, J., Cmejla, R., Ruzickova, H., & Ruzicka, E. (2011). Quantitative acoustic measurements for characterization of speech and voice disorders in early untreated Parkinson’s disease. The Journal of the Acoustic Society of America, 129(1), 350–367. https://doi.org/10.1121/1.3514381
- Schalling, E., Johansson, K., & Hartelius, L. (2017). Speech and communication changes reported by people with Parkinson’s disease. Folia Phoniatrica et Logopaedica, 69, 131–141. https://doi.org/10.1159/000479927
- Schröder, C., Nikolova, Z. T., & Dengler, R. (2010). Changes of emotional prosody in Parkinson’s disease. Journal of the Neurological Sciences, 289(1–2), 32–35. https://doi.org/10.1016/j.jns.2009.08.038
- Segall, L. (2017). The effect of group singing on the voice and swallow function of healthy, sedentary, older adults: A pilot study. The Arts in Psychotherapy, 55, 40–45. https://doi.org/10.1016/j.aip.2017.02.007
- Shih, L. C., Piel, J., Warren, A., Kraics, L., Silver, A., Vanderhorst, V., Tarsy, D. (2012). Singing in groups for Parkinson’s disease (SING-PD): A pilot study of group singing therapy for PD-related voice/speech disorders. Parkinsonism & Related Disorders, 18(5), 548–552. https://doi.org/10.1016/j.parkreldis.2012.02.009
- Skodda, S., Rinsche, H., & Schlegel, U. (2009). Progression of dysprosody in Parkinson’s disease over time—a longitudinal study. Movement Disorders, 24(5), 716–722. https://doi.org/10.1002/mds.22430
- Spielman, J., Mahler, L., Halpern, A., Gilley, P., Klepitskaya, O., & Ramig, L. (2011). Intensive voice treatment (LSVT®LOUD) for Parkinson’s disease following deep brain stimulation of the subthalamic nucleus. Journal of Communication Disorders, 44(6), 688–700. https://doi.org/10.1016/j.jcomdis.2011.05.003
- Streefkerk, B. M. (1997). Acoustical correlates of prominence: A design for research. Proceedings of the Institute of Phonetic Sciences of the University of Amsterdam, Amsterdam (Vol. 21, pp. 131–142).
- Tamplin, J., Morris, M., Marigiliani, C., Baker, F., Noffs, G., & Vogel, A. (2020). ParkinSong: Outcomes of a 12-month controlled trial of therapeutic singing groups in Parkinson’s disease. Journal of Parkinson’s Disease, 10(3), 1217–1230. https://doi.org/10.3233/JPD-191838
- Tanner, M., Rammage, L., & Liu, L. (2016). Does singing and vocal strengthening improve vocal ability in people with Parkinson’s disease? Arts & Health, 8(3), 199–212. https://doi.org/10.1080/17533015.2015.1088047
- Tavi, L., & Werner, S. (2020). A phonetic case study on prosodic variability in suicidal emergency calls. International Journal of Speech, Language & the Law, 27(1), 59–74. https://doi.org/10.1558/ijsll.39667
- Thies, T., Mücke, D., Auris, B., Steffen, J., & Barbe, M. (2018, Juli). The expression of prosodic prominence in Parkinsonian speech. 2nd International Conference “Prominence in Language”, (pp.11–13). Köln, Poster.
- Thies, T., Mücke, D., Lowit, A., Kalbe, E., Steffen, J., & Barbe, M. T. (2020). Prominence marking in parkinsonian speech and its correlation with motor performance and cognitive abilities. Neuropsychologia, 137, 107306. https://doi.org/10.1016/j.neuropsychologia.2019.107306
- Thies, T., Muecke, D., Lowit, A., Kalbe, E., Steffen, J., & Barbe, M. (2019). Cognitive skills and prominence production: Highlighting prominent elements in the speech of patients with Parkinson’s disease. Paper presented at Hanyang International Symposium on Phonetics and Cognitive Sciences of Language 2019, Seoul, Korea
- To be heard –research project 2018-2021. (2018). https://www.tuni.fi/en/research/be-heard-effects-different-rehabilitation-methods-communication
- Torre, P., & Barlow, J. A. (2009). Age-related changes in acoustic characteristics of adult speech. Journal of Communication Disorders, 42(5), 324–333. https://doi.org/10.1016/j.jcomdis.2009.03.001
- Van Kuijk, D., & Boves, L. (1999). Acoustic characteristics of lexical stress in continuous telephone speech. Speech Communication, 27(2), 95–111. https://doi.org/10.1016/S0167-6393(98)00069-7
- Whitfield, J., & Gravelin, A. (2019). Characterizing the distribution of silent intervals in the connected speech of individuals with Parkinson disease. Journal of Communication Disorders, 78, 18–32. https://doi.org/10.1016/j.jcomdis.2018.12.001
- Yinger, O. S., & Lapointe, L. L. (2012). The effects of participation in a group music therapy voice protocol (G-MTVP) on the speech of individuals with Parkinson’s disease. Music Therapy Perspectives, 30(1), 25–31. https://doi.org/10.1093/mtp/30.1.25
- Zellers, M., Gubian, M., & Post, B. (2010). Redescribing intonational categories with functional data analysis. Proceedings of Interspeech. Makuhari, Japan, (pp. 1141–1144).