
ABSTRACT
Previous research has provided strong evidence that speech patterns can help to distinguish between people with early stage neurodegenerative disorders (ND) and healthy controls. This study examined speech patterns in responses to questions asked by an intelligent virtual agent (IVA): a talking head on a computer which asks pre-recorded questions. The study investigated whether measures of response length, speech rate and pausing in responses to questions asked by an IVA help to distinguish between healthy control participants and people diagnosed with Mild Cognitive Impairment (MCI) or Alzheimer’s disease (AD). The study also considered whether those measures can further help to distinguish between people with MCI, people with AD, and healthy control participants (HC). There were 38 people with ND (31 people with MCI, 7 people with AD) and 26 HC. All interactions took place in English. People with MCI spoke fewer words compared to HC, and people with AD and people with MCI spoke for less time than HC. People with AD spoke at a slower rate than people with MCI and HC. There were significant differences across all three groups for the proportion of time spent pausing and the average pause duration: silent pauses make up the greatest proportion of responses from people with AD, who also have the longest average silent pause duration, followed by people with MCI then HC. Therefore, the study demonstrates the potential of an IVA as a method for collecting data showing patterns which can help to distinguish between diagnostic groups.
Introduction
There is evidence that patterns in spontaneous speech can help to distinguish between people with early stage neurodegenerative disorders (ND) including mild cognitive impairment (MCI) and Alzheimer’s disease (AD) and healthy control participants. The accurate distinction between these groups could allow more effective early diagnosis and monitoring for people with Alzheimer’s pathology so that treatment and support plans can be put in place.
Martı́nez-Nicolás et al. (Citation2021) reviewed studies which applied speech signal processing techniques to audio recordings of people with MCI and/or people with AD and healthy age-matched control groups. Many studies found evidence that response length, speaking rate, articulation rate and pausing were helpful in distinguishing between the groups. In a descriptive study of healthy controls, people with MCI and people with AD, Beltrami et al. (Citation2018) found that features including pause rate, phonation rate, duration of speech segments and duration of silence segments differentiated between healthy controls, people with multidomain MCI and people with AD. In another descriptive study of healthy controls, people with MCI and people with AD, Qiao et al. (Citation2020) reported that percentage of silence duration, average duration of phrasal segments, average duration of silence segments, number of speech segments, number of long pauses, ratio of hesitation/speech counts, and ratio of short pause/speech counts were among the speech parameters which showed statistical differences between the groups.
A group of studies reviewed by Martı́nez-Nicolás et al. (Citation2021) aimed for statistical classification of healthy controls and people with MCI and/or people with AD. In a series of studies comparing healthy controls and people with AD, López-de-Ipiña and colleagues found that statistical classification achieved an accuracy of around 90% or higher (López de Ipiña et al., Citation2013; López de Ipiña, Alonso-Hernández, et al., Citation2015; López de Ipiña, Solé-Casals, et al., Citation2015). Some of the features on which their classification was based related to duration, including proportion of voiceless frames. König et al. (Citation2015) performed automated analyses of voice recordings of healthy controls, people with MCI and people with AD, including recordings of an image description task. Various features were measured including features relating to the continuity of speech and temporal organisation. Pairs of groups (healthy controls vs. MCI, healthy controls vs. AD, and MCI vs. AD) were classified with an accuracy of 79%−87% (±5%). Tóth et al. (Citation2018) investigated data from two recall tasks (immediate and delayed) and a task in which participants were asked to talk about the previous day. Significant differences between healthy controls and people with MCI were reported for duration, the total length of silent pauses and the total length of pauses in all tasks. They were able to classify healthy controls and people with MCI with an accuracy of 78.8%. Data considered by Fraser et al. (Citation2019) included healthy controls and people with MCI completing three tasks: reading silently, reading aloud and describing a picture. By combining data from the three tasks and examining a range of features (and not just speech) a classification accuracy of 83% was achieved. Al-Hameed et al. (Citation2019) examined recordings of consultations between patients in a memory clinic (including people with MCI and people with AD) and a consultant neurologist. Selected features could classify the two groups with an accuracy of up to 97%, and the top features included features relating to response length, the number of pauses and the ratio of pauses to speech.
Boschi et al. (Citation2017) reviewed a range of studies which examined connected speech samples from individuals with neurodegenerative diseases including MCI and AD (picture descriptions, story narrations, and responses in interviews). Statistically significant differences on certain variables were found in multiple studies of connected spontaneous speech. For example, speech rate has been found to be higher for healthy controls than people with AD (Ash & Grossman, Citation2015; Ash et al., Citation2007; Carlomagno et al., Citation2005; Sajjadi et al., Citation2012; Singh et al., Citation2001), hesitation ratio has been found to be higher for people with AD than for healthy controls (Cuetos et al., Citation2007; Hoffmann et al., Citation2010; Sajjadi et al., Citation2012), and mean length of utterance has been found to be higher for healthy controls than for people with AD (Ash & Grossman, Citation2015; Ash et al., Citation2007; Orimaye et al., Citation2014; Yancheva et al., Citation2015).
Findings of other studies not included in the reviews in Boschi et al. (Citation2017) and Martı́nez-Nicolás et al. (Citation2021) support the view that healthy controls can be differentiated from people with MCI and/or people with AD on the basis of patterns in spontaneous connected speech. For example, Khodabakhsh et al. (Citation2015) examined 20 prosodic features of spontaneous conversations involving people with and without AD with a view to the automatic recognition of AD. Classification accuracy of more than 80% was achieved on the basis of silence ratio, average silence count, and average continuous word count; prosodic features were better predictors of AD than other linguistic features. O’Malley et al. (Citation2020) examined 72 features, including 24 ‘acoustic-only’ characteristics, in recordings of healthy controls, people with MCI, people with AD and a group of people with functional cognitive disorder (FCD) responding to questions asked by an intelligent virtual agent. The acoustic-only features included measures of average silence. They found that a four-way classification (healthy controls vs people with FCD vs MCI vs AD) could be achieved with an accuracy of 60%, with an accuracy of identifying people with AD of 80%.
In summary, there is strong evidence that speech patterns can help to distinguish between people with early stage neurodegenerative disorders and healthy controls. Numerous studies have found evidence that response length and other features relating to the temporal organisation of spontaneous speech, including speech rate and the number and length of pauses, are helpful in distinguishing between the groups. Work in this area to date, therefore, shows great promise. One aim of this study is to increase understanding of some of the specific details of certain speech features of people with ND, including people with MCI and people with AD, in comparison with healthy controls.
This study examines speech patterns in responses to questions asked by an intelligent virtual agent, or IVA: a talking head on a computer which asks the respondent pre-recorded questions when prompted to do so. Collecting data in this way is a relatively recent development, but studies from our group have shown that it can be used to distinguish between diagnostic groups (Mirheidari et al., Citation2017; Mirheidari, Blackburn, O’Malley, et al., Citation2019; Mirheidari, Blackburn, Walker et al., Citation2019; G. Walker et al., Citation2021; T. Walker et al., Citation2018). There are several benefits to using an IVA as a data collection method. This will be scalable, cheap and available to undertake remotely in people’s own home. Furthermore, from a research perspective it exerts control on the questions asked, reducing the variability involved when a human (clinician) asks a question. It has been shown that clinicians may make changes to questions and the order in which they ask them even when administering standardised neuropsychological tests (Barnes et al., Citation2018; Jones et al., Citation2019; T. Walker et al., Citation2018). Controlling the format and delivery of the questions by using an IVA ensures that all respondents are answering exactly the same questions as each other, in the same sequential contexts.
While it might be presumed that patterns which have been found in other sorts of spontaneous speech samples (e.g. picture description tasks, interviews with a human) will be evident in responses collected by an intelligent virtual agent, it is still important to test this directly. It has been found that speech directed to computers differs from speech directed to humans. For example, Burnham et al. (Citation2010) found that in a discourse task, compared with human-directed speech, computer-directed speech had longer vowel durations and larger vowel spaces. Other studies of people with ND have reported that analysing speech from different sorts of tasks yield different results. For example, in a study of speech produced by people with MCI, people with AD and people without cognitive impairment, Bschor et al. (Citation2001) found that on a picture description task all groups produced an equal number of words, but the diagnostic groups could be better differentiated via a naming task, and semantic and phonemic fluency tasks. Vincze et al. (Citation2021) studied characteristics of speech produced by people with MCI, people with AD and healthy controls in tasks which test working and episodic memory (an immediate recall task, a task in which participants describe the previous day, and a delayed recall task). They found that certain characteristics distinguished between the groups more clearly on some tasks than others. In addition to further testing the validity of the intelligent virtual agent as a method of data collection, this also provides the opportunity to further refine our understanding of the organisation of spontaneous speech produced by people with ND, and how it compares with speech produced by healthy controls.
This study proceeds on the assumption that for any scalable tool, technology will be required in a fully or partially automated assessment of language. However, the results of any analysis will need translating or to be represented on a report that is comprehensible to clinicians working in memory assessment pathways, in primary and secondary care. Furthermore, the future of healthcare using digital platforms may grant patients greater access to their medical record, and future diagnostic or monitoring tools would need to be, to some degree, comprehensible by patients. The variables of speech that distinguish normal ageing from pathological ageing need to be clearly described and utilised in automated reports of language, including speech characteristics which can be readily perceived and understood by clinicians and patients. The results should be presented in such a way that clinicians and patients can see the results in understandable units of measurement and the extent of the variation within each group can be clearly seen.
The participants in this study are healthy controls, people with MCI and people with AD. The main question driving the study is: can responses collected by an IVA be used to detect measures of response length, speech rate and pausing to help distinguish between healthy controls and people with ND including people with MCI and people with AD? The methods of analysis and presentation employed are specifically intended to produce results and visualisation which are likely to be understandable to clinicians and patients. (Throughout this article we use ‘clinician’ to refer to members of the clinical team involved in assessing and treating patients with ND, including neurologists, psychologists, occupational therapists and specialist nurses.)
Methods
This section described the methods used in this study.
Ethical approval
Ethical approval for the collection of the data analysed in this study was granted by the NRES Committee South West-Central Bristol (REC number 16/LO/0737) in May 2016. Participants were recruited from two groups: patients attending memory or neuropsychology clinics in the Royal Hallamshire Hospital in Sheffield, United Kingdom and members of the University of the Third Age (https://www.u3a.org.uk).
Participant information
Healthy controls all scored within the normal range on cognitive testing (Addenbrooke’s Cognitive Examination Revised). All participants were below clinical cut-offs for anxiety and depression as measured by the Generalized Anxiety Disorder questionnaire (GAD-7) and the Patient Health Questionnaire (PHQ-9), respectively, and were first language English speakers.
For the participants with a neurodegenerative disorder diagnosis, the diagnoses were made by cognitive neurologists at the Royal Hallamshire Hospital in Sheffield. The final diagnosis was made based on the results of structural and functional brain imaging, Addenbrooke’s Cognitive Examination, clinical interviews, and longitudinal monitoring. None of the participants were tested for protein based biomarkers. Participants were recruited to the study by convenience sampling; all were white, of British descent, and were raised and schooled in English.
The number of interactions examined is as follows: healthy controls = 26 (19 female, 7 male), people with ND = 38 (12 female, 26 male) of which people with MCI = 31 (11 female, 20 male) and people with AD = 7 (1 female, 6 male). The average age of participants, where this information is available, is as follows: healthy controls = 67.0 years (n = 17, median = 67, range = 54–80; age unknown = 9); people with MCI = 63.9 years (n = 30, median = 62, range = 37–88; age unknown = 1); people with AD = 64.2 years (n = 6, median = 62, range = 56–79; age unknown = 1). Cognitive tests were conducted specifically as part of the research project; provides details of these test results, with at least one cognitive test result provided for most participants (35 out of 38).
Table 1. Details of cognitive test results for people with mild cognitive impairment (PwMCI) and people with Alzheimer’s disease (PwAD).
The intelligent virtual agent
The IVA was created using BotLibre (https://www.botlibre.com). All participants provided written informed consent prior to communicating with the IVA. The IVA was shown on a laptop computer screen in front of the participant and asked a set of 12 pre-recorded questions. The questions were developed based on the findings of prior work undertaken on memory clinic consultations between patients and clinicians and an automated approach based on that data (Elsey et al., Citation2015; Jones et al., Citation2016). Participants were instructed to move from one question to the next by pressing a button on the computer keyboard after they had finished their response. Audio and video recordings of the participants were captured. The recordings were made using the built-in microphone and camera on the computer. The interactions occurred in the presence of a research assistant who was instructed to remain as passive as possible during the recording but could support patients with the recording procedure if necessary. Participants could choose to be accompanied by a partner or relative in which case the companion was also recorded. Interactions where an accompanying partner was present and spoke in the course of answering either or both of the target questions were excluded.
Task elicitation
This study examines responses to two questions concerning recent events, one about what the participant did over the previous weekend, and another about what had been in the news recently. Questions concerning recent events have particular relevance to this study because Ribot’s law states that recent memories are more sensitive to impairment than memories about remote events. This is supported by clinical observation and empirical research (see e.g. Müller et al., Citation2016 who found that people with memory problems were better able to remember remote autobiographical events than recent events). It also reflects the nature of the pathology of Alzheimer’s disease, the most common form of dementia (or reason for the diagnosis of Mild Cognitive Impairment): the degeneration of brain structures involved in acquiring new memories rather than networks involved in retrieving older memories. The questions resemble semi-standardised questions asked in conventional memory clinics where clinicians prompt patients to recall recent events. Orthographic transcriptions of the interactions were prepared by experienced interview transcribers.
Speech timing measurements and procedures
All phonetic analysis was conducted using Praat (Boersma & Weenink, Citation2023) with subsequent data processing using Python (Python Software Foundation, Citation2023) and R (R Foundation for Statistical Computing, Citation2023). This section describes the measurement procedures for response length and pausing, and speech rate.
Response length and pausing
Response length will be presented in terms of numbers of words and duration. Two variables will be reported for duration: ansDur and spDur. Both variables involve using Praat to detect voiced frames in the portion of the recording between the end of one question from the IVA and the beginning of the next question. Voicing can be detected reasonably well using automated methods even in environments with background noise and where recording quality is suboptimal. Voiced frames are identified from pitch traces created using a two-pass detection method (De Looze & Hirst, Citation2008; Hirst & De Looze, Citation2021).
The variable ansDur is a measure from the time of the first voiced frame to the last voiced frame. The variable spDur is based on the variable ansDur, minus any silent pauses. Any portion between the first voiced frame and the last where there were consecutive unvoiced frames lasting 0.5 s or longer was considered a silent pause; the remaining portions (i.e. where there is voicing, or voiceless portions of less than 0.5 s), are taken as a proxy for speech. Experimentation suggested that a silent pause threshold of 0.5 s did a good job of balancing the identification of pauses in the responses with the need to disregard sequences of voiceless speech sounds where voicing is not expected. Average silent pause duration is reported separately as the variable silPauseAve, and the proportion of silent pauses in responses is reported as the variable silPauseProp. All labelling of speech and silent pauses and the subsequent extracting of results was done via an automated approach using Praat.
Speech rate
Measures of speech rate will take two forms. Following Laver (Citation1994), speaking rate is the rate of speech of the whole speaking-turn, in this case from the first voiced frame in the response to the question to the last; articulation rate is calculated on the basis of what is produced between the same two points but excluding any silent pauses.
Measures of speech rate will be given in words per second (words/s; srWords for speaking rate; arWords for articulation rate) and in syllables per second (syll/s; srSylls for speaking rate; arSylls for articulation rate). Orthographic transcriptions were run through espeak-ng (Dunn, Citation2023) to create phonemic transcriptions. Since vowels form the nucleus (or peak) of a syllable in citation-form English, the number of vowel segments will be equivalent to the number of syllables in a citation-form production of the word. (Diphthongs were treated as single segments.) These counts were used to establish the number of syllables in the responses. So, for example, if a response takes 30 s to produce and consists of 45 two-syllable words then the speaking rate for the response measures 45/30 = 1.5 words/s [srWords] and 90/30 = 3 syll/s [srSylls]. If that response contains 10 s of silent pauses, then the articulation rate measures 45/(30–10) = 2.25 words/s [arWords] and 90/(30–10) = 4.5 syll/s [arSylls]. The greater the difference between speaking rate and articulation rate, the higher the proportion of response time taken up by silent pauses.
Statistical analysis
Shapiro-Wilk tests found that measures on most variables for most groups had non-normal distributions, and where distributions were found to have normal distributions, they broke the homogeneity of variance assumption according to Levene’s test. The non-parametric Kruskal Wallis test was therefore used to determine whether the measures of each variable had data distributions which were significantly different for the three-way comparison between healthy controls, people with MCI, and people with AD. No additional comparison was made between the aggregate of people with AD and people with MCI (people with ND) compared to healthy controls. Post-hoc analyses were conducted for variables with a significant difference using Dunn’s test. The False Discovery Rate (FDR) approach was used to correct for multiple comparisons. The FDR was calculated using all post-hoc tests rather than the comparisons for a single Kruskal Wallis test. FDR was selected over other more stringent tests, for example Bonferroni, to reduce the risk of false negatives. Since this study is part of a longer-term programme of research, we are keen to avoid false negatives which could lead to important features being overlooked in our future model development.
Correlations will be presented using Pearson’s correlation coefficient. Correlations will be presented using Pearson’s correlation coefficient. Correlation analysis will help us determine the extent to which the phenomena could be explained by fewer variables. We expect there will be correlations between some of the variables but not others. For example, we expect to find correlations between measures expressed in numbers of words and in numbers of syllables: because words consist of syllables, as the number of words increases, the number of syllables will also increase. There are other variables where we do not particularly expect to see a correlation, for example between the number of words produced and the average length of pauses.
Although it is important to determine how the variables in this analysis differ between individuals at different stages of cognitive decline (people with AD and people with MCI), a scalable tool for detecting early signs of cognitive decline may be applied in the detection of cognitive decline in general. Furthermore, given that the variables all measure different properties of speech, it may be possible to detect differences between healthy controls and people with ND using fewer of the variables utilised in this study. Therefore, a logistic regression analysis was conducted to identify the variables that explain the most variance for the differential diagnosis between healthy controls and people with ND.
Results
This section presents an investigation into potential differences in the speech patterns of healthy controls, people with MCI and people with AD. As a further step, people with MCI and people with AD are combined into one group to see whether people with early stage neurodegenerative disorders (i.e. MCI and AD) can be distinguished from healthy controls.
Speech measures for people with mild cognitive impairment, Alzheimer’s disease and healthy controls
This section presents results relating to speech patterns of healthy controls, people with MCI and people with AD.
Response length measures
shows measures of response length for responses by healthy controls, people with MCI and people with AD. The bottom of the box in each boxplot represents the first quartile (Q1) and the top of the box represents the third quartile (Q3); the horizontal line within the box represents the median (Q2); the whiskers extend to the value of any data-points below Q1 or above Q3, provided that the distance between the data-point and Q1 or Q3 is less than 1.5 times the interquartile range (i.e. Q3-Q1). A dot is overlaid on the boxplot to represent the value for an individual speaker within a group; to avoid complete overlap of symbols, dots are presented with horizontal ‘jitter’.
Figure 1. Measures of response length for healthy control participants (HC), people with mild cognitive impairment (PwMCI), people with Alzheimer’s disease (PwAD) and people with diagnosed early stage neurodegenerative disorders (PwND; PwMCI + PwAD).
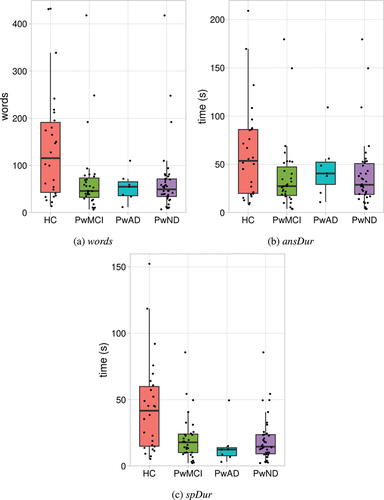
Each of the response length measures were analysed using the Kruskal Wallis test and Dunn’s Correction. There was a significant group difference in the number of words spoken [words], H(2) = 7.002, p = 0.03. People with MCI (median = 46 words) spoke significantly fewer words (p = 0.022) compared to healthy controls (median = 115.5 words). There was no significant difference between people with AD (median = 55) and healthy controls (p = 0.12). There was no significant group difference for the answer duration [ansDur], H(2) = 4.542, p = 0.103. Finally, there was a significant group difference for the speech duration [spDur], H(2) = 11.055, p = 0.004. People with AD (median = 12.5 s) spoke for significantly less time (p = 0.017) than healthy controls (median = 41.7 s) and people with MCI (median = 17.9 s) spoke for significantly less time (p = 0.017) than healthy controls.
Speech rate measures
shows measures of speech rate for responses by healthy controls, people with MCI and people with AD.
Figure 2. Measures of speech rate for healthy control participants (HC), people with mild cognitive impairment (PwMCI), people with Alzheimer’s disease (PwAD) and people with diagnosed early stage neurodegenerative disorders (PwND; PwMCI + PwAD).
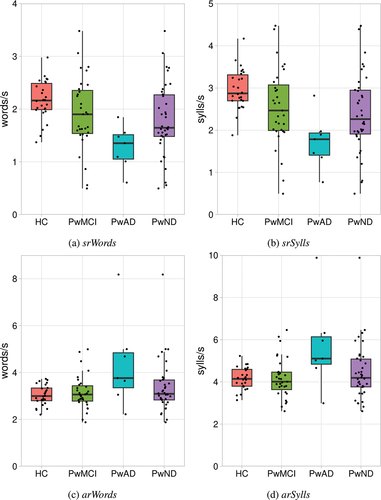
Each of the response length measures were analysed using the Kruskal Wallis test and Dunn’s Correction. There was no significant difference between the groups for articulation rate measured in words [arWords], H(2) = 5.087, p = 0.079. However, there was a significant group difference in articulation rate measured in syllables [arSylls], H(2) = 6.327, p = 0.042. The articulation rate measured in syllables was significantly faster (p = 0.03) for people with AD (median = 5.11 words/s) compared to healthy controls (median = 4.14 words/s) and significantly faster (p = 0.02) compared to people with MCI (median = 4.009 words/s). There was no significant difference between people with MCI and healthy controls (p = 0.87). There was a significant group difference in the speaking rate measured in words [srWords], H(2) = 13.853, p = 0.001. People with AD (median = 1.35 words/s) spoke words significantly slower (p = 0.002) than healthy controls (median = 2.16 words/s) and significantly slower (p = 0.02) than people with MCI (median = 1.9 words/s). There was no significant difference between people with MCI and healthy controls (p = 0.09). Furthermore, there was a significant group difference in speaking rate measured in syllables [srSylls], H(2) = 13.849, p = 0.001. The speaking rate for people with AD (median = 1.785 sylls/s) was significantly slower (p = 0.001) than healthy controls (median = 2.87 sylls/s) and significantly slower (p = 0.019) than people with MCI (median = 2.47 sylls/s). There was no significant difference between people with MCI and healthy controls (p = 0.089).
Measures of silent pauses
Each of the measures of silent pauses were analysed using the Kruskal Wallis test and Dunn’s Correction. There was a significant group difference for the silent pause proportion [silPauseProp], H(2) = 18.196, p < 0.001. People with AD (median = 66.89%) paused for a higher proportion of time (p < 0.001) compared to healthy controls (median = 29.95%) and a significantly higher proportion of time (p = 0.017) compared to people with MCI (median = 40.78%). People with MCI paused for a significantly higher proportion of time (p = 0.028) compared to healthy controls. There was a significant group difference for the average duration of silent pauses [silPauseAve], H(2) = 20.592, p < 0.001. The average duration of silent pauses was significantly longer (p < 0.001) for people with AD (median = 2.66) compared to healthy controls (median = 0.99) and was significantly longer (p = 0.017) compared to people with MCI (median = 1.24). People with MCI had significantly longer pauses (p = 0.017) compared to healthy controls. displays the pause measures for all three groups. ( show results for 61 participants because 3 participants – all people with MCI – have no silent pauses in their answers, therefore there are no average silent pause duration figures to report.)
Figure 3. Proportion of response time taken up by silent pauses and average silent pause duration in responses by healthy control participants (HC), people with mild cognitive impairment (PwMCI) and people with Alzheimer’s disease (PwAD).
There is a very strong positive correlation between silent pause proportion and average silent pause duration such that as one variable increases so does the other (Pearson’s correlation coefficient r for the sample as a whole = 0.846, p < 0.001).
In summary, at the level of the group there is a progression for both silent pause proportion and average silent pause duration such that measures for people with MCI are higher than for healthy controls, and measures are higher again for people with AD.
Summary
People with MCI spoke significantly fewer words compared to healthy controls. People with AD spoke for significantly less time than people with MCI and healthy controls, and people with MCI spoke for significantly less time than healthy controls. With regards to speech rate, people with AD displayed a faster articulation rate when measured in syllables compared to people with MCI and healthy controls. People with AD displayed a slower speaking rate compared to people with MCI and healthy controls. Silent pauses make up the greatest proportion of responses from people with AD, followed by people with MCI, then healthy controls. The average duration of silent pauses is shortest in responses from healthy controls, longer in responses from people with MCI, and longest in responses from people with AD.
Speech measures for people with early stage neurodegenerative disorders and healthy controls
This section presents results relating to speech patterns of healthy controls and people with ND to inform the reader of the presentation of these speech patterns when people with MCI and people with AD are combined.
Response length measures
shows response length measures for healthy controls and people with ND. The median number of words produced by healthy controls is 116 words, whereas the median for people with ND is lower at 49.5 words. The median response duration for healthy controls is 53.7 s [ansDur] and 41.7 s [spDur], and the median for people with ND is shorter at 28.9 s [ansDur] and 14.6 s [spDur]).
Speech rate measures
shows speech rate measures for healthy controls and people with ND. The median speaking rates for healthy controls are 2.16 words/s and 2.87 sylls/s; the medians for people with ND are slower at 1.65 words/s and 2.26 sylls/s. The median articulation rates for healthy controls is 3.00 words/s and 4.14 sylls/s, and are very similar to the median for people with ND which are 3.09 sylls/s, 4.19 sylls/s.
Measures of silent pauses
A larger proportion of response time is taken up by silent pauses for people with ND than for healthy controls. The average silent pause proportion for people with ND is 45.25%, and 29.95% for healthy controls. shows the proportion of each participant’s responses which consists of silent pauses, as well as their average silent pause duration.
Figure 4. Proportion of response time taken up by silent pauses and average silent pause duration in responses by healthy control participants (HC) and people with diagnosed early stage neurodegenerative disorders (PwND).
There is a very strong correlation between the proportion of response time taken up by silent pauses and average silent pause duration when all participants are combined (Pearson’s correlation coefficient r for the sample as a whole = 0.846, p < 0.001, for healthy controls r = 0.815, p < 0.001, and for people with ND r = 0.839, p < 0.001). The average silent pause duration in responses from people with ND is higher than the average silent pause duration for healthy controls. This is borne out by aggregate measures: the average duration of all silent pauses in responses from people with ND is 1.64 s while the average duration of all silent pauses in responses from healthy controls is 1.01 s.
Logistic regression
A logistic regression was carried out to assess the effect of all nine variables [spDur, ansDur, words, silPauseAve, silPauseProp, arWords, arSylls, srWords, srSylls] on the likelihood of cognitive decline where individuals with AD and MCI were grouped together. The overall model was statistically significant when compared to the null model, (χ2 (9) = 31.275, p < 0.001), explained 52.2% of the variation of cognitive decline (Nagelkerke R2) and correctly predicted 84.4% of cases (sensitivity = 94.7% and specificity = 69.2%). The forward stepwise (conditional) method was used to determine which variables explain the most variance within the data. The procedure identified two variables that explained the most variance: spDur and ansDur. The Logistic Regression model was statistically significant when compared to the null model, (χ2 (2) = 26.133, p < 0.001), explained 45.2% of the variation of cognitive decline (Nagelkerke R2) and correctly predicted 76.6% of cases (sensitivity = 89.5% and specificity = 57.7%). visualises the Logistic Regression decision boundary for the model identified using the forward stepwise method.
Figure 5. A scatter plot visualisation of the duration of speech (spDur) and total duration of the response (ansDur) for healthy control participants (HC) and people with diagnosed early stage neurodegenerative disorders (PwND). The linear decision boundary generated by the Logistic regression model is represented by the diagonal line within the plot. Data points to the right of the line will receive a prediction of HC. Data points to the left of the line will receive a prediction of neurodegenerative disorder.
Summary
Measures of response length, whether measured in terms of words, ansDur or spDur, can help to distinguish the two groups, people with ND tending to produce shorter responses than healthy controls. While measures of articulation rate are quite similar for the two groups, measures of speaking rate can help to distinguish them, people with ND tending to produce responses with a slower speaking rate than healthy controls. Silent pauses take up a greater proportion of the response time for people with ND than for healthy controls and the average length of silent pauses tends to be shorter in responses from healthy controls than in responses from people with ND. Across all variables, the variables spDur and ansDur are able to explain the most variance within the data and effectively differentiate between people with ND and healthy controls.
Correlation analysis
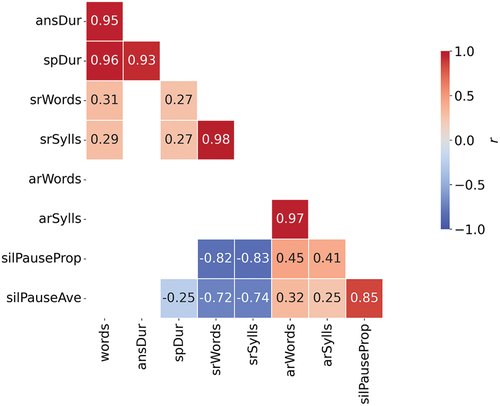
presents a correlation matrix for all variables when all participants are combined.
Figure 6. Correlation matrix for all variables, all participants combined (n = 64). Cells in the matrix show values for Pearson’s correlation coefficient r where p < 0.05.
Discussion
The main question driving this study is: can responses collected by an IVA be used to detect measures of response length, speech rate and pausing to help distinguish between healthy controls and people with ND including people with MCI and people with AD? It has been found, on the basis of data collected using an IVA, that responses from healthy controls were longer than those produced by people with ND. For example, healthy controls spoke for significantly more time than people with MCI and people with AD, people with MCI spoke for significantly more time than people with AD, and people with MCI spoke fewer words. This suggests that healthy controls are better able to remember and describe things in detail than people with ND. This could in part be a reflection of responses from healthy controls containing more words: all else being equal, a response containing more words will take longer to produce. It has been found that a larger proportion of response time for people with MCI and people with AD is taken up by silent pauses than for healthy controls and that the average silent pause duration is longer for people with AD and people with MCI than for healthy controls, with a strong correlation between the two variables. The strength of this correlation is not inevitable. For example, an individual could pause only occasionally in a long answer, but those pauses could be long. This would give a relatively high value for average silent pause duration but a relatively low value for silent pause proportion. Conversely, an individual could pause frequently and for a short time in a short answer giving a relatively low value for average silent pause duration but a relatively high value for silent pause proportion. The correlations could be explained by people with ND pausing more often and for longer as they try to think of what to say. It has been found that, in terms of speaking rate, people with AD have a slower speaking rate than MCI and healthy controls. It has also been found that, moving from healthy controls to people with MCI to people with AD, the proportion of response time taken up by silent pauses and the average silent pause duration increase, with a strong correlation between the two variables. This suggests that as neurodegenerative disease progresses and memory becomes increasingly impaired, participants are pausing more often and for longer as they find it increasingly difficult to either produce words or to remember what they are answering.
The strength of the correlations between some pairs of variables shown in might be anticipated. For example, it makes sense that ansDur and spDur both show a strong positive correlation with words: as the number of words in the responses goes up, so does the time it takes to produce the response. The strength of the correlation between srWords and srSylls, and between arWords and arSylls is unsurprising since words consist of syllables: as the rate at which words are produced goes up, the rate at which syllables produced also goes up. The strength of the negative correlations between the proportion of silent pauses (silPauseProp) and speaking rate (srSylls, srWords), and between the average duration of silent pauses (silPauseAve) and speaking rate is also unsurprising since speaking rate is calculated on the basis of the duration of the response (i.e. speech + pauses), so as the average duration and proportion of silences goes up, measures of speaking rate go down. These correlations suggest that a reduced number of variables may be sufficient to predict the diagnosis should these speech variables be incorporated in an automated analysis of speech. This was supported by the Logistic Regression analysis using the forward stepwise method whereby spDur and ansDur were able to explain a large proportion of the variance between the healthy controls and people with ND.
The statistical analysis has shown that people with MCI, people with AD and healthy controls can be distinguished on a range of variables relating to speech patterns (response duration, speaking rate and pausing). Since there are statistically significant differences between all the groups (healthy controls, people with MCI and people with AD) on variables relating to pausing, these variables may have particular relevance to distinguishing between the groups on the basis of other datasets. These variables are attractive for other reasons too. The variables can be measured automatically which makes them attractive for future automated diagnostic or stratification systems. The measurements are reasonably robust even when applied to recordings of suboptimal quality such as those recorded in a consultation room. Since the measurements concern relatively simple features of the speech signal (such as how long the silent pauses are, and how much of the response time is accounted for by those silent pauses) they can be readily understood by anyone considering the results, including clinicians and patients. This is important in order to enhance the interpretability or explainability of the system, i.e. to increase the likelihood of being able to successfully describe the internals of the system to others (for a review of interpretability, explainability and intelligibility in the context of machine learning, see Marcinkevičs & Vogt, Citation2023). Interpretability is especially important in the case of clinical decision making, where clinicians need to have confidence in the system they are using. A further consideration is that clinicians and patients involved in the memory assessment pathway may have little or no specialist knowledge of linguistic and phonetic analysis.
Previous work on the temporal organisation of spontaneous speech shows great promise in helping to distinguish between people with early stage neurodegenerative disorders and healthy controls. However, it can be difficult to see how the findings of that work could be applied in clinical settings due to the technical and other knowledge required. One barrier is that the acoustic variables studied may require significant technical expertise to study and to interpret in a meaningful way (e.g. Al-Hameed et al., Citation2019; Beltrami et al., Citation2018; Khodabakhsh et al., Citation2015; López de Ipiña et al., Citation2013; López de Ipiña, Alonso-Hernández, et al., Citation2015; López de Ipiña, Solé-Casals, et al., Citation2015; O’Malley et al., Citation2020). In some cases it is unclear precisely how the features were extracted or studied. Another barrier is the complexity of the models used in the statistical classification: some models are very complex, especially for non-specialists (e.g. Al-Hameed et al., Citation2019; Fraser et al., Citation2019; König et al., Citation2015; Tóth et al., Citation2018).
The findings of this study, where an IVA was used as part of the data collection method, are consistent with findings from studies using other methods of data collection. For example, López de Ipiña, Alonso-Hernández, et al. (Citation2015) and López de Ipiña, Solé-Casals, et al. (Citation2015) examine video recordings of interactions in which healthy controls and people with AD tell stories or recount feelings. They report that recordings of people with AD speak for less time than healthy controls, people with AD speak more slowly and have longer pauses than healthy controls. In Nasrolahzadeh et al. (Citation2018) collected similar data, recordings conversations in which people with AD and healthy controls were asked to tell stories and to express their feelings. They report that people with AD spoke more slowly and with longer pauses than healthy controls. These are all tendencies which have been observed in this study, and set out in greater detail than in that previous work.
There are several implications of this study. First, this study has helped to further demonstrate the usefulness of phonetic analysis to distinguish between the three groups. Second, this study has helped to demonstrate the usefulness of an IVA as a method for collecting data because we have shown differences between the groups. Finally, the automated methods of analysis, labelling by detecting voiced frames and calculating speaking rate based on orthographic transcriptions could be utilised to produce a report for clinicians and patients.
The limitations of this study provide opportunities for development in the future. First, the number of participants considered here is quite modest which reduces the strength of the conclusions which can be drawn. One surprising finding was that on one measure (arSylls) articulation rate was significantly faster for people with AD (the smallest of the three groups) compared to people with MCI and healthy controls. There is no obvious explanation for this finding, and it should be explored further with a larger sample size. However, while the groups are small, even small groups of participants ought to be sufficient to reveal any widespread patterns in the groups. Second, there is quite wide variation in some of the cognitive test results within the groups. For example, results on the MMSE for people with AD (the group with the significantly faster articulation rate) ranges from 13 to 29 points. However, in the longer term we are interested in contributing to the creation of screening tools for the early detection of neurodegenerative disorders in clinical settings, and the variation in our data reflects to some extent to heterogeneity of patients in the clinic: the earliest opportunity to detect neurodegenerative disorder in one person might be soon after symptoms first present, whereas for another, it might be at a point where their cognition has deteriorated further. As a group, the people with ND in this study are relatively young to have received such a diagnosis, so our being able to distinguish between the groups is encouraging with regard to the early detection of neurodegenerative disorders in clinical settings. Furthermore, visual inspection of the distribution of the measures used within our analysis across groups and age (including an exploration of the measures for participants for whom age is unknown) did not identify any age related trends within the data. Third, the lack of testing for protein based biomarkers of AD, especially the MCI cohort, is a limitation. This is related to these biomarkers being available by cerebrospinal fluid analysis or PET scanning which are invasive or very expensive. The development of blood based biomarkers of AD will facilitate validation of this approach. Fourth, while employing an IVA exerts some control over the interactions, participants were allowed to bring someone with them as a companion which some (but not all) participants did. The variation in the presence/absence of a companion reflects variation observed in the clinic (Elsey et al., Citation2015), and while recordings were excluded where the companion spoke during the response to any of the target questions in this study, it is conceivable that the presence of the companion may have still had some impact on the responses given. Fifth, the only language considered is English. This means it is not clear how generalisable these findings are to other languages, though if differences between the groups reflect increasingly compromised cognitive function, then it might be anticipated that the differences would be observed when interactions take place in other languages too. It is also worth noting that variation in speech rate across languages (Coupé et al., Citation2019) means that cross-linguistic comparison of speech rate would need to be carefully executed.
While there are parallels here with some previous work, some of the findings of this study seem to be slightly at odds with other studies. For example, in a study of speech produced by people with MCI, people with AD and people without cognitive impairment, Bschor et al. (Citation2001) found that all groups produced an equal number of words on a picture description task (cf. ). One possible explanation for the difference between the findings of Bschor et al. (Citation2001) and the current study is that the method of data collection is substantially different in each case. In a study of the speech of patients with posterior cortical atrophy (PCA), where the Alzheimer pathology begins in the occipital lobes, Crutch et al. (Citation2013) studied data from a battery of neurolinguistic and neuropsychological test, including a task in which participants talked about their last holiday. They analysed the samples for a range of features including the number of words produced, speech rate, and mean and maximum inter-word intervals. They found no significant difference between patients with PCA and healthy controls on total words or pause length. This may well reflect sparing of cortical areas involved in language in the early stages of PCA. They found a significant difference between patients with PCA and healthy controls in speech rate. This study found a statistically significant difference between people with MCI and healthy controls in the number of words produced. This study also found a statistically significant difference in speech rate between people with AD compared to people with MCI and healthy controls, and a difference between all three groups on average silent pause proportion and average silent pause duration.
Conclusion
This study set out to investigate whether measures of response length, speech rate and pausing in responses to questions asked by an IVA can help to distinguish between healthy controls and people with ND, and further distinguish between people with MCI and people with AD. It contributes to a significant line of research which has gained momentum in recent years.
The uncomplicated and accessible approach taken here has revealed patterns in the data which help to distinguish healthy controls and people with ND, including people with MCI and people with AD. It has been found that people with MCI spoke fewer words compared to healthy controls, and people with AD and people with MCI spoke for less time than healthy controls. People with AD spoke at a slower rate than people with MCI and healthy controls. Furthermore, there were significant differences across all three groups for the proportion of time spent pausing and the average pause duration: healthy controls displayed the lowest and people with AD displayed the highest proportion of time spent pausing and the longest average pause duration. Logistic regression identified two variables that explained the most variance, both relating to response length, and the model correctly predicted 76.6% of cases of neurodegenerative disorder.
Several characteristics of this study set it apart from other work in this area. The data collection process involves using an IVA, hence not requiring a clinician or human to collect the data, which is crucial in healthcare where there is limited time to manage the current demand on memory assessment pathways. The variables were selected because they relate in fairly straightforward ways to speech characteristics to which human listeners will have some sensitivity. The variables may therefore reflect features which memory assessment clinicians already utilise during consultation but cannot quantify. The results have been presented in such a way that each participant’s measure on each variable can be seen allowing the variability within the data to be appreciated. The visualisations which have been presented do not require specialist knowledge to interpret. The aim of taking these steps has been to make the procedures and findings as accessible as possible, to as wide a range of researchers as possible and to allow technical measures to be translated into a meaningful report for clinicians.
Acknowledgments
We would like to thank all participants and care partners who took part in this study.
Disclosure statement
No potential conflict of interest was reported by the author(s).
Correction Statement
This article has been corrected with minor changes. These changes do not impact the academic content of the article.
Additional information
Funding
References
- Al-Hameed, S., Benaissa, M., Christensen, H., Mirheidari, B., Blackburn, D., Reuber, M., & Ginsberg, S. D. (2019). A new diagnostic approach for the identification of patients with neurodegenerative cognitive complaints. PLOS ONE, 14(5), e0217388. https://doi.org/10.1371/journal.pone.0217388
- Ash, S., & Grossman, M. (2015). Why study connected speech production? In R. M. Willems (Ed.), Cognitive neuroscience of natural language use (pp. 29–58). Cambridge University Press. https://doi.org/10.1017/cbo9781107323667.003
- Ash, S., Moore, P., Vesely, L., & Grossman, M. (2007). The decline of narrative discourse in Alzheimer’s disease. Brain and Language, 103(1), 181–182. https://doi.org/10.1016/j.bandl.2007.07.105
- Barnes, R. K., Jepson, M., Thomas, C., Jackson, S., Metcalfe, C., Kessler, D., & Cramer, H. (2018). Using conversation analytic methods to assess fidelity to a talk-based healthcare intervention for frequently attending patients. Social Science & Medicine, 206, 38–50. https://doi.org/10.1016/j.socscimed.2018.04.008
- Beltrami, D., Gagliardi, G., Favretti, R. R., Ghidoni, E., Tamburini, F., & Calzà, L. (2018). Speech analysis by natural language processing techniques: A possible tool for very early detection of cognitive decline? Frontiers in Aging Neuroscience, 10, 369. https://doi.org/10.3389/fnagi.2018.00369
- Boersma, P., & Weenink, D. (2023). Praat: Doing phonetics by computer [Computer Program]. https://www.fon.hum.uva.nl/praat/
- Boschi, V., Catricala, E., Consonni, M., Chesi, C., Moro, A., & Cappa, S. F. (2017). Connected speech in neurodegenerative language disorders: A review. Frontiers in Psychology, 8, 1–21. https://doi.org/10.3389/fpsyg.2017.00269
- Bschor, T., Kühl, K.-P., & Reischies, F. M. (2001). Spontaneous speech of patients with dementia of the Alzheimer type and mild cognitive impairment. International Psychogeriatrics, 13(3), 289–298. https://doi.org/10.1017/s1041610201007682
- Burnham, D., Joeffry, S., & Rice, L. (2010). Computer- and human-directed speech before and after correction. In Proceedings of the 13th Australasian International Conference on Speech Science and Technology (pp. 13–17). https://assta.org/
- Carlomagno, S., Santoro, A., Menditti, A., Pandolfi, M., & Marini, A. (2005). Referential communication in Alzheimer’s type dementia. Cortex, 41(4), 520–534. https://doi.org/10.1016/S0010-9452(08)70192-8
- Coupé, C., Oh, Y. M., Dediu, D., & Pellegrino, F. (2019). Different languages, similar encoding efficiency: Comparable information rates across the human communicative niche. Science Advances, 5(9). https://doi.org/10.1126/sciadv.aaw2594
- Crutch, S. J., Lehmann, M., Warren, J. D., & Rohrer, J. D. (2013). The language profile of posterior cortical atrophy. Journal of Neurology, Neurosurgery & Psychiatry, 84(4), 460–466. https://doi.org/10.1136/jnnp-2012-303309
- Cuetos, F., Arango-Lasprilla, J. C., Uribe, C., Valencia, C., & Lopera, F. (2007). Linguistic changes in verbal expression: A preclinical marker of Alzheimer’s disease. Journal of the International Neuropsychological Society, 13(3), 433–439. https://doi.org/10.1017/S1355617707070609
- De Looze, C., & Hirst, D. (2008). Detecting changes in key and range for the automatic modelling and coding of intonation. In Proceedings of 4th International Conference on Speech Prosody (pp. 135–138). https://www.isca-speech.org/archive/speechprosody_2008/
- Dunn, R. H. (2023). Espeak-Ng [Computer Program]. https://github.com/espeak-ng
- Elsey, C., Drew, P., Jones, D., Blackburn, D., Wakefield, S., Harkness, K., Venneri, A., & Reuber, M. (2015). Towards diagnostic conversational profiles of patients presenting with dementia or functional memory disorders to memory clinics. Patient Education and Counseling, 98(9), 1071–1077. https://doi.org/10.1016/j.pec.2015.05.021
- Fraser, K. C., Fors, K. L., Eckerström, M., Öhman, F., & Kokkinakis, D. (2019). Predicting MCI status from multimodal language data using cascaded classifiers. Frontiers in Aging Neuroscience, 11, 10. https://doi.org/10.3389/fnagi.2019.00205
- Hirst, D., & De Looze, C. (2021). Fundamental frequency and pitch. In R.-A. Knight & J. Setter (Eds.), The Cambridge handbook of phonetics (pp. 336–361). Cambridge University Press. https://doi.org/10.1017/9781108644198.014
- Hoffmann, I., Nemeth, D., Dye, C. D., Pakaski, M., Irinyi, T., & Kalman, J. (2010). Temporal parameters of spontaneous speech in Alzheimer’s disease. International Journal of Speech-Language Pathology, 12(1), 29–34. https://doi.org/10.3109/17549500903137256
- Jones, D., Drew, P., Elsey, C., Blackburn, D., Wakefield, S., Harkness, K., & Reuber, M. (2016). Conversational assessment in memory clinic encounters: Interactional profiling for differentiating dementia from functional memory disorders. Aging & Mental Health, 20(5), 500–509. https://doi.org/10.1080/13607863.2015.1021753
- Jones, D., Wilkinson, R., Jackson, C., & Drew, P. (2019). Variation and interactional non-standardization in neuropsychological tests: The case of the Addenbrooke’s cognitive Examination. Qualitative Health Research, 30(3), 458–470. https://doi.org/10.1177/1049732319873052
- Khodabakhsh, A., Yesil, F., Guner, E., & Demiroglu, C. (2015). Evaluation of linguistic and prosodic features for detection of Alzheimer’s disease in Turkish conversational speech. EURASIP Journal on Audio, Speech, and Music Processing, 2015(1). https://doi.org/10.1186/s13636-015-0052-y
- König, A., Satt, A., Sorin, A., Hoory, R., Toledo-Ronen, O., Derreumaux, A., Manera, V., Verhey, F., Aalten, P., Robert, P. H., & David, R. (2015). Automatic speech analysis for the assessment of patients with predementia and Alzheimer’s disease. Alzheimer’s & Dementia: Diagnosis, Assessment & Disease Monitoring, 1(1), 112–124. https://doi.org/10.1016/j.dadm.2014.11.012
- Laver, J. (1994). Principles of phonetics. Cambridge University Press.
- López de Ipiña, K., Alonso-Hernández, J. B., Solé-Casals, J., Travieso-González, C. M., Ezeiza, A., Faundez-Zanuy, M., Calvo, P. M., & Beitia, B. (2015). Feature selection for automatic analysis of emotional response based on nonlinear speech modeling suitable for diagnosis of Alzheimer’s disease. Neurocomputing, 150, 392–401. https://doi.org/10.1016/j.neucom.2014.05.083
- López de Ipiña, K., Alonso, J.-B., Solé-Casals, J., Barroso, N., Henriquez, P., Faundez-Zanuy, M., Travieso, C. M., Ecay-Torres, M., Martínez-Lage, P., & Eguiraun, H. (2013). On automatic diagnosis of Alzheimer’s disease based on spontaneous speech analysis and emotional temperature. Cognitive Computation, 7(1), 44–55. https://doi.org/10.1007/s12559-013-9229-9
- López de Ipiña, K., Solé-Casals, J., Eguiraun, H., Alonso, J., Travieso, C., Ezeiza, A., Barroso, N., Ecay-Torres, M., Martinez-Lage, P., & Beitia, B. (2015). Feature selection for spontaneous speech analysis to aid in Alzheimer’s disease diagnosis: A fractal dimension approach. Computer Speech & Language, 30(1), 43–60. https://doi.org/10.1016/j.csl.2014.08.002
- Marcinkevičs, R., & Vogt, J. E. (2023). Interpretable and explainable machine learning: A methods-centric overview with concrete examples. WIREs Data Mining and Knowledge Discovery, 13(3). https://doi.org/10.1002/widm.1493
- Martı́nez-Nicolás, I., Llorente, T. E., Martı́nez-Sánchez, F., & Meilán, J. J. G. (2021). Ten Years of research on automatic voice and speech analysis of people with Alzheimer’s disease and mild cognitive impairment: A systematic review article. Frontiers in Psychology, 12. https://doi.org/10.3389/fpsyg.2021.620251
- Mirheidari, B., Blackburn, D., Harkness, K., Walker, T., Venneri, A., Reuber, M., & Christensen, H. (2017). An avatar-based system for identifying individuals likely to develop dementia. Proceedings of the 18th Annual Conference of the International Speech Communication Association (Interspeech 2017) (pp. 3147–3151). https://doi.org/10.21437/Interspeech.2017-690
- Mirheidari, B., Blackburn, D., O’Malley, R., Walker, T., Venneri, A., Reuber, M., & Christensen, H. (2019). Computational cognitive assessment: Investigating the use of an intelligent virtual agent for the detection of early signs of dementia. In IEEE International Conference on Acoustics, Speech and Signal Processing (ICASSP) 2019. https://doi.org/10.1109/ICASSP.2019.8682423
- Mirheidari, B., Blackburn, D., Walker, T., Reuber, M., & Christensen, H. (2019). Dementia detection using automatic analysis of conversations. Computer Speech & Language, 53, 65–79. https://doi.org/10.1016/j.csl.2018.07.006
- Müller, S., Mychajliw, C., Reichert, C., Melcher, T., Leyhe, T., & Alexopoulos, P. (2016). Autobiographical memory performance in Alzheimer’s disease depends on retrieval frequency. Journal of Alzheimer’s Disease, 52(4), 1215–1225. https://doi.org/10.3233/jad-151071
- Nasrolahzadeh, M., Mohammadpoory, Z., & Haddadnia, J. (2018). Higher-order spectral analysis of spontaneous speech signals in Alzheimer’s disease. Cognitive Neurodynamics, 12(6), 583–596. https://doi.org/10.1007/s11571-018-9499-8
- O’Malley, R., Mirheidari, B., Harkness, K., Reuber, M., Venneri, A., Walker, T., Christensen, H., & Blackburn, D. (2020). Fully automated cognitive screening tool based on assessment of speech and language. Journal of Neurology, Neurosurgery & Psychiatry, 92(1), 12–15. https://doi.org/10.1136/jnnp-2019-322517
- Orimaye, S. O., Wong, J. S.-M., & Golden, K. J. (2014). Learning predictive linguistic features for Alzheimer’s disease and related dementias using verbal utterances. Proceedings of the Workshop on Computational Linguistics and Clinical Psychology: From Linguistic Signal to Clinical Reality. https://doi.org/10.3115/v1/W14-3210
- Python Software Foundation. (2023). Python [Computer Program]. https://www.python.org/
- Qiao, Y., Xie, X.-Y., Lin, G.-Z., Zou, Y., Chen, S.-D., Ren, R.-J., Wang, G., & Yu, J.-T. (2020). Computer-assisted speech analysis in mild cognitive impairment and Alzheimer’s disease: A pilot study from Shanghai, China. Journal of Alzheimer’s Disease, 75(1), 211–221. https://doi.org/10.3233/JAD-191056
- R Foundation for Statistical Computing. (2023). R: A language and environment for statistical computing [Computer Program]. https://www.R-project.org/
- Sajjadi, S. A., Patterson, K., Tomek, M., & Nestor, P. J. (2012). Abnormalities of connected speech in semantic dementia vs Alzheimer’s disease. Aphasiology, 26(6), 847–866. https://doi.org/10.1080/02687038.2012.654933
- Singh, S., Bucks, R. S., & Cuerden, J. M. (2001). Evaluation of an objective technique for analysing temporal variables in DAT spontaneous speech. Aphasiology, 15(6), 571–583. https://doi.org/10.1080/02687040143000041
- Tóth, L., Hoffmann, I., Gosztolya, G., Vincze, V., Szatlóczki, G., Bánréti, Z., Pákáski, M., & Kálmán, J. (2018). A speech recognition-based solution for the automatic detection of mild cognitive impairment from spontaneous speech. Current Alzheimer Research, 15(2), 130–138. https://doi.org/10.2174/1567205014666171121114930
- Vincze, V., Szatlóczki, G., Tóth, L., Gosztolya, G., Pákáski, M., Hoffmann, I., & Kálmán, J. (2021). Telltale silence: Temporal speech parameters discriminate between prodromal dementia and mild Alzheimer’s disease. Clinical Linguistics & Phonetics, 35(8), 727–742. https://doi.org/10.1080/02699206.2020.1827043
- Walker, G., Morris, L.-A., Christensen, H., Mirheidari, B., Reuber, M., & Blackburn, D. (2021). Characterising spoken responses to an intelligent virtual agent by persons with mild cognitive impairment. Clinical Linguistics & Phonetics, 35(3), 237–252. https://doi.org/10.1080/02699206.2020.1777586
- Walker, T., Christensen, H., Mirheidari, B., Swainston, T., Rutten, C., Mayer, I., Blackburn, D., & Reuber, M. (2018). Developing an intelligent virtual agent to stratify people with cognitive complaints: A comparison of human–patient and intelligent virtual agent–patient interaction. Dementia, 19(4), 1173–1188. https://doi.org/10.1177/1471301218795238
- Yancheva, M., Fraser, K., & Rudzicz, F. (2015). Using linguistic features longitudinally to predict clinical scores for Alzheimer’s disease and related dementias. In Proceedings of the 6th Workshop on Speech and Language Processing for Assistive Technologies. https://doi.org/10.18653/v1/w15-5123