
ABSTRACT
Speech training apps are being developed that provide automatic feedback concerning children’s production of known target words, as a score on a 1–5 scale. However, this ‘goodness’ scale is still poorly understood. We investigated listeners’ ratings of ‘how many stars the app should provide as feedback’ on children’s utterances, and whether listener agreement is affected by clinical experience and/or access to anchor stimuli. In addition, we explored the association between goodness ratings and clinical measures of speech accuracy; the Percentage of Consonants Correct (PCC) and the Percentage of Phonemes Correct (PPC). Twenty speech-language pathologists and 20 non-expert listeners participated; half of the listeners in each group had access to anchor stimuli. The listeners rated 120 words, collected from children with and without speech sound disorder. Concerning reliability, intra-rater agreement was generally high, whereas inter-rater agreement was moderate. Access to anchor stimuli was associated with higher agreement, but only for non-expert listeners. Concerning the association between goodness ratings and the PCC/PPC, correlations were moderate for both listener groups, under both conditions. The results indicate that the task of rating goodness is difficult, regardless of clinical experience, and that access to anchor stimuli is insufficient for achieving reliable ratings. This raises concerns regarding the 1–5 rating scale as the means of feedback in speech training apps. More specific listener instructions, particularly regarding the intended context for the app, are suggested in collection of human ratings underlying the development of speech training apps. Until then, alternative means of feedback should be preferred.
Background
Auditory-perceptual evaluation of speech production is central in the assessment of children’s speech, whether to identify a speech disorder, to assess the severity of a speech disorder, or to assess whether a child is making progress during speech therapy. During the last decade, speech training apps have been suggested to expedite intervention for children with speech sound disorder (SSD), as well as for training of pronunciation in second-language learning (Byun et al., Citation2017; Getman, Phan, et al., Citation2023; Jesus et al., Citation2019; Karhila et al., Citation2017; McKechnie et al., Citation2018; McLeod et al., Citation2023; Shahin et al., Citation2015). In some cases, automatic speech recognition (ASR) is integrated in the app, to provide children with automatic feedback on their production of target words. This feedback can be expressed as a score on an ordinal scale, for example as 3 out of 5 stars (as in Getman, Al-Ghezi, et al., Citation2023; Karhila et al., Citation2017). Although such a score may be intuitive for the app user, one may question what construct the score represents. For sure, holistic evaluation of children’s speech with reference to an n-point scale differs from perceptual assessments speech-language pathologists (SLPs) usually do (Jing & Grigos, Citation2022; Sakash et al., Citation2023). For non-SLPs, the task can be expected to be even more unfamiliar. In this paper, we explore how SLPs and other, non-expert, adults use such a scale, when faced with the task of deciding how they think, in the future, a speech training app should evaluate children’s production of known target words.
The evaluation of how ‘good’ a child’s production of a given word is can take different forms. In clinical practice, evaluation of speech accuracy is a central part of the assessment (Preston et al., Citation2011; Shriberg et al., Citation1997). Speech accuracy (or ‘speech sound accuracy’) refers to the degree of phonetic match between the child’s way of producing a target word, and an assumed target word form (Preston et al., Citation2011; Sakash et al., Citation2023). As such, this is an assessment on a phonetic level, with reference to known target words. Another aspect that may be included in a goodness evaluation is the assessment of speech intelligibility, that is, the extent to which a spoken message can be correctly recovered by a listener (Hustad et al., Citation2021; Kent et al., Citation1994; Lagerberg et al., Citation2019). In contrast to accuracy, intelligibility reflects a lexical-level assessment, typically based on target words that are not known to the listener (Kent et al., Citation1994; Lagerberg et al., Citation2019). While constituting different constructs, these constructs may converge. In contexts where the target word is known, but where there is no phonetic match between an observed production and the target form (i.e. minimum accuracy), the observed production can be expected to be unrecognisable as the target word also on a lexical level (i.e. minimum intelligibility). Apart from accuracy and intelligibility, the evaluation of goodness may also be influenced by listeners’ attitudes towards the speech they evaluate. This aspect of speech is sometimes referred to as speech acceptability (Henningsson et al., Citation2008; Strömbergsson et al., Citation2021). In contexts where a target word is produced such that listeners do not confuse it for another word (i.e. high intelligibility) and do not perceive any phonetic errors (i.e. high accuracy), listeners may still pick up nuances in the speaker’s way of producing the word that they perceive as unexpected or imperfect (i.e. reduced acceptability). Hence, ‘goodness’ is a complex construct, that may conflate aspects of speech accuracy with aspects of intelligibility and acceptability. This illustrates one of the challenges in accruing and evaluating assessment of goodness.
In clinical practice, assessment of speech accuracy is typically based on clinicians’ perceptual evaluation of children’s production of a closed set of known single-word items (McLeod & Baker, Citation2014; Skahan et al., Citation2007; Wikse Barrow et al., Citation2021). The evaluation of speech accuracy for each word item can then be documented with respect to transcription-based measures such as the Percentage of Consonants Correct (PCC) and/or the Percentage of Phonemes Correct (PPC) (Shriberg & Kwiatkowski, Citation1982; Shriberg et al., Citation1997). Such measures are holistic measures of speech sound accuracy, in the sense that they represent the overall degree of segmental match between observed and expected pronunciation. As established holistic measures of speech accuracy, the PCC and the PPC are often used as reference measures when exploring related aspects of speech (e.g. Lagerberg et al., Citation2021; McLeod, Citation2020). When evaluating automatic assessment in future speech training apps, however, developers should be aware that the measures have shortcomings.
One challenge in evaluating automatic assessment relates to the scope and sensitivity of the assessment. During speech intervention, clinicians’ evaluation of speech accuracy is often tailored to the focus of the intervention. Specifically, the clinician may direct their attention to specific target sounds, and evaluate whether the child’s production of these sounds is approaching the desired form, while disregarding non-targeted sounds (Hall et al., Citation1998). For example, in intervention targeting fronting of velar sounds (i.e. where a child produces/k, g, ŋ/with a more anterior place of articulation [t, d, n]), many clinicians would evaluate a child’s production [kɪt] for ‘kiss’ as successful, as the initial consonant matches the desired place of articulation as/k/(for related examples, see Dodd et al., Citation2008; Furlong et al., Citation2018). In this context, the clinician’s narrow scope of assessment would most likely disregard the misarticulation of the final/s/, whereas a holistic measure of speech accuracy (e.g. the PCC) would not. Moreover, during intervention clinicians may also recognise subtle improvements in speech production when the child approximates the target – detail which may go unregistered in transcription-based documentation (Jing & Grigos, Citation2022; Munson et al., Citation2010). For example, in a clinical setting targeting fronting of velar sounds, the clinician may register that a child’s production of the target/k/is qualitatively different (e.g. produced with a more distributed tongue-palate contact, see Cleland & Scobbie, Citation2021) from the child’s production of target/t/, and provide feedback accordingly. This feedback would acknowledge the child’s fine-phonetic signalling of phonological contrast, while, again, a less sensitive measure such as the PCC would not. Hence, the clinical evaluation of speech accuracy is adapted to the context and purpose of the assessment, which is why clinicians are trained to evaluate children’s production of isolated words with different scope and at different levels of detail. Essential to the focus of the present study, evaluation of automatic assessments needs to be informed of the scope and sensitivity of the assessment.
Although rating scales have been suggested for use in goodness evaluation by some (Jing & Grigos, Citation2022; Maas & Farinella, Citation2012; Meyer & Munson, Citation2021; Sakash et al., Citation2023; Schellinger et al., Citation2017), their use remains limited. Furthermore, only one of the rating scales we are aware of has been used to document holistic assessment of goodness, namely the 7-point ‘articulatory goodness’ rating scale described by Sakash et al. (Citation2023). In their study, listeners were instructed to document their rating of children’s articulation of single word items onto this scale, with end points 1 = ‘very poor’, to 7 = ‘very good’. The participating listeners were naïve, in the sense that they did not have more than incidental experience of listening to or interacting with, individuals with communication disorders (Sakash et al., Citation2023). Interestingly, and of relevance to the present study, the listener ratings of ‘articulatory goodness’ corresponded strongly with single-word intelligibility scores, and less strongly (but still significantly) with clinical measures of speech accuracy. As this rating scale bears strong resemblance to the rating scale examined in the present paper, one could suspect that they measure similar constructs. The fact that the rating scale is poorly studied, however, merits further investigation into its use and interpretation.
Although still not widely available, speech training apps have been developed with integrated ASR technology to provide children with automatic feedback on their production of known target words. In the research we are aware of, this feedback is presented as a binary correct/incorrect response (e.g. as a happy or sad face as in Ahmed et al., Citation2018; Navarro-Newball et al., Citation2014), or as an ordinal accuracy score on an n-point scale (e.g. as x out of n stars as in Getman, Phan, et al., Citation2023; Junttila et al., Citation2022; Karhila et al., Citation2019). Underlying the feedback presented to the app user are acoustic models derived from human evaluations of speech samples. Typically, these human evaluations are made with reference to the same scale by which feedback is presented to the app user. Getman, Phan, et al. (Citation2023) describe the development and evaluation of acoustic models underlying the automatic assessment of children’s one-word utterances on a 1–5 scale (reflecting user feedback presented as 1 to 5 filled stars). From their description, it is clear that the task of rating children’s one-word utterances with reference to this 1–5 scale was challenging for the human evaluator (a trained speech-language pathologist); when re-evaluating a 20% subset of the samples, the agreement with first evaluations was modest (Getman, Phan, et al., Citation2023). A possible explanation why the evaluation was challenging, is uncertainty regarding what construct it sets out to measure. This asserts the need for further investigation of the suggested rating scale. In addition, it opens questions regarding the quality of the automatic assessments derived from the expert human evaluations.
Regardless of whether speech is assessed by human evaluators or automatically, validity and reliability are central indicators of the quality of assessment. Validity refers to the degree to which an assessment indeed measures what it sets out to measure (Mokkink et al., Citation2010). Given that the ‘goodness’ construct is elusive, selecting a ‘gold standard’ reference measure for validation is not trivial. From the above, however, it is clear that speech accuracy is, at least, a highly related construct. When exploring the validity of alternative measures purporting to measure speech accuracy, the PCC is often used as a reference (see e.g. Öster Cattu Alves et al., Citation2020; Preston et al., Citation2011), with strong agreement with the PCC assumed to reflect high validity of the proposed measure. Another reference candidate is the PPC. In contexts where not only consonants are taken into account, the PPC may in fact be better suited as a reference measure (Shriberg et al., Citation1997, Citation2019). Hence, although neither the PCC nor the PPC matches clinicians’ adaptivity in evaluating speech in a speech training context, they are both given ‘gold standard’ candidates when assessing the quality of human and automatic evaluations of speech ‘goodness’.
Reliability refers to ‘the degree to which the measurement is free from measurement error’ (Mokkink et al., Citation2010, p. 743). In the context of evaluating speech, reliability typically refers to the agreement between different evaluators in their assessments (i.e. inter-rater reliability), and for the same evaluator at different timepoints (i.e. intra-rater reliability). In training acoustic models for automatic assessment of children’s speech, reliability in listener evaluations is key. If listener evaluations fed into training are not reliable, that is, if other evaluators would not agree with the evaluations fed into training, the resulting acoustic models would most likely generate automatic assessments that are less reliable. Therefore, in the development of automatic assessment of children’s speech, spending efforts to increase reliability can be worthwhile.
One condition which may be beneficial for reliability is listener experience. The benefit of training and experience has, for example, been observed as better agreement between ratings and acoustic cues among speech-language pathologists (SLPs) compared to untrained listeners (Coniglio et al., Citation2022; Klein et al., Citation2012; Munson et al., Citation2012). Higher rating consistency among SLPs is often also reflected as higher levels of inter- and intra-reliability when compared to other adults (Brunnegård et al., Citation2009; Lewis et al., Citation2003; Munson et al., Citation2012). For example, in their investigation of experienced and inexperienced listeners’ ratings of nasal resonance and airflow, Brunnegård et al. (Citation2009) report this pattern; however, they also note that while the inexperienced listeners often disagreed on the exact rating scores, they tended to agree on the ranking of samples. The higher rating consistency often seen in experienced listeners may be interpreted as a consequence of training and experience, resulting in a calibration of the listeners’ internal standards towards a perceptual standard shared within their professional community (see e.g. Kreiman et al., Citation1993; Strömbergsson et al., Citation2021). There are, however, also reports finding no reliability advantage for SLPs over other listeners (Aakko et al., Citation2023; Brown et al., Citation2018). This pattern may be expected particularly in evaluation tasks that SLPs are not typically trained to do, or have experience with. In an evaluation such as the one in the present study, where the evaluation task is presumably unfamiliar both to SLPs and to other adults, it is uncertain whether clinical experience and training is beneficial for reliability.
Another condition that has been found favourable for reliability is anchor stimuli (Eadie & Kapsner-Smith, Citation2011; Gerratt et al., Citation1993). The motivation for using anchors is that, in cases where listeners’ internal standards are unstable, the stimuli may function as an external standard, to which the listeners’ perception can be attuned (Eadie & Kapsner-Smith, Citation2011). In their study of experienced and inexperienced adult listeners’ ratings of dysphonia in adult speakers, Eadie and Kapsner-Smith (Citation2011) observed that listeners’ access to anchor stimuli increased both intra- and intra-reliability, and levelled the difference between listener groups. Similar beneficial effects of anchor stimuli have been reported also in other studies involving the perceptual assessments of voice quality (Brinca et al., Citation2015; Chan & Yiu, Citation2002; Gerratt et al., Citation1993). Although there are apparent differences between these studies and the present (e.g. in terms of speech material and assessed feature), listeners can be assumed to have different internal standards also of ‘goodness’; therefore, access to anchor stimuli may be a way to increase reliability also for this construct.
Aim and research questions
The focus of the present investigation is human and automatic assessments of speech ‘goodness’, with reference to a 1–5 scale. Framing the listener task as one of determining how a future speech training app should score children’s production of isolated words, we aim to investigate the reliability of listener ratings, and to explore whether reliability is dependent on a) the listener’s experience, and/or b) whether the listener has access to anchor stimuli or not. In addition, we investigate the validity of both human and automatic assessments of speech ‘goodness’, through comparison to ‘gold standard’ measures of speech accuracy. The following research questions are explored:
Does intra-rater reliability vary depending on whether listeners have a) experience of evaluating speech accuracy, and/or b) access to anchor stimuli?
Does inter-rater reliability vary depending on whether listeners have a) experience of evaluating speech accuracy, and/or b) access to anchor stimuli?
How do listener assessments of speech ‘goodness’ compare to clinical measures of speech accuracy (specifically: the PCC and the PPC)?
How do automatic assessments of speech ‘goodness’ compare to clinical measures of speech accuracy (specifically: the PCC and the PPC)?
Method
The collection and management of recordings was approved by the Swedish Ethical Review Authority (registration number 2022–05299–01). In line with this, all recorded children and their parents provided their informed consent to participation. All participants were informed that they could withdraw their participation at any time, without any consequences. Apart from their signed consent, no personal identifying information about the participating listeners was collected, neither digitally nor in any other form. All listeners were compensated for their time with a cinema ticket.
Participants in listening experiment
Individuals in the age range 18–65 years, with Swedish as (one of their) mother tongue(s) were invited to participate as listeners, via advertisements in social media (Facebook), as well as through author MF’s social network. Listeners were recruited into one of two groups: speech-language pathologists (SLPs), or not SLPs (and also not having studied phonetics and/or linguistics), to fill a quota of 20 listeners in each group. As seen in , all but one of the listeners had self-reported normal hearing. (As a description of their hearing, this listener reported having tinnitus.) Half of the participants reported using another language apart from Swedish; among these, three reported that their strongest language was another language than Swedish.
Table 1. Demographic information of the listeners in the two listener groups: speech-language pathologists (SLP) and non-experts (OTHER).
Speech samples and listening scripts
A set of speech samples was compiled based on recordings of 4–7-year-old children with and without speech sound disorder within the TEFLON project (https://teflon.aalto.fi/) for the purpose of developing a speech training app. Specifically, the selection of speech samples for the present study were compiled from recordings of the 14 children that had been recorded by January 2023. For these recordings, 142 words containing fricatives (/s/, /ɧ/, /ɕ/ and /ʂ/), and velar sounds (/k/, /g/ and /ŋ/), had been selected as target words. These speech sounds were identified as targets for the speech training app, as they are affected by the speech error patterns velar fronting and stopping, which both occur frequently in early typical speech development and in children with speech sound disorders (see e.g. Rvachew & Brosseau-Lapré, Citation2017). The target words varied in complexity (50 monosyllabic, 68 bisyllabic, and 24 words containing three or more syllables) and concerning the position of target fricative (37 initial, 38 medial, and 26 final) and target velar sound (32 initial, 39 medial, and 34 final). For the recordings of the target words, the children were fitted with headphones and seated in front of a computer. The target words were presented one by one, with an illustration on the computer screen, and with an adult female model speaker’s production of the word presented to the child via headphones. The task for the child was, then, to repeat the presented word. The recordings were conducted by a research assistant (author MP, a certified SLP) in the children’s homes in the Stockholm region. (For one of the children, recordings were instead conducted by the child’s parent, an SLP colleague, in their home, outside of Stockholm.) All recordings were conducted with a TASCAM dr-22wl recorder, positioned on the table in front of the child, in a mono 44,100 Hz, 24-bit wav format.
In total, 2010 isolated words had been recorded, and were manually extracted from the original recordings in Audacity. The words were then perceptually evaluated with reference to a 1–5 scale, reflecting the feedback of the speech training app developed in the larger project. For guidance in these ratings, the levels of the scale were associated with verbal descriptions, with 1 representing a pronunciation that was not at all identifiable as the target word, 2 representing pronunciation that was difficult to identify as the target word, 3 representing slight phonemic error(s), 4 representing subphonemic error(s) or ‘unexpected variants’, and with 5 representing a prototypical, adult-like, pronunciation. Hence, levels 1 to 3 reflected evaluations involving both phonetic and lexical aspects, that is, phonetic mismatch to the extent that the produced speech sounds map on to different phonemic categories than the ones expected in the target pronunciation. Levels 4 and 5 were intended to reflect only phonetic aspects of the pronunciation, for cases similar enough to the expected target form not to risk lexical confusion. shows the distribution of the samples across these rating categories. Author MP conducted all ratings, and for all words not rated as 5, author SS (also a certified SLP) was invited to the evaluation, and a consensus decision was reached.
Table 2. Distribution of speech samples across the rating categories 1–5, in the original dataset, and after random selection for inclusion in the present study. Mean (min-max) values for Percentage Consonants Correct (PCC) and Percentage Phonemes Correct (PPC) are presented, for the 120 selected samples.
From the set of 2010 speech samples, 120 items were selected for inclusion in the present study, with the aim of having an even distribution of stimuli across the 1–5 scale. In rating categories represented by fewer than 24 items, all items were selected. In rating categories with more items, items were randomly selected. displays the distribution of the 120 samples across rating categories. illustrates examples of items, from each of the five categories. A description of all 120 items is presented as Supplementary data. To allow calculation of intra-rater reliability, eight randomly selected items from each rating category (1–5) were duplicated, adding up to 40 duplicated samples in total. Four different listening scripts were constructed, each with a different pseudo-random ordering of the samples. The randomisation was conducted with the 120 samples as one block, and the 40 duplicated samples in one block, to avoid consecutive presentations of the same sample. No other factor was controlled in the randomisation.
Table 3. Examples of items from the listening script, representing each of the rating categories 1 to 5, where 5 represents prototypical, or adult-like, pronunciation, and 1 represents a pronunciation which is not at all recognisable as the target word.
An additional five recordings – one per rating category 1–5 – were selected as anchor stimuli. These recordings were collected from a previously collected dataset (described in Getman, Phan, et al., Citation2023), and did not appear in the listening script. These samples were selected by authors MP and SS, who identified these as clearly matching the verbal descriptors of the rating categories 1–5.
Procedures
Evaluation of speech accuracy
Scoring of PCC and PPC was conducted by author SS, and then again (independently) by author MP. After one month, SS re-scored PCC and PPC. presents average (min-max) values for PCC and PPC across the different rating categories.
Listening experiment
Listening evaluations were conducted at a location of the participants’ choosing. Most often, this was in their offices, or in their homes. In a few cases, evaluations were conducted in a public place (at a library, and in a café, respectively), for the convenience of the participants. After having signed an informed consent, each listener was assigned an ID, which already had been associated beforehand with a listening condition (Anchor, or NoAnchor, see below) and one of the four listening script versions (see above). This way, the allocation of listeners to listening conditions (and listening scripts) was pseudorandom, determined by the timing of the listeners’ participation. The participants then filled out a digital form in REDCap (Harris et al., Citation2019) with demographic questions (see ).
Before starting the listening evaluation, the participants were fitted with headphones, and introduced to the listening task via a video-recorded instruction, tailored to their listening condition. Regardless of listening condition, all listeners were informed that their ratings would be collected for the development of an app that would give children feedback on their pronunciation with reference to 1–5 stars. The listeners’ task was to listen to words produced by children, and for each word, decide how many stars they thought the app should provide as feedback to the child. For guidance, they were instructed to think of 5 as representing “what you perceive as ’perfect’, ‘without remarks’, or, ‘fully in line with your expectations on how the word is pronounced’”, and of 1 as representing a pronunciation ‘which does not at all sound as you’d expect the word to be produced, where the word is not recognisable as the target word’. By intent, the instructions were worded with reference to both phonetic and lexical aspects of evaluation. The complete instructions are provided as Supplementary data. To encourage an intuitive use of the 1–5 scale, avoiding assumptions that there is a ‘correct’ use of the scale, the instructions did not contain any guidance concerning the intermediate levels of the scale. The listeners were informed that they would listen to 160 words, that they should listen to each word once, but were allowed to replay a word if they needed, for example, in case of any disturbance. Further, they were informed that they could take a break whenever they wanted. Listeners who had been assigned to the Anchor listening condition were instructed that they would have access to five reference recordings (in a separate browser window), where each recording represented a rating category (1–5). They were informed that they could listen to these reference recordings as many times as they liked, before and during the listening evaluation. After having been presented with the instruction video, the listeners were offered a chance to ask the experimenter for clarification, if needed, before starting the evaluation.
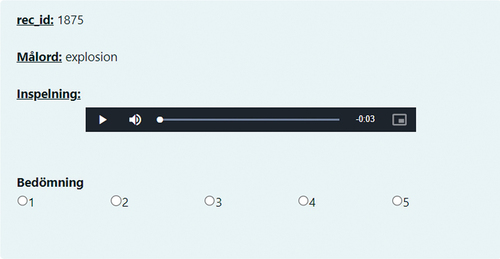
The listening evaluation was conducted on a Macbook Air, and listeners were fitted with Sony Stereo Headphones MDR-ZX660AP. (In a few cases, when two listeners wanted to conduct the evaluations at the same time, one of them instead conducted their evaluation on a Lenovo Ideapad 500S-3ISK, with Huawei Headphones AM115.) The evaluation was conducted in the learning platform Moodle, see . The listeners controlled the playback of the speech samples themselves, by tapping the play symbol (see ). In total, each listener session (introduction, evaluation and breaks included) took around 30 minutes.
Figure 1. The evaluation task as it appeared for the listeners in Moodle. The target word (Swe. ‘målord’) was presented (Swe. ‘explosion’, Eng. explosion), the listeners could control the playback of the recording, and provide their evaluation (Swe. ‘bedömning’) as one of the options 1–5.
Automatic assessment
The automatic system used to evaluate the 120 samples was based on acoustic models trained on ratings of 6027 different single-word items, produced by 28 Swedish children in the ages 4 to 10 years, with and without speech sound disorders. The ratings were conducted by a speech-language pathologist on a 1–5 scale, following the same procedure as described for the expert evaluations underlying the selection of samples for the present study (for details, see Getman, Phan, et al., Citation2023). The automatic system is an ensemble of two speech rating models; one of which is a deep neural network trained to predict the rating category of the input speech sample, while the other is a simple decision tree trained using the character error rate (CER) between the target word and the automatic speech recognition (ASR) output. The final predictions (i.e. ratings on a 1–5 scale) are then computed by combining the class probabilities of these two models. Technical details and performance evaluation of the automatic rating and ASR systems can be found in Getman, Al-Ghezi, et al. (Citation2023).
Analysis
Data was exported from Moodle to Excel. Responses to duplicated items were only included in the analysis of intra-rater reliability; for all other analyses, only listener ratings of the first presentation of items were included. All analyses were conducted in RStudio (RStudio Team, Citation2020).
Analyses of intra- and inter-rater reliability were computed across all listeners, as well as within subgroups (SLP vs. Other, and Anchor vs. NoAnchor). For the analysis of intra-rater reliability, two-way single-unit absolute agreement Intraclass Correlation Coefficient analyses, i.e. ICC(2), were conducted (Koo & Li, Citation2016). For the analysis of inter-rater reliability, ICC(2) analyses were conducted, similarly with single-unit, absolute agreement. For the interpretation of ICC results, we were guided by the thresholds suggested by Koo and Li (Citation2016), where values below 0.5 are interpreted as ‘poor’ reliability, values between 0.5 and 0.75 as ‘moderate’ reliability, values between 0.75 and 0.90 as ‘good’ reliability, and values higher than 0.9 are interpreted as ‘excellent’ reliability.
To explore the association between the listener ratings and clinical measures of speech accuracy, two-sided Pearson’s correlation analyses were calculated between listener ratings and PCC and PPC, respectively. For comparison, correlation analyses were calculated also between the reference ratings (i.e. the ratings conducted by two SLPs to guide the selection of listening stimuli) and the PCC and the PPC, respectively. Two-sided Pearson’s correlation analyses were also conducted for the association between the automatic assessments and PCC and PPC, respectively. Holm correction of p-values was used, to adjust for multiple comparisons. For the interpretation of correlation results, we used r ≥ .7 as a benchmark for validity, reflecting a ‘strong’ correlation (Mukaka, Citation2012).
Reliability
To assess the reliability of the ‘gold standard’ measures, the assessments of PCC and PPC, single-measure ICC(2) consistency analyses were conducted. Inter-rater reliability, that is, the agreement between the two authors’ (SS and MP) assessments of the 120 items, was .77 [.68–.83], p < 0.001 for PCC, and .78 [.70–.84], p < 0.001 for PPC. Intra-rater reliability, that is, the agreement between author SS’ first and second assessments of the 120 items, was .77 [.68–.83], p < 0.001 for PCC, and .82 [.75–.87], p < 0.001 for PPC. With reference to Koo and Li’s (Citation2016) suggested interpretation, these figures represent good reliability.
Results
The results are based on a total of 6395 goodness ratings, of which 800 were ratings of duplicate samples, and only included in the analysis of intra-rater reliability. Five data points were missing; two ratings from two listeners, and one rating from one listener. (All three listeners were in the non-expert group.)
Intra-rater reliability
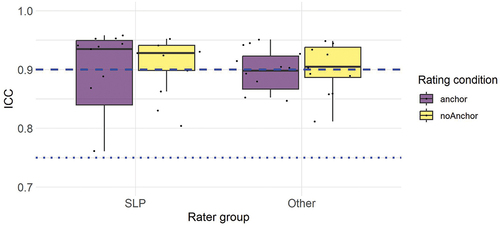
Intra-rater reliability was analysed by means of one ICC analysis per listener. presents ICC values for all listeners; details concerning confidence intervals and p-values are listed as Supplementary material. As shown in , all raters exhibit at least ‘good’ intra-rater reliability, and most also surpass the threshold for ‘excellent’ intra-rater reliability. Concerning potential differences between the rater groups and/or rating conditions, the figure illustrates that median values for the SLP group are somewhat higher than for the inexperienced listeners. In terms of average measures, however, the difference between the SLP group (M = .91, SD = .06) and the inexperienced group (M = .90, SD = .04) was minimal. Although all listeners surpassed the .75 threshold, it can be noted that the two listeners with the lowest intra-rater reliability (.76 and .80, respectively) were SLPs.
Figure 2. Intra-rater reliability for all listeners (N = 40) as a function of rater group (SLP vs. Other) and rating condition (Anchor vs. NoAnchor), as measured by a two-way random intraclass correlation, ICC(2), single measures. The dotted line represents ‘good’ reliability, and the dashed line represents ‘excellent’ reliability, as suggested by Koo and Li (Citation2016).
Inter-rater reliability
As shown in , inexperienced raters with access to anchor stimuli was the only group that surpassed the threshold for ‘good’ reliability. All other groups fell under the 0.75 threshold, and thus only reached ‘moderate’ inter-rater reliability. Differences between the rater groups (SLP vs. Other) are marginal, as are the differences between rating conditions (Anchor vs. NoAnchor). However, the numbers indicate an interaction effect, such that the rater groups are affected differently by the accessibility to anchor stimuli. Whereas access to anchor stimuli is associated with higher reliability for inexperienced raters, it is associated with lower reliability for the SLP raters.
Table 4. Inter-rater reliability for both rater groups (SLP and Other, respectively) and for both rating conditions (Anchor and NoAnchor, respectively), as measured by a two-way random intraclass correlation, ICC(2), single measures.
Correlation between ratings and ‘gold standard’ measures of speech accuracy
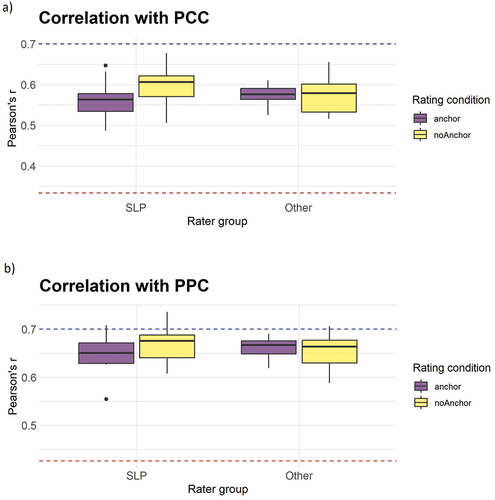
Correlations between ratings and ‘gold standard’ measures PCC and PPC were analysed per listener. Correlation coefficients are presented in ) whereas details (degrees of freedom, confidence intervals and p-values) are presented as Supplementary material. illustrate the variation in correlation strength for the listeners’ ratings when compared to the ‘gold standard’ measures PCC and the PPC, respectively. As the figures show, the correlations are moderate, although higher for the PPC (average, across all listeners: .66) than for the PCC (average, across all listeners: .57). This holds across both listener groups and listening conditions. In very few cases (4 out of 80), the correlation between a listener rating and the PCC or the PPC exceeded the threshold of .7. For complete results, including correlation coefficients, confidence intervals and p-values for individual listeners, see Supplementary data.
Figure 3. The variation in correlation strength between listener ratings and a) the Percentage of Consonants Correct (PCC), and b) the Percentage of Phonemes Correct (PPC), presented per rater group (Slp/other) and rating condition (Anchor/NoAnchor). The blue dashed line represents the threshold for ‘strong’ correlation, as suggested by Mukaka (Citation2012). The red dashed line represents the level of the correlation between the automatic assessment and the PCC and PPC, respectively.
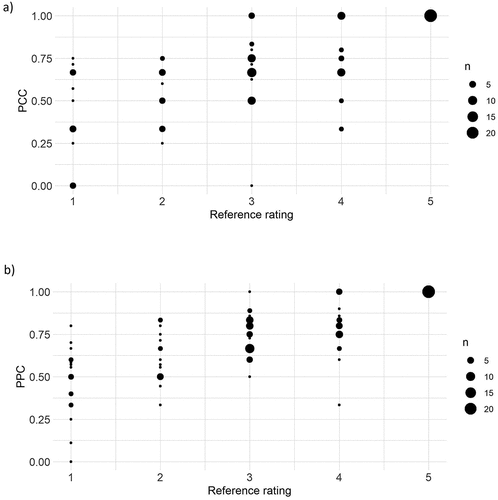
For comparison, illustrate the correlation between the reference ratings and the PCC and the PPC, respectively. The correlation between the reference ratings and the PCC was .71 [.61–.79], p < 0.001, and between the reference ratings and the PPC .78 [.70–.84], p < 0.001. Hence, these correlations were stronger than those between the listener ratings and the ‘gold standard’ measures. Again, the correlation between the reference ratings and the PPC is stronger than that between the reference ratings and the PCC.
Figure 4. Correlation between reference ratings and a) the Percentage of Consonants Correct (PCC), and b) the Percentage of Phonemes Correct (PPC).
Correlation between automatic assessments and ‘gold standard’ measures of speech accuracy
Concerning the association between the automatic assessments and the ‘gold standard’ measures of speech accuracy, correlations were weak, both for the PCC (.33, [.16–.48], p < 0.001), and for the PPC (.43, [.27–.56], p < 0.001), see .
Discussion
We investigated listeners’ holistic ratings of ‘goodness’ in children’s production of known isolated words, and whether reliability of ratings was dependent on the listeners’ clinical experience, and on whether they had access to anchor stimuli or not. Our results show that regardless of experience and access to anchor stimuli, intra-rater reliability was generally good (for most listeners ‘excellent’). In terms of inter-rater reliability, however, reliability was moderate; only inexperienced listeners with access to anchor stimuli reached ‘good’ reliability. Although the results are based on subgroups of only 9–11 individuals, the results suggest an interaction, with access to anchor stimuli being more beneficial for inexperienced listeners than for SLP listeners. Further, we examined the validity of the listeners’ assessments, as well as of automatic assessments, through comparison to ‘gold standard’ measures of speech accuracy. Our results showed moderate correlations between the listener ratings and the ‘gold standard’ measures, although stronger for the PPC than for the PCC. Given the speech sound general nature of the PPC, and the consonant-focused nature of the PCC, this pattern was expected. For the automatic assessments, the correlations to both ‘gold standard’ measures were weak.
The finding that intra-rater reliability was generally high reflects a consistent rating behaviour in each individual listener. No reliability advantage for the listener group with clinical experience was seen. The fact that all listeners were generally quite consistent in their ratings, and that the evaluation task was equally unfamiliar to listeners in both groups, may account for this observation. However, the finding is inconsistent with some earlier reports (Helou et al., Citation2010; Lewis et al., Citation2003; Munson et al., Citation2012), while line with others (Aakko et al., Citation2023; Brown et al., Citation2018). The fact that previous reports differ from the present study in terms of the speech phenomenon in focus (voice characteristics in Helou et al., Citation2010; nasal resonance in Lewis et al., Citation2003; phonetic category goodness in Aakko et al., Citation2023; Munson et al., Citation2012; syllable segregation in Brown et al., Citation2018), as well as in terms of listening task and listener instructions, makes it difficult to identify common denominators. A general pattern, however, shared by both the present study and previous studies not reporting a reliability advantage for experienced listeners (Aakko et al., Citation2023; Brown et al., Citation2018), is levels of intra-rater reliability that are generally ‘good’ or ‘excellent’. For the reports showing a reliability advantage for experienced listeners, the levels of reliability are generally lower.
The finding that access to anchor stimuli was associated with higher inter-rater agreement among inexperienced listeners, but not among SLP listeners is noteworthy. Indeed, the beneficial effect of anchors among inexperienced listeners aligns with the idea that they have unstable internal standards, and therefore, may attune to external perceptual anchors (see e.g. Eadie & Kapsner-Smith, Citation2011). The finding that the experienced listeners did not benefit from access to anchors, however, deserves attention. One possibility is that the selection and positioning of anchor stimuli onto the rating scale did not match the SLP listeners’ expectations. As argued by Granqvist (Citation2003), anchor stimuli are only helpful if they align with listeners’ expectations of their position on the rating scale. Granqvist (Citation2003) lists some challenges in selecting anchor stimuli. For one, there are rarely any objective measures on where a specific speech sample should be positioned along the rating scale. Although the PCC and the PPC are suggested as ‘gold standard’ measures of speech accuracy, it should be clear from the introduction that they both have shortcomings, which may obscure their correspondence with positions on a rating scale. Another challenge is that speech samples often vary along more than one dimension, making it difficult to map their ordering onto a unidimensional scale. For example, a child’s production of a target word may not only contain a portion of segmental ‘errors’ but may also contain unexpected vocal features. Hence, using a unidimensional rating scale, and accepting anchor stimuli as representations of the different scale steps may be challenging for listeners who have experience of evaluating speech with other means of assessment. Although it cannot be ruled out that the experienced listeners disagreed with the selection and positioning of anchor stimuli, it would be unexpected, as the selection of anchor stimuli was done by two SLP colleagues, both experienced in assessing children’s speech. An alternative explanation is that the listeners in the SLP group relied on their own internal standards, and did not make use of their access to anchor stimuli. As the listeners’ use of the anchor stimuli was not tracked, however, this possible explanation remains speculative.
Regarding the interpretation of the analysis of reliability, different thresholds for what represents ‘good’ reliability have been used. For example, Alighieri et al. (Citation2021) and colleagues have used the classification of Altman (Citation1990), with values between .61 and .8 representing ‘good’ reliability. With this interpretation, all but two listeners (both SLPs) would have surpassed the .81 threshold for ‘very good’ intra-rater reliability (see ). Similarly, if Altman’s (Citation1990) classification would have been used in the interpretation of inter-rater reliability, all listeners in both listening conditions in the present study would surpass the threshold of ‘good’ intra-rater reliability. However, others again have applied an 80% threshold (McKechnie et al., Citation2018). If applied in the present study, intra-rater reliability would generally surpass the threshold, whereas inter-rater reliability would not reach the threshold for any of the listener subgroups. For sure, any suggested threshold is somewhat arbitrary and will depend on the context. As such, the question of what thresholds represent sufficient inter- and intra-rater reliability remains open.
The moderate correlations between listener ratings and the clinical measures PCC and PPC indicate that these measures do not measure the exact same construct. Given the expectation that ‘goodness’ is influenced also by lexical-level assessment in the listeners, and of their attitudes towards the speech they evaluate, this is not surprising. Furthermore, it mirrors the findings in Sakash et al. (Citation2023), who conclude that ‘articulation goodness’ ratings provide other information that clinical measures of speech accuracy. Recall that the intended scope or sensitivity for the rating was unspecified in the listener instructions – for example, it was not stated if they should listen for specific speech sound targets, or if they should take speaker dialect or accent into account. In fact, we purposely scripted the instructions not to refer to concepts like ‘accuracy’ or ‘correct’/’incorrect’, and instead framed the task for the listeners as a decision on how many stars they thought an app should provide as feedback to the child. This choice was motivated by an effort to frame the listener evaluation explicitly with regards to the intended use of the ratings, acknowledging that the decision of ‘how many stars the app should provide’ may indeed involve more considerations in the listener (e.g. consideration of the child’s reaction when receiving this feedback) than their perception of speech accuracy alone. Hereby, we hoped to collect ratings that would be acceptable to future users of the app. However, as the instructions did not specify the context of the hypothetical app (other than ‘speech training’), it is possible that different listeners envisioned different contexts for such an app to be used. These circumstances may explain both that listeners differ from each other in their ratings, and that the correlations between their ratings and the ’gold standard’ measures of speech accuracy are only moderate.
On a side note, the correlations between reference ratings (i.e. the ratings conducted by authors MP and SS) and the ‘gold standard’ measures were stronger than those for the listener ratings. An explanation to this observation could be that both these evaluations – the reference ratings and the PCC and PPC scoring – were conducted by the same evaluators, and the fact that the ratings were conducted with access to verbal descriptors of the five levels of the rating scale.
The correlations between automatic ratings and the ‘gold standard’ measures were weak, again, however, with the correlation to the PPC being stronger than that to the PCC. A stronger correlation with the PPC is expected also in this context, considering that the decision-tree component of the system maps the character error rate (CER) – i.e. the ratio of character-level errors in a speech transcript to the total characters spoken – to the pronunciation rating. In other words, both consonants and vowels are included in this analysis, just as with the PPC. On the other hand, it should be noted that the ASR itself can make recognition errors, which then influences the output of the CER decision-tree component. It should be acknowledged, that speech samples collected from children are often acoustically challenging; this applies also in this study. For example, the recorded children sometimes whisper, hesitate or speak in a playful voice. Although such features may be disregarded by a human evaluator, they pose a challenge in automatic assessment.
Limitations and future directions
In the listening evaluation setup, the listeners filled out their ratings for 10 samples at a time, and then moved forward to the next 10 samples. No check was made that the listener had filled out all 10 ratings, which led to the unforeseen loss of 5 data points. In relation to the full set of 6395 data points, however, this can be considered negligible.
The experimental setup did not allow any tracking of how many times the listeners who had access to anchor stimuli indeed listened to these anchor stimuli. All listeners with access to anchor stimuli listened to these stimuli before starting the rating task. Anecdotally, the experimenter’s (author MF) impression was that in general, listeners made more use of the anchor stimuli in the beginning of the listening task, than towards the end, but that their referral to anchor stimuli varied from listener to listener. Hence, the critical difference between listening conditions is the availability of anchor stimuli, rather than the listeners’ use of these anchors. We recommend this be systematically tracked in any future similar studies.
All SLP listeners conducted their ratings at their workplace, during their lunch break. The majority of listeners in the non-expert group, on the other hand, conducted their ratings in their spare time. Hence, it cannot be ruled out that the SLP listeners may have been under more time pressure than the inexperienced listeners. Furthermore, the listening environment varied between listeners. For a few participants, evaluations were conducted in a public place. In these cases, the participants were encouraged to inform the experimenter in case they had difficulties hearing the samples. However, this did not happen. Although a more optimal listening environment would have been preferred, as well as a similar contextual setting for all listeners, this was deemed impractical and would have resulted in a considerably smaller number of participants.
Although information regarding self-reported hearing was collected, no participant was excluded based on the information provided. The one participant who self-reported reduced hearing, described their impairment as tinnitus. Even though this may have affected this listener’s ratings, we decided not to exclude them. Similarly, the participants varied in terms of their language background. Although ‘speaking Swedish as the mother tongue’ was defined as an inclusion criterion, some listeners reported speaking an additional language as their mother tongue. Indeed, these are factors that may have influenced their rating behaviour. Nevertheless, these factors vary both in the general population as well as among SLPs, and by including this variation, our listener groups can be seen as representative of future users of the speech training app (specifically: as future child users’ parents and/or SLPs). Future research with more participants, purposely recruited by language background, is needed to provide deeper understanding of how language background may influence the perception of ‘goodness’.
Although the non-expert group participated as an ‘inexperienced’ group compared to the SLP group, the participants in this group also had varying experiences that might be of relevance for their rating behaviour. In total, seven of them (i.e. 35%) stated that they meet preschool-aged children regularly; the corresponding number among the SLPs was 12 (i.e. 60%). Similarly, the participants in the SLP also differed in terms of what ‘experience’ they had, such as how long they had been practicing clinicians, and within what clinical fields. In order to gain deeper insights into how ‘experience’ shapes listeners’ rating behaviour, future research is needed with more participants, and with a more fine-grained characterisation of ‘experience’.
The moderate agreement between different listeners raises concerns regarding the utility of the 1–5 rating scale as the means of feedback provided by speech training apps. If there is little agreement among human listeners in how many stars they think a specific speech sample should be rewarded, the chances that they would agree with an app’s suggested scoring are similarly small. More specific instructions, particularly regarding the intended context for the app, may strengthen both validity and inter-rater reliability. Alternatively, the 1–5 scale could be abandoned as the means of feedback, and other options considered (e.g. a binary decision), provided that listeners reach higher levels of agreement with such a measure. In the end, developers of speech training apps need to ensure that feedback provided by the speech training apps is reflective of what human listeners would provide in a similar context. To achieve this, we concur with Furlong et al. (Citation2017) that the continued development of automatic assessment of children’s speech in speech training apps requires close collaboration between clinicians and computer engineers.
Conclusions
Determining how a speech training app should score children’s production of known target words with regard to a 1–5 scale is a difficult task, both for clinicians and inexperienced listeners. Although individual listeners may be consistent in their ratings, moderate agreement with other listeners, and with standard measures of speech accuracy, can be expected. Having access to anchor stimuli can be beneficial, at least for inexperienced listeners. To reach more satisfactory levels of validity and inter-rater reliability, however, other means should be considered, such as more specific listener instructions concerning the intended use of the app.
Disclosure statement
No potential conflict of interest was reported by the author(s).
Supplementary material
Supplementary data (e.g., a full description of all 120 stimuli, complete listener instructions, as well as more detailed results from correlation analyses) can be found at https://doi.org/10.17605/OSF.IO/AMWSG.
Additional information
Funding
References
- Aakko, I., Kauramäki, J., Cleland, J., Lee, A., Vainio, M., & Saalasti, S. (2023). Auditory-perceptual evaluation with visual analogue scale: Feasibility and preliminary evidence of ultrasound visual feedback treatment of Finnish [r]. Clinical Linguistics & Phonetics, 37(4–6), 345–362. https://doi.org/10.1080/02699206.2022.2118079
- Ahmed, B., Monroe, P., Hair, A., Tan, C. T., Gutierrez-Osuna, R., & Ballard, K. J. (2018). Speech-driven mobile games for speech therapy: User experiences and feasibility. International Journal of Speech-Language Pathology, 20(6), 644–658. https://doi.org/10.1080/17549507.2018.1513562
- Alighieri, C., Bettens, K., Bruneel, L., D’haeseleer, E., Van Gaever, E., & Van Lierde, K. (2021). Reliability of outcome measures to assess consonant proficiency following cleft palate speech intervention: The percentage of consonants correct metric and the probe scoring system. Journal of Speech, Language, and Hearing Research, 64(6), 1811–1828. https://doi.org/10.1044/2021_JSLHR-20-00628
- Altman, D. G. (1990). Practical statistics for medical research. Chapman and Hall/CRC. https://doi.org/10.1201/9780429258589
- Brinca, L., Batista, A. P., Tavares, A. I., Pinto, P. N., & Araújo, L. (2015). The effect of anchors and training on the reliability of voice quality ratings for different types of speech stimuli. Journal of Voice, 29(6).e776.7–.e776.14. https://doi.org/10.1016/j.jvoice.2015.01.007
- Brown, T., Murray, E., & McCabe, P. (2018). The boundaries of auditory perception for within-word syllable segregation in untrained and trained adult listeners. Clinical Linguistics & Phonetics, 32(11), 979–996. https://doi.org/10.1080/02699206.2018.1463395
- Brunnegård, K., Lohmander, A., & van Doorn, J. (2009). Untrained listeners’ ratings of speech disorders in a group with cleft palate: A comparison with speech and language pathologists’ ratings. International Journal of Communication Disorders, 44(5), 656–674. https://doi.org/10.1080/13682820802295203
- Byun, T. M., Campbell, H., Carey, H., Liang, W., Park, T. H., & Svirsky, M. (2017). Enhancing intervention for residual rhotic errors via app-delivered biofeedback: A case study. Journal of Speech, Language, and Hearing Research, 60(6S), 1810–1817. https://doi.org/10.1044/2017_JSLHR-S-16-0248
- Chan, K. M. K., & Yiu, E. M.-L. (2002). The effect of anchors and training on the reliability of perceptual voice evaluation. Journal of Speech, Language, and Hearing Research, 45(1), 111–126. https://doi.org/10.1044/1092-4388(2002/009)
- Cleland, J., & Scobbie, J. M. (2021). The dorsal differentiation of velar from alveolar stops in typically developing children and children with persistent velar fronting. Journal of Speech, Language, & Hearing Research, 64(6S), 2347–2362. https://doi.org/10.1044/2020_JSLHR-20-00373
- Coniglio, E. A., Chung, H., & Schellinger, S. K. (2022). Perception of Children’s productions of /l/: Acoustic correlates and effects of listener experience. Folia Phoniatrica Et Logopaedica, 74(6), 392–406. https://doi.org/10.1159/000524395
- Dodd, B., Crosbie, S., McIntosh, B., Holm, A., Harvey, C., Liddy, M., Fontyne, K., Pinchin, B., & Rigby, H. (2008). The impact of selecting different contrasts in phonological therapy. International Journal of Speech-Language Pathology, 10(5), 334–345. https://doi.org/10.1080/14417040701732590
- Eadie, T. L., & Kapsner-Smith, M. (2011). The effect of listener experience and anchors on judgments of dysphonia. Journal of Speech, Language and Hearing Research, 54(2), 430–447. https://doi.org/10.1044/1092-4388(2010/09-0205)
- Furlong, L. M., Erickson, S., & Morris, M. E. (2017). Computer-based speech therapy for childhood speech sound disorders. Journal of Communication Disorders, 68, 50–69. https://doi.org/10.1016/j.jcomdis.2017.06.007
- Furlong, L. M., Serry, T. A., Erickson, S., & Morris, M. E. (2018). Processes and challenges in clinical decision-making for children with speech-sound disorders. International Journal of Language & Communication Disorders, 53(6), 1124–1138. https://doi.org/10.1111/1460-6984.12426
- Gerratt, B. R., Kreiman, J., Antonanzas-Barroso, N., & Berke, G. S. (1993). Comparing internal and external standards in voice quality judgments. Journal of Speech, Language, and Hearing Research, 36(1), 14–20. https://doi.org/10.1044/jshr.3601.14
- Getman, Y., Al-Ghezi, R., Grosz, T., & Kurimo, M. (2023). Multi-task wav2vec2 serving as a pronunciation training system for children. In 9th Workshop on Speech and Language Technology in Education (SLaTE) (pp. 36–40). https://doi.org/10.21437/SLaTE.2023-8
- Getman, Y., Phan, N., Al-Ghezi, R., Voskoboinik, E., Singh, M., Grósz, T., Kurimo, M., Salvi, G., Svendsen, T., Strömbergsson, S., Smolander, A., & Ylinen, S. (2023). Developing an AI-Assisted low-resource spoken language learning app for children. IEEE Access, 11, 86025–86037. https://doi.org/10.1109/ACCESS.2023.3304274
- Granqvist, S. (2003). The visual sort and rate method for perceptual evaluation in listening tests. Logopedics Phoniatrics Vocology, 28(3), 109–116. https://doi.org/10.1080/14015430310015255
- Hall, R., Adams, C., Hesketh, A., & Nightingale, K. (1998). The measurement of intervention effects in developmental phonological disorders. International Journal of Language & Communication Disorders, 33(S1), 445–450. https://doi.org/10.3109/13682829809179466
- Harris, P. A., Taylor, R., Minor, B. L., Elliott, V., Fernandez, M., O’Neal, L., McLeod, L., Delacqua, G., Delacqua, F., Kirby, J., & Duda, S. N. (2019). The REDCap consortium: Building an international community of software platform partners. Journal of Biomedical Informatics, 95, 103208. https://doi.org/10.1016/j.jbi.2019.103208
- Helou, L. B., Solomon, N. P., Henry, L. R., Coppit, G. L., Howard, R. S., & Stojadinovic, A. (2010). The role of listener experience on consensus auditory-perceptual evaluation of voice (CAPE-V) ratings of postthyroidectomy voice. American Journal of Speech-Language Pathology, 19(3), 248–258. https://doi.org/10.1044/1058-0360(2010/09-0012)
- Henningsson, G., Kuehn, D. P., Sell, D., Sweeney, T., Trost-Cardamone, J. E., & Whitehill, T. L. (2008). Universal parameters for reporting speech outcomes in individuals with cleft palate. The Cleft Palate-Craniofacial Journal, 45(1), 1–17. https://doi.org/10.1597/06-086.1
- Hustad, K. C., Mahr, T. J., Natzke, P., & Rathouz, P. J. (2021). Speech development between 30 and 119 months in typical children I: Intelligibility growth curves for single-word and multiword productions. Journal of Speech, Language, & Hearing Research, 64(10), 3707–3719. https://doi.org/10.1044/2021_JSLHR-21-00142
- Jesus, L. M. T., Martinez, J., Santos, J., Hall, A., & Joffe, V. (2019). Comparing traditional and tablet-based intervention for children with speech sound disorders: A randomized controlled trial. Journal of Speech, Language, and Hearing Research, 62(11), 4045–4061. https://doi.org/10.1044/2019_JSLHR-S-18-0301
- Jing, L., & Grigos, M. I. (2022). Speech-language pathologists’ ratings of speech accuracy in children with speech sound disorders. American Journal of Speech-Language Pathology, 31(1), 419–430. https://doi.org/10.1044/2021_AJSLP-20-00381
- Junttila, K., Smolander, A.-R., Karhila, R., Giannakopoulou, A., Uther, M., Kurimo, M., & Ylinen, S. (2022). Gaming enhances learning-induced plastic changes in the brain. Brain and Language, 230, 105124. https://doi.org/10.1016/j.bandl.2022.105124
- Karhila, R., Smolander, A.-R., Ylinen, S., & Kurimo, M. (2019). Transparent pronunciation scoring using articulatorily weighted phoneme edit distance. Interspeech, 2019, 1866–1870. https://doi.org/10.21437/Interspeech.2019-1785
- Karhila, R., Ylinen, S., Enarvi, S., Palomaki, K., Nikulin, A., Rantula, O., Viitanen, V., Dhinakaran, K., Smolander, A.-R., Kallio, H., Junttila, K., Uther, M., Hamalainen, P., & Kurimo, M. (2017). SIAK – a game for foreign language pronunciation learning. Interspeech 2017: Show & Tell (pp. 3429–3430).
- Kent, R. D., Miolo, G., & Bloedel, S. (1994). The intelligibility of children’s speech: A review of evaluation procedures. American Journal of Speech-Language Pathology, 3(2), 81–95. https://doi.org/10.1044/1058-0360.0302.81
- Klein, H. B., Grigos, M. I., McAllister Byun, T., & Davidson, L. (2012). The relationship between inexperienced listeners’ perceptions and acoustic correlates of children’s /r/ productions. Clinical Linguistics & Phonetics, 26(7), 628–645. https://doi.org/10.3109/02699206.2012.682695
- Koo, T. K., & Li, M. Y. (2016). A guideline of selecting and reporting intraclass correlation coefficients for reliability research. Journal of Chiropractic Medicine, 15(2), 155–163. https://doi.org/10.1016/j.jcm.2016.02.012
- Kreiman, J., Gerratt, B. R., Kempster, G. B., Erman, A., & Berke, G. S. (1993). Perceptual evaluation of voice quality: Review, tutorial, and a framework for future research. Journal of Speech, Language, and Hearing Research, 36(1), 21–40. https://doi.org/10.1044/jshr.3601.21
- Lagerberg, T. B., Holm, K., McAllister, A., & Strömbergsson, S. (2021). Measuring intelligibility in spontaneous speech using syllables perceived as understood. Journal of Communication Disorders, 106108. https://doi.org/10.1016/j.jcomdis.2021.106108
- Lagerberg, T. B., Lam, J., Olsson, R., Abelin, Å., & Strömbergsson, S. (2019). Intelligibility of children with speech sound disorders evaluated by listeners with Swedish as a second language. Journal of Speech, Language, & Hearing Research, 62(10), 3714–3727. https://doi.org/10.1044/2019_JSLHR-S-18-0492
- Lewis, K. E., Watterson, T. L., & Houghton, S. M. (2003). The influence of listener experience and academic training on ratings of nasality. Journal of Communication Disorders, 36(1), 49–58. https://doi.org/10.1016/S0021-9924(02)00134-X
- Maas, E., & Farinella, K. A. (2012). Random versus blocked practice in treatment for childhood apraxia of speech. Journal of Speech, Language, & Hearing Research, 55(2), 561–578. https://doi.org/10.1044/1092-4388(2011/11-0120)
- McKechnie, J., Ahmed, B., Gutierrez-Osuna, R., Monroe, P., McCabe, P., & Ballard, K. J. (2018). Automated speech analysis tools for children’s speech production: A systematic literature review. International Journal of Speech-Language Pathology, 20(6), 583–598. https://doi.org/10.1080/17549507.2018.1477991
- McLeod, S. (2020). Intelligibility in context scale: Cross-linguistic use, validity, and reliability. Speech, Language and Hearing, 23(1), 9–16. https://doi.org/10.1080/2050571X.2020.1718837
- McLeod, S., & Baker, E. (2014). Speech-language pathologists’ practices regarding assessment, analysis, target selection, intervention, and service delivery for children with speech sound disorders. Clinical Linguistics & Phonetics, 28(7–8), 508–531. https://doi.org/10.3109/02699206.2014.926994
- McLeod, S., Kelly, G., Ahmed, B., & Ballard, K. J. (2023). Equitable access to speech practice for rural Australian children using the SayBananas! Mobile game. International Journal of Speech-Language Pathology, 25(3), 388–402. https://doi.org/10.1080/17549507.2023.2205057
- Meyer, M. K., & Munson, B. (2021). Clinical experience and categorical perception of children’s speech. International Journal of Language & Communication Disorders, 56(2), 374–388. https://doi.org/10.1111/1460-6984.12610
- Mokkink, L. B., Terwee, C. B., Patrick, D. L., Alonso, J., Stratford, P. W., Knol, D. L., Bouter, L. M., & de Vet, H. C. W. (2010). The COSMIN study reached international consensus on taxonomy, terminology, and definitions of measurement properties for health-related patient-reported outcomes. Journal of Clinical Epidemiology, 63(7), 737–745. https://doi.org/10.1016/j.jclinepi.2010.02.006
- Mukaka, M. M. (2012). Statistics corner: A guide to appropriate use of correlation coefficient in medical research. Malawi Medical Journal: The Journal of Medical Association of Malawi, 24(3), 69–71.
- Munson, B., Edwards, J., Schellinger, S., Beckman, M. E., & Meyer, M. K. (2010). Deconstructing phonetic transcription: Covert contrast, perceptual bias, and an extraterrestrial view of Vox Humana. Clinical Linguistics & Phonetics, 24(4–5), 245–260. https://doi.org/10.3109/02699200903532524
- Munson, B., Johnson, J. M., & Edwards, J. (2012). The role of experience in the perception of phonetic detail in Children’s speech: A comparison between speech-language pathologists and clinically untrained listeners. American Journal of Speech-Language Pathology, 21(2), 124–139. https://doi.org/10.1044/1058-0360(2011/11-0009)
- Navarro-Newball, A. A., Loaiza, D., Oviedo, C., Castillo, A., Portilla, A., Linares, D., & Álvarez, G. (2014). Talking to Teo: Video game supported speech therapy. Entertainment Computing, 5(4), 401–412. https://doi.org/10.1016/j.entcom.2014.10.005
- Öster Cattu Alves, M., Ode, C., & Strömbergsson, S. (2020). Dealing with the unknown—Addressing challenges in evaluating unintelligible speech. Clinical Linguistics & Phonetics, 34(1–2), 169–184. https://doi.org/10.1080/02699206.2019.1622787
- Preston, J. L., Ramsdell, H. L., Oller, D. K., Edwards, M. L., & Tobin, S. J. (2011). Developing a weighted measure of speech sound accuracy. Journal of Speech Language and Hearing Research, 54(1), 1–18. https://doi.org/10.1044/1092-4388(2010/10-0030)
- RStudio Team. (2020). RStudio: Integrated development environment for R. RStudio, PBC. http://www.rstudio.com/
- Rvachew, S., & Brosseau-Lapré, F. (2017). Introduction to speech sound disorders. Plural Publishing, Incorporated. http://ebookcentral.proquest.com/lib/ki/detail.action?docID=5655844
- Sakash, A., Mahr, T. J., & Hustad, K. C. (2023). Perceptual measurement of articulatory goodness in young children: Relationships with age, speech sound acquisition, and intelligibility. Clinical Linguistics & Phonetics, 37(12), 1141–1156. https://doi.org/10.1080/02699206.2022.2150893
- Schellinger, S. K., Munson, B., & Edwards, J. (2017). Gradient perception of children’s productions of /s/ and /θ/: A comparative study of rating methods. Clinical Linguistics & Phonetics, 31(1), 80–103. https://doi.org/10.1080/02699206.2016.1205665
- Shahin, M., Ahmed, B., Parnandi, A., Karappa, V., McKechnie, J., Ballard, K. J., & Gutierrez-Osuna, R. (2015). Tabby talks: An automated tool for the assessment of childhood apraxia of speech. Speech Communication, 70, 49–64. https://doi.org/10.1016/j.specom.2015.04.002
- Shriberg, L. D., Austin, D., Lewis, B. A., McSweeny, J. L., & Wilson, D. L. (1997). The percentage of consonants correct (PCC) metric: Extensions and reliability data. Journal of Speech, Language, and Hearing Research, 40(4), 708–722. https://doi.org/10.1044/jslhr.4004.708
- Shriberg, L. D., & Kwiatkowski, J. (1982). Phonological disorders III: A procedure for assessing severity of involvement. Journal of Speech and Hearing Disorders, 47(3), 256–270. https://doi.org/10.1044/jshd.4703.256
- Shriberg, L. D., Strand, E. A., Jakielski, K. J., & Mabie, H. L. (2019). Estimates of the prevalence of speech and motor speech disorders in persons with complex neurodevelopmental disorders. Clinical Linguistics & Phonetics, 33(8), 707–736. https://doi.org/10.1080/02699206.2019.1595732
- Skahan, S. M., Watson, M., & Lof, G. L. (2007). Speech-language pathologists’ assessment practices for children with suspected speech sound disorders: Results of a National Survey. American Journal of Speech-Language Pathology, 16(3), 246–259. https://doi.org/10.1044/1058-0360(2007/029)
- Strömbergsson, S., Edlund, J., McAllister, A., & Lagerberg, T. B. (2021). Understanding acceptability of disordered speech through audience response systems-based evaluation. Speech Communication, 131, 13–22. https://doi.org/10.1016/j.specom.2021.05.005
- Wikse Barrow, C., Körner, K., & Strömbergsson, S. (2021). A survey of Swedish speech-language pathologists’ practices regarding assessment of speech sound disorders. Logopedics, Phoniatrics, Vocology, 0(0), 1–12. https://doi.org/10.1080/14015439.2021.1977383