
 ?Mathematical formulae have been encoded as MathML and are displayed in this HTML version using MathJax in order to improve their display. Uncheck the box to turn MathJax off. This feature requires Javascript. Click on a formula to zoom.
ABSTRACT
Avoidance towards innocuous cues is a key diagnostic criterion across anxiety-related disorders. Importantly, the most effective intervention for anxiety-related disorders, exposure therapy with response prevention, sometimes does not prevent the relapse of anxiety's symptomatology. We tested whether extinction effects, the experimental proxy of exposure, are enhanced by increasing the discrepancy between the prediction of an unpleasant event happening (shock presentation), and the actual event (shock omission). Forty-eight individuals first saw pictures of three stimuli. Two pictures (CSA, CSB) were followed by a shock (US) and one (CS-) was not. Next, participants learned to avoid the US by pressing a computer key. An extinction and response prevention procedure followed. In the first part of it, participants saw unreinforced presentations of all CSs. In the second part, the single group saw unreinforced presentations of the CSA and CS-. The compound group encountered compound unreinforced presentations of the CSA and CSB, and separate presentations of the CS-. Return of avoidance and fear was tested after unsignalled presentations of the US. Compound extinction resulted in comparable reduction of fear and avoidance compared to standard extinction. We discuss how future research could enhance extinction effects by adding costs to the avoidance behaviour.
1. Introduction
There is a renewed interest in how avoidance is learned and extinguished in humans (LeDoux, Moscarello, Sears, & Campese, Citation2017). Maladaptive avoidance is a key diagnostic criterion in anxiety-related disorders (American Psychiatric Association, Citation2013), so finding a way to reduce avoidance could prove important for the treatment of such disorders.
One of the most common interventions for avoidance is exposure with response prevention therapy, in which individuals encounter phobic stimuli that they are not allowed to avoid. The laboratory parallel of this procedure is fear extinction training, in which individuals encounter stimuli (e.g. pictures of spiders; Conditioned Stimulus or CS) that have been previously paired with an aversive stimulus (e.g. a shock; Unconditioned Stimulus or US), without the US happening any more (Scheveneels, Boddez, Vervliet, & Hermans, Citation2016). Although fear extinction can successfully reduce fear responses (e.g. fear ratings), these responses are prone to return with simple experimental manipulations (e.g. presentations of a US without the CS; fear reinstatement), which is referred to as return of fear (ROF) (Bouton, Citation2002). ROF is regarded as a proxy for relapse of anxiety symptomatology after initially seemingly successful therapy. As such, finding a way to reduce ROF is a lively field of research given the potential clinical translations of the experimental findings to clinical interventions.
A common explanation of ROF is that fear extinction training does not erase the initial fear memory (i.e. CS is followed by a US), but creates a new memory (i.e. CS is not followed by US). Accordingly, the ROF is explained as the dominance of the fear memory over the extinction memory (Craske, Treanor, Conway, Zbozinek, & Vervliet, Citation2014). It follows that strengthening the extinction memory would reduce ROF. Insights from the learning theory could prove helpful in this direction. Specifically, according to the Rescorla-Wagner model (Rescorla & Wagner, Citation1972), the greater the discrepancy between a predicted event (e.g. CS will be followed by US) and the actual outcome (e.g. CS was not followed by US), the deeper the learning about the CS-US association. As such, increasing the prediction error during extinction training could strengthen the extinction memory over the fear memory.
This idea was recently confirmed by Culver, Vervliet, and Craske (Citation2015). These authors argued that, during fear extinction training the prediction error is reduced when participants encounter more and more unreinforced trials of the CSs. They argued that the prediction error could be enhanced if first different CSs are presented singly, as is common during extinction training, and then compound CSs are presented. Their idea was confirmed: participants undergoing compound extinction showed less ROF compared to participants who underwent standard extinction.Footnote1
Inspired by these findings, we tested whether compound extinction also results in the reduction of avoidance, and whether this reduction would be larger compared to standard extinction. First, all participants underwent a standard fear conditioning procedure in which two CSs (CSA, CSB) were followed by a US and another CS (CS-) was never followed by a US. During the avoidance conditioning phase, participants were informed that they could press the space-bar to avoid the US. In the first extinction phase, participants encountered the CSA and CS- while avoidance was not allowed (i.e. response prevention). In the second extinction phase, the compound extinction group was presented with the CSA and CSB in compound, or only the CS-, whereas the single extinction group saw only the CSA or the CS-. After the administration of unpredicted USs, reinstatement of avoidance and fear was tested. We expected less avoidance and ROF in the compound compared to the single group.
2. Materials and methods
2.1. Participants
For a repeated measures Analysis of Variance (ANOVA) with an alpha of 0.05, 2 levels of the within subject factor (i.e. CSs at the test phase), 2 levels of the between-subjects factor (i.e. group), and Cohen's f of .20, 42 participants were needed for a power of 0.80. We collected three additional participants per group for potential replacements.
Forty-eight healthy individuals (24 females, 24 males; M years, SD
) completed our study and were compensated with 8 euros or a course credit. The incomplete data of an additional participant were excluded from our analyses. Participants were randomly assigned to the single or the compound group. No between group differences were detected in terms of age, t < 1,
, or sex,
, p=0.66. The study was approved by the local ethics committee (FETC16-054). All data are available at osf.io/wm69r.
2.2. Self-reports
Participants filled in the state (STAI-S) and trait anxiety (STAI-T) portion of the State-Trait Anxiety Inventory (van der Ploeg, Citation2000), and the Intolerance of Uncertainty Scale (IUS) (Bruin, Rassin, van der Heide, & Muris, Citation2006). They rated their experience of the electric shock using a 10-point scale ranging from -5 (very unpleasant) to 5 (pleasant), with 0 indicating “neutral” experience. Five-point scales were used to rate the intensity of the shock (“weak”, “average”, “intense”, “very intense”, “unbearable”), and how startling the shock was (“not”, “light”, “average”, “bad”, and “very bad”).
US-expectancies were measured using an 11-point scale ranging from -5 (expecting no electric stimulation for sure), to 0 (uncertain), to 5 (expecting an electric stimulation for sure). CS fear was measured with an 11-point rating scale ranging from 0 (“not at all fearful”) to 10 (“very fearful”).
2.3. Stimuli
Pictures of three different spiders (stimuli 1200, 1201, and 1220 from Lang, Bradley, & Cuthbert, Citation1999; 13 cm × 10.5 cm) served as the CSA, CSB, and CS-. Which picture served as each CS was chosen randomly. The task presented the CSA on the left side of the screen, the CSB on the right side, and the CS- on the middle. A picture of a manikin figure (4 cm × 4 cm) was also presented on each trial. The US was a 50-ms electric shock administrated on the ring and middle finger of the non-dominant hand of the participants.
2.4. Procedure
First, all participants read the information brochure and signed the informed consent. Then they filled in STAI-S. After that, the shock electrodes were fitted to the participant's fingers and the shock intensity was set to a non-painful but clearly unpleasant level (Krypotos & Engelhard, Citation2018).
The main computer task started with the CS fear evaluations (Habituation phase). Next, the fear conditioning phase began. Each trial (see ) started with the presentation of the CS and concurrent presentation of the manikin for 3 sec. Then, the US-expectancy scale was presented on the bottom of the screen for 7.5 seconds. Participants could register their US expectancy in the first 5.5 seconds after the scale appeared. In case of a CSA or a CSB trial, a shock was then presented for 50 milliseconds (100% reinforcement rate during the acquisition phase). No shock was administrated in the CS- trials. Then, the US-expectancy scale disappeared and the manikin with the CS remained on screen for another 3.75 seconds. The inter-time intervals (ITIs) were 10, 15, or 20 seconds. At the end of the fear conditioning phase, participants rated their fear during the presentation of each CS.
Figure 1. Experimental phases. Fear ratings were collected before and after each phase. The number of trials in each phase is presented in brackets. msec: milliseconds. +: US presentation. -: US absence. *: Avoidance availability.
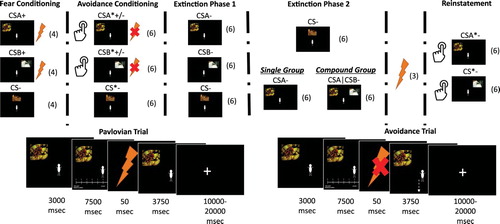
Participants were instructed that in the next phase (i.e. avoidance conditioning phase), they would be allowed to press the space bar (i.e. the avoidance response) during the first 3 seconds of each trial, which would cancel the US presentation. During this phase, the avoidance response for the CSA or the CSB trials resulted in the US cancellation. In order to give the visual impression that the manikin was actually escaping the CS and avoiding the US (Krypotos & Engelhard, Citation2018), the manikin started walking towards the bottom of the screen during the last 3.75 seconds of the trial, while the CS size reduced (width 10.5 cm, 8 cm, 5.30 cm and height 8 cm, 5.30 cm, 2.6 cm respectively). In CS- trials, there was no US administration or manikin movement. At the end of this phase, participants filled in their fear ratings for each CS.
Before the beginning of the extinction phase, participants were instructed that the avoidance response would be unavailable in the next phase (Krypotos & Engelhard, Citation2018). The extinction phase had two parts, and the US was never presented. In part 1, all CSs were presented singly. Part 2 differed between groups. In the single group, the CSA and CS- were presented singly. In the compound group, the CSA and CSB were presented in compound, and the CS- was presented singly.
After filling in the fear ratings again, participants were instructed that the experiment would continue. The instructions were: ‘The experiment will continue now. You can use the spacebar until the end of the experiment. However, pressing the space bar does not mean that the manikin will move or that the manikin will avoid the shock.’ At the beginning of the reinstatement phase, three USs, with 5 seconds between each US, were presented. Afterwards, CSA and CS- trials were presented without a US. Participants could press the space button, which resulted in the manikin moving away from the CS. After two trials per CS, participants had to fill in again their CS fear evaluations. Then, the reinstatement phase resumed with unreinforced presentations of the CSA and the CS-, four trials per CS. After the end of this phase, participants filled in their CS fear evaluations again and the remaining questionnaires (i.e. STAI-T, IUS).
2.5. Statistical analyses
Between-group differences for all questionnaires were assessed with separate independent samples t-tests. For US-expectancies we ran separate repeated measures ANOVAs with stimulus and trial as the within subject factor and group as the between subject factor, for each phase separately. The levels of stimulus and trial were adjusted according to which phase the repeated measures referred to (see ). ROF was measured with a repeated measures ANOVA in the same way as with US-expectancy. The only difference was that the last trial of the extinction phase 2 and the first trial of reinstatement test were used. Separate 3 (CS: CSA, CSB, CS-)× 2 (Group: compound, single) repeated measures ANOVAs were used for fear-ratings. The same ANOVAs were also ran for the avoidance responses. However, in line with previous studies (e.g. Vervliet & Indekeu, Citation2015), we analyzed avoidance data by first computing the proportion of avoidance responses separately for each stimulus, and separately for the instrumental and the reinstatement phase. Then we ran separate 3 (CS: CSA, CSB, CS-) × 2 (Group: compound, singled) repeated measures ANOVAs. For all our analyses, we used an alpha level of 0.05 and report generalised eta square as an effect size. In case of violation of sphericity, we applied the Greenhouse-correction. We followed up significant interactions with separate repeated measures ANOVAs for each group.
We also performed Bayesian analyses, using the models in Rouder and Morey (Citation2012) and Rouder, Speckman, Sun, Morey, and Iverson (Citation2009). For all the alternative hypotheses we used the a Cauchy distribution with mean at zero and a scale factor of 0.707 (t-tests) or .5 (ANOVAs). The direction of our results did not change when the scale factor was set to 1. We refer to Bayes factors that quantify the evidence of the data under the experimental hypothesis, relative to the null hypothesis, as and
for the reverse. Higher
values provide greater evidence that the data came from the experimental hypotheses, compared to the null, and vice versa for
.
3. Results
No between-group differences were detected in terms of shock level, ,
,
, shock unpleasantness,
, US intensity,
, or US startlingness, t
. The groups also did not differ in any questionnaire: STAI-S,
, STAI-T,
, IUS,
(see Supplemental material).
3.1. Expectancy ratings
The top panel of gives an overview of the mean US-expectancies across all phases.
Figure 2. Top panel: Mean US-expectancy across all phases for the all CSs for both groups. Error bars indicate standard errors. Bottom panel: Mean proportion of avoidance responses for each CS and for each group during the instrumental and the reinstatement phase.
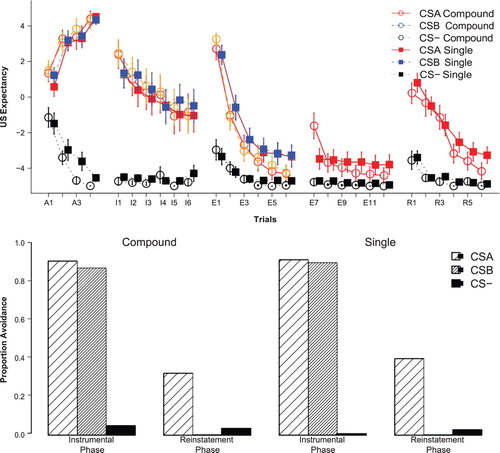
During the fear conditioning phase, participants learned to expect the US after the CSA and the CSB and not after the CS-, CS × trial, , p<0.001,
,
. This effect was similar across groups, CS × trial × group,
,
.
Across the instrumental phase, the expectancy of a US occurring after the CSA and CSB differed from the CS-: CS × trial, , p<0.001,
,
. This effect was similar across groups: CS × trial × group,
.
In the extinction phase 1, a CS × trial was detected, , p<0.001,
,
, which was similar across groups
,
.
In extinction phase 2, between group differences were detected, CS × trial × group ,
,
,
. After running simple main effects comparisons on differential CS scores, we found that the between group differences emerged due to higher US-expectancy ratings for the compound group, compared to the single group, on the first trial,
, p=0.042, all other
.
We observed differential reinstatement, (1, 46) = 45.47, p<0.001,
,
, across groups,
,
. This CS differentiation was preserved throughout the reinstatement phase,
, p<0.001,
,
, for both groups,
, p=0.199,
,
.
3.2. Fear ratings
We summarise the results of fear ratings across all phases on . During the habituation phase, participants in both groups reported similar levels of fear for the three CSs, CS, ,
, CS × group,
,
.
Figure 3. Fear ratings for each CS and for each group across all phases. Error bars denote standard errors.
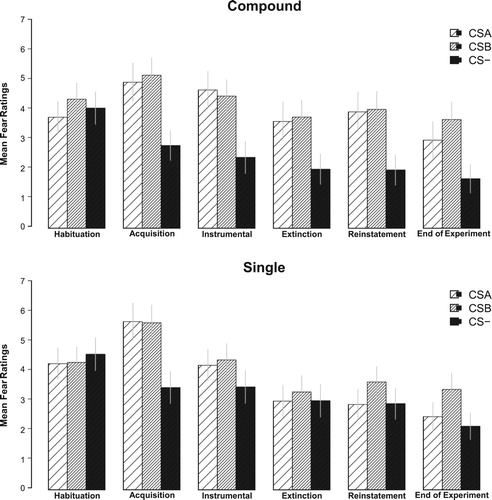
After the acquisition phase, fear ratings were higher for the CSA and the CSB, than for the CS-, as evident by a main effect for the CS type, , p<0.001,
,
. This effect did not differ across groups, CS × group,
,
. The same pattern of responses was observed in the instrumental phase, with a main effect of CS type,
, p<0.001,
,
, across groups, CS x group,
, p=0.084,
,
.
At the end of extinction, we observed between group differences, , p=0.013,
,
. Specifically, participants in the compound group showed CS differentiation,
,
,
,
, and the control group did not,
,
.
The two groups also differed in the reinstatement test phase, , p=0.007,
,
, with both the compound group,
, p<0.001,
,
, and the simple group,
,
,
,
, showing CS differentiation.
Lastly, CS differential fear was observed at the end of the experiment, , p<0.001,
,
, and this effect did not differ between groups,
,
,
,
.
3.3. Avoidance responses
During the instrumental phase (see bottom panel of ), both groups pressed the space bar more during the presentation of the CSA and the CSB, compared to the CS-, ,
,
,
. This effect did not differ per group,
,
.
Similar differentiation was observed during the reinstatement phase, , p<0.001,
,
, with again the effect being similar across groups,
,
. Importantly, there was a significant reduction in avoidance from the instrumental to the reinstatement phase,
, p<0.001,
,
, that was similar across groups,
,
. Collectively, these findings suggest that both procedures reduce avoidance to comparable levels.
4. Discussion
We tested whether compound extinction would result in less avoidance compared to standard extinction. Our results showed that both the compound and the single group showed a comparable reduction in avoidance. Similar between-group results arose for fear ratings and US-expectancies. However, the compound group reported higher fear, compared to the single group, at the end of the extinction phase. Importantly, these between group differences did not persist during the reinstatement phase. Our findings suggest that compound extinction does not enhance the effects of standard extinction.
Studies have used different procedures to experimentally reduce avoidance (e.g. Vervliet & Indekeu, Citation2015). However, none of the procedures protect from ROF and avoidance. Here, we tested whether extinction effects could be enhanced by increasing the prediction error regarding the CS-noUS association. This hypothesis follows basic Rescorla-Wagner principles (Rescorla & Wagner, Citation1972) and is in line with previous studies (e.g. Culver, Vervliet, & Craske, Citation2015). Our results did not support this hypothesis, as both the compound and the single group performed similarly. These findings, in addition to previous results, suggest that maybe an alternative route for enhancing CS-noUS associations should be chosen. For example, someone could focus on changing the CS-Action-US associations. In other words, it may be promising to examine ways to enhance prediction error regarding the likelihood of an avoidance response resulting in US omission. This could be done, for example, by using punishment protocols with the avoidance response lead to the US presence of an aversive US, instead of its absence. Given the typically negative effects of such procedures, however, the question on whether they can be readily translated to clinical settings remains.
We found a reduction of avoidance from the instrumental to the reinstatement phase. This was in line with previous work (e.g. Krypotos & Engelhard, Citation2018; Vervliet & Indekeu, Citation2015); experiment 2 where response prevention was induced via instructions), but in disagreement with other studies (e.g. Vervliet & Indekeu, Citation2015); experiment 1 where response prevention was induced via removing the availability to avoid during extinction). The discrepancy in findings between studies could be because in other studies avoidance availability during the test phase was signalled by a visual cue (e.g. a red button) whereas in our study, participants were free to choose when to press the button. As such, any ROF and avoidance in our study is probably the result of the CS presentation rather than the mere availability of the avoidance response.
Our study has limitations. One is that extinction was not complete and as such there was still room for further enhancing extinction learning. However, our procedure used a comparable number of trials per extinction phase as in Culver, Vervliet and Craske (Citation2015) (they used 8 trials per phase whereas we used 6 in addition to the instrumental phase in which the US was mostly not presented). In addition, Culver, Vervliet and Craske (Citation2015) had a gap of one day between the end of extinction and the test of the return of fear. It remains an empirical question as to whether avoidance responses could be reduced via extended compound extinction, and whether a one day break is needed between the end of extinction and the test for ROF.
Supplementenary_Material.zip
Download Zip (259.1 KB)Acknowledgments
We thank Merel Boon, Jan Peter Kruiger, and Hielke Moorlag for data collection.
Disclosure statement
No potential conflict of interest was reported by the authors.
Additional information
Funding
Notes
1 Within each group, participants were also separated in caffeine or placebo ingestion subgroups. Because this manipulation did not attenuate any ROF effects, except from valence ratings at spontaneous recovery, we do not mention it further.
Related Research Data
References
- American Psychiatric Association. (2013). Diagnostic and statistical manual of mental disorders: DSM 5. Arlington, VA: American Psychiatric Association.
- Bouton, M. E. (2002). Context, ambiguity, and unlearning: Sources of relapse after behavioral extinction. Biological Psychiatry, 52, 976–986. doi: 10.1016/S0006-3223(02)01546-9
- Bruin, G.O. de, Rassin, E., van der Heiden, C., & Muris, P. (2006). Psychometric properties of a dutch version of the intolerance of uncertainty scale. Netherlands Journal of Psychology, 62, 87–92. doi: 10.1007/BF03061055
- Craske, M. G., Treanor, M., Conway, C. C., Zbozinek, T., & Vervliet, B. (2014). Maximizing exposure therapy: An inhibitory learning approach. Behaviour Research and Therapy, 58, 10–23. doi: 10.1016/j.brat.2014.04.006
- Culver, N. C., Vervliet, B., & Craske, M. G. (2015). Compound extinction: Using the Rescorla–Wagner model to maximize exposure therapy effects for anxiety disorders. Clinical Psychological Science, 3, 335–348. doi: 10.1177/2167702614542103
- Krypotos, A.-M., & Engelhard, I. M. (2018). Testing a novelty-based extinction procedure for the reduction of conditioned avoidance. Journal of Behavior Therapy and Experimental Psychiatry, 60, 22–28. doi: 10.1016/j.jbtep.2018.02.006
- Lang, P. J., Bradley, M. M., & Cuthbert, B. N. (1999). International affective picture system (IAPS): Instruction manual and affective ratings. The Center for Research in Psychophysiology, University of Florida.
- LeDoux, J. E., Moscarello, J., Sears, R., & Campese, V. (2017). The birth, death and resurrection of avoidance: A reconceptualization of a troubled paradigm. Molecular Psychiatry, 22, 24–36. doi: 10.1038/mp.2016.166
- Rescorla, R. A., & Wagner, A. R. (1972). A theory of Pavlovian conditioning: Variations in the effectiveness of reinforcement and nonreinforcement. In A. H. Black & W. F. Prokasy (Eds.), Classical conditioning II: Current research and theory (pp. 64–99). New York: Appleton-Centrury-Crofts.
- Rouder, J. N., & Morey, R. D. (2012). Default Bayes factors for model selection in regression. Multivariate Behavioral Research, 47, 877–903. doi: 10.1080/00273171.2012.734737
- Rouder, J. N., Speckman, P. L., Sun, D., Morey, R. D., & Iverson, G. (2009). Bayesian t-tests for accepting and rejecting the null hypothesis. Psychonomic Bulletin & Review, 16, 225–237. doi: 10.3758/PBR.16.2.225
- Scheveneels, S., Boddez, Y., Vervliet, B., & Hermans, D. (2016). The validity of laboratory-based treatment research: Bridging the gap between fear extinction and exposure treatment. Behaviour Research and Therapy, 86, 87–94. doi: 10.1016/j.brat.2016.08.015
- van der Ploeg, H. M. (2000). Handleiding bij de zelf-beoordelings vragenlijst, een nederlandse bewerking van de spielberger stait-trait anxiety inventory, STAI-DY. Lisse: Swets en Zeitlinger.
- Vervliet, B., & Indekeu, E. (2015). Low-cost avoidance behaviors are resistant to fear extinction in humans. Frontiers in Behavioral Neuroscience, 9, 1–12. https://www.frontiersin.org/articles/10.3389/fnbeh.2015.00351/full doi: 10.3389/fnbeh.2015.00351