
 ?Mathematical formulae have been encoded as MathML and are displayed in this HTML version using MathJax in order to improve their display. Uncheck the box to turn MathJax off. This feature requires Javascript. Click on a formula to zoom.
ABSTRACT
There is an increased interest in how excessive avoidance can diminish. Avoidance reduction is typically tested by using Extinction with Response Prevention (ExRP) protocols, where feared stimuli are presented without any aversive outcome while avoidance is prevented. These effects, however, often do not persist. Here, we tested whether pairing an avoidance response with the presence of an aversive event would reduce avoidance more than ExRP. Participants (N = 58) first saw a picture of a square (A) being paired with a shock whereas another picture of a square (B) not being paired with a shock. Then, they learned to press a button during the presentation of A to avoid the shock. Afterwards, the ExRP group saw unreinforced presentations of A and B without being able to press the avoidance button, whereas the Contingency Reversal group (ConR) received a shock whenever they pressed the button in presence of A. In the test phase, participants saw unreinforced presentations of A and B. Results showed that after successful acquisition of fear and avoidance, in the test phase the ConR group avoided A less often than did the ExRP group. Research on contingency reversal could prove helpful for developing avoidance reduction protocols.
There is a renewed interest in mechanisms involved in the acquisition and reduction of adaptive avoidance (i.e. of genuinely dangerous stimuli) and maladaptive avoidance (i.e. of largely innocuous stimuli) (Pittig, Treanor, LeBeau, & Craske, Citation2018). Elucidating these mechanisms is especially important for psychiatric disorders in which maladaptive avoidance is a central feature (e.g. anxiety-related disorders; American Psychiatric Association, Citation2013).
The acquisition of human avoidance is often studied in the lab using conditioned avoidance tasks that include a Pavlovian and an instrumental procedure. During the Pavlovian procedure, a neutral stimulus (e.g. the picture of a square; Conditioned Stimulus or CS) is paired with an aversive stimulus (e.g. a shock; Unconditioned stimulus or US). This pairing typically leads to the CS evoking fear. Then, during the instrumental procedure, participants learn to perform a response defined by the experimenter (e.g. pressing a computer key) that cancels the US presentation.
Although conditioned avoidance tasks typically result in the acquisition of avoidance, no protocols that persistently reduce avoidance have been developed yet. A common way to develop protocols for fear and avoidance reduction in the lab is by using extinction-based procedures, where individuals see the CS without a US. Importantly, extinction is the basis of exposure-based treatments, which are effective treatments for anxiety-related disorders. As an example of an extinction-based procedure for reducing avoidance, Vervliet and Indekeu (Citation2015) used an extinction with response prevention (ExRP) procedure, during which participants encountered unreinforced presentations of a CS without being able to perform an avoidance response. Results showed that participants perform the avoidance response as soon as it is available again, with an accompanying increase in the reported fear for the CSs (see also van Uijen, Leer, & Engelhard, Citation2018).
An explanation for the persistence of avoidance relates to the notion that extinction-related procedures do not erase the acquisition memory (i.e. CS-US) but form a second extinction memory (i.e. CS-noUS) that competes with the initial acquisition memory (Bouton, Citation2002). As such, the return of fear and avoidance after ExRP can be explained by the dominance of the acquisition memory over the extinction memory. It follows that a way to block the return of fear and avoidance would be by strengthening the extinction memory (Craske, Treanor, Conway, Zbozinek, & Vervliet, Citation2014). However, combining procedures for enhancing extinction memory with ExRP does not prevent the return of avoidance (e.g. Krypotos & Engelhard, Citation2018). Apparently, the absence of a US is not a strong enough reinforcement for reducing avoidance responses.
Here, we examined another approach for reducing avoidance. Instead of aiming to strengthen the extinction memory, we attempted to reduce avoidance by pairing it with the presence, rather than the absence, of a negative outcome. We argue that this contingency reversal (ConR)Footnote1 (i.e. reversal of the contingencies between the behaviour and the absence/presence of the US) will change the meaning of the avoidance response from an action that removes an unpleasant event to an action that is associated with an aversive consequence, resulting in less avoidance compared to ExRP.
Participants completed a conditioned avoidance task. Then, half of them (ExRP group) followed an ExRP procedure, and the other half (ConR group) was allowed to make avoidance responses but these were paired with US presence. In a final test, the return of avoidance and fear were assessed during subsequent unreinforced presentations of the CSs. We expected lower avoidance responses in the ConR group compared to the ExRP group.
1. Method
1.1. Participants
For repeated measures Analysis of Variance (ANOVA) with 2 groups, 2 measures, α of 0.05, and Cohen's f of 0.2, 52 participants would be needed for achieving a power of 0.80. We collected the data of 60 participants in case of potential data-loss. The data of two participants were removed due to incomplete data. The remaining 58 participants (age, M = 21.98 years, , 17 males and 41 females) were assigned equally and in order of appearance to the two groups. We excluded individuals based on the following criteria assessed via an interview: pregnancy, cardiovascular conditions, neurological conditions, psychiatric disorders, hearing conditions, colour blindness, and the current usage of medication that could influence attention or memory. The study was approved by the local ethics committee (FETC16-054).
1.2. Materials and methods
1.2.1. Stimuli
The CSs were pictures of a blue or an orange square ( pixels) that appeared just above the centre of the screen, against a black background. A picture of a yellow light bulb (
pixels), which appeared next to the CS, was used to indicate availability of avoidance (see below). The US was a 50-ms electric stimulus that was individually set at the beginning of the experiment at a level that was unpleasant but not painful (Krypotos & Engelhard, Citation2018).
1.2.2. Ratings and questionnaires
Participants indicated their expectancy of receiving a shock by answering to the question “How much do you expect to receive an electric stimulation now” and by using a visual analogue scale (VAS) ranging from (I am definitely not expecting an unpleasant electric stimulus), to 0 (I am unsure), to 5 (I am definitely expecting an unpleasant electric stimulus). Participants' fear ratings were collected by using a VAS scale with the question “How frightening do you find this picture?” and the VAS scale ranging from 0 (definitely not frightening) to 10 (definitely frightening). Participants also evaluated the pleasantness of the US (i.e. “How did you experience the electric stimulus”) with a VAS scale ranging from
(highly unpleasant), to 0 (neutral), to 5 (highly pleasant), the US intensity (i.e. “How intense did you find the electric stimulus”, with the possible answers being weak, moderate, intense, enormous, unbearable), and US startlingness (i.e. “How startling was the electric stimulus”), with possible answers being not, light, moderate, strong, too strong.
We collected state and trait anxiety scores by using the Dutch version of the State-Trait Anxiety Inventory (STAI) questionnaire (van der Ploeg, Citation2000), neuroticism scores by using the neuroticism scale of the Eysenck Personality Questionnaire (EPQ-N; Eysenck & Eysenck, Citation1975), and behavioural activation and inhibition scores by using the BIS/BAS scales (Carver & White, Citation1994). These scales tap individual differences that may be relevant with respect to avoidance learning (Lommen, Engelhard, & van den Hout, Citation2010).
1.3. Procedure
Participants first read the information brochure and signed the informed consent. Then, the shock electrodes were attached to the participant's non-dominant hand. The electric stimulus was adjusted individually to an unpleasant but not painful level. The STAI-S was completed next.
Before the beginning of the Pavlovian phase (see ), participants received verbal and written instructions informing them that they would see two different squares, and that one of the squares would sometimes be followed by an electric stimulus, and the other square would never be followed by an electric shock. Participants were informed that it was their task to learn the association between the different squares and the electric stimulus delivery. Then, the Pavlovian phase began. Each conditioning trial started with the presentation of one of the two CSs for 5 s. Then, the US expectancy scale was presented on the bottom of the screen for 5 s. Participants were asked to rate their US expectancies by moving the cursor with a standard computer mouse along the rating scale and clicking on the point of the scale that represented their expectancies best. In case they gave no response, the last location of the cursor at the end of the 5 s was saved ( of the trials). Stimulus A was followed by the US immediately after the termination of the trial. Stimulus B was not followed by the US. The inter-trial intervals ranged randomly between 2, 3, and 4 s. We used these short intervals because no physiological measures were used. The only differences in trial structure between the phases were whether participants were allowed to press the avoidance button or not (see below) and whether the US was administrated.
Table 1. Schematic of the experimental design used. The numbers within the brackets denote the number of trials for each stimulus.
Before the beginning of the Instrumental phase, participants were informed that in the next trials they might see the picture of a light bulb appear next to the CS. They were told that the light bulb indicated that they had the option to press the space bar within the first 5 s of a trial to cancel the upcoming US presentation at the end of the trial. Participants were informed that the lamp did not indicate that the shock would be presented but that participants had to decide whether or not they would press the button if they expected a shock at the end of a trial. Then, the instrumental phase began. During the instrumental trials, participants received the US at the end of a trial if they did not press the button during the first 5 s of a CS+ trial.
Before the Intervention phase, participants were only informed that the task would continue. In the intervention phase, they saw the CSs again, but the protocols differed per group. The ExRP did not see the light bulb at all during this phase and no CS was reinforced. The ConR group saw the light bulb; the light bulb signalled that they could keep pressing the space bar. However, in contrast to the Instrumental phase, pressing the button would result in the US presentation at the end of the trial, rather than the US absence. When participants did not press the space bar, no US was presented. The number of intervention trials (i.e. 30) was based on previous pilot studies that showed that lower numbers (i.e. 15 trials) were not enough for reducing avoidance.
After a short break, the Test phase began. Again, participants were only informed that the task would continue. During the trials of the test phase, the different CSs with the light bulb were presented. Finally, participants completed the remaining questionnaires and their fear ratings for each CS separately.
1.4. Statistical analyses
All VASs and background characteristics were analysed with separate independent samples t-tests. Potential between-group gender differences were investigated using a test. US expectancy ratings were analysed using separate, for each phase, 2 (CS: A, B)
(Group: ExRP vs. ConR) × Trial repeated measures ANOVAs, with 2 within-subject factors (CS, Trial) and 1 between-subject factor (Group). The levels of the Trial factor were adjusted according to the number of trials of each phase (see ). In case the assumption of sphericity was violated, we used the Greenhouse-Geisser correction.
Before analysing the avoidance data, we computed mean proportions of button presses (i.e. here operationalised as avoidance) separately for each phase and for each CS. Then, we ran two 2 (CS: A, B) (Group: ExRP vs. ConR) repeated measures ANOVAs, for the Instrumental and the Test phase separately. For the Intervention phase, we analysed the avoidance responses only for the ConR group with a 2 (CS: A, B) levels repeated measures ANOVA.
We have conducted our analyses within a Null-Hypothesis Significance Testing and a Bayesian framework. For the latter, we used the models in Rouder and Morey (Citation2012) and Rouder, Speckman, Sun, Morey, and Iverson (Citation2009). For the alternative hypotheses of each Bayesian analysis we used the default option which is a Cauchy distribution with mean at zero and a scale factor of 0.707. Similar results arose when we used a scale factor of 1. Bayes factors that quantify the evidence of the data under the experimental hypothesis, relative to the null hypothesis, are denoted with and
is used for the reversed.
2. Results
2.1. Demographics and self-reports
For the descriptives for each group separately, see supplementary material in Table S1. There was a trend for between-group differences in terms of age, , p = 0.054,
. Groups did not differ in terms of gender,
,
, the selected shock level,
, p = 0.258,
, US pleasantness, t < 1,
, US intensity,
, p = 0.092, and US startlingness,
,
. The group scores did not differ in terms of STAI-S, t < 1,
, STAI-T, t < 1,
, EPQ-N
, p = 0.135,
, BIS, t<1,
, or BAS, t < 1,
.
2.2. US expectancies
During the Pavlovian phase (Figure S1 and Tables S2, S3, and S4 in supplementary material), participants in both groups learned to expect the US after A and not after B, CS × Trial, , p < 0.001,
,
, CS × Trial × Group,
,
. In the Instrumental phase, participants differentiated between A and B, CS main effect,
, p < 0.001,
,
. This effect did not differ as a function of Trial, CS × Trial,
, p = 0.321,
,
, or Group, CS × Trial × Group,
, p=0.29,
,
. As expected, there were between-group differences in the intervention phase, CS × Trial × Group,
,
,
,
. Separate CS × Trial ANOVAs for each group showed that CS differentiation differed as a function of Trial for both groups: ConR group,
, p < 0.001,
,
, ExRP group,
,
,
,
. However, as shown in Figure S1 in supplementary material, this was due to different data patterns for each group. Shock expectancy to A started high and dropped sharply in the ExRP group and was the same as B about halfway the intervention phase, whereas in the ConRP group shock expectancy started low, increased after the first few reinforcements of the button press and stayed significantly higher for A than for B throughout the intervention phase. No between group differences were detected in the Test phase, CS × Trial × Group,
,
, and the CS differentiation remained, CS × Trial,
, p = 0.048,
,
.
2.3. Avoidance
During the Instrumental phase (), participants in both groups learned to avoid more often after the presentation of A compared to B, CS main effect, , p < 0.001,
,
, CS × Group,
,
. During the Intervention phase, participants in the ConR group still avoided more often the A compared to the B, CS main effect
, p = 0.007,
,
. Subsequent analysis after comparing the first and the last half of the trials showed that participants in the ConR group avoided more in the beginning of this phase, CS main effect,
, p < 0.001,
,
, compared to the end, CS main effect,
, p = 0.241,
,
, CS × Time,
, p < 0.001,
,
.
Figure 1. Mean proportion of avoidance responses (i.e. button presses) for each CS and for both groups during the instrumental (left), intervention (middle), and test phase (right). ExRP: Extinction plus response prevention group; ConR: Contingency reversal group. A and B refer to the used conditioned stimuli. Horizontal lines indicate significant differences for the bars at the edge of each line.
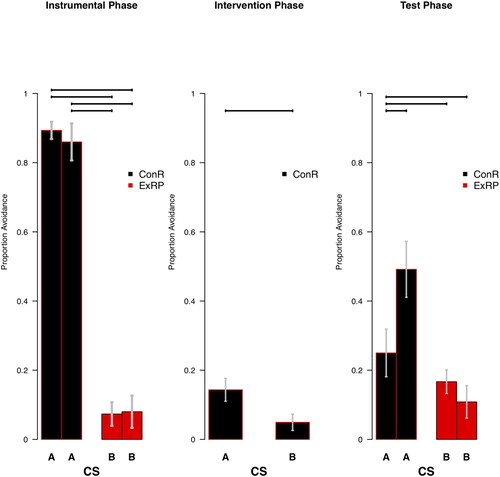
Importantly, and in line with our expectations, groups differed in the Test phase, CS × Trial × Group, , p = 0.02,
,
. Specifically, participants in ExRP group avoided more after A, compared to B, CS main effect
, p<0.001,
, whereas no such difference was detected for the ConR group, CS main effect
, p = 0.206,
.
2.4. Fear ratings
Regarding the fear ratings at the end of the experiment (Figure S2 in supplementary material), participants in both groups reported higher fear for A than B, CS ,
,
,
, CS × Group,
, p = 0.141,
,
.
3. Discussion and conclusions
We tested whether contingency reversal (ConR group), would lead to more avoidance reduction, compared to a standard ExRP procedure (ExRP group). Results showed that in the final test phase, the ConR group avoided less compared to the ExRP group, while US expectancy and fear ratings were similar across groups. To our knowledge, this is the first well-powered comparison of ConR and ExRP in humans.
The return of avoidance in the ExRP group can be explained by the dominance of the acquisition memory over the extinction memory in the test phase. In the ConR group, it appears that the meaning of the avoidance response has changed, from an action that cancels an aversive event to an action that causes it, which resembles counterconditioning procedures in Pavlovian learning (see Engelhard, Leer, Lange, & Olatunji, Citation2014 for research in humans and Brooks, Hale, Nelson, & Bouton, Citation1995; Wilson, Citation1973 for research in non-human animals). Apparently, participants in the ConR group learned that the avoidance response had become dysfunctional and stopped emitting it.
An alternative explanation of our results could be that during the intervention phase, participants in the ConR group switched from an active avoidance response (i.e. button press) to passive avoidance (i.e. button non-press). Although we cannot exclude this possibility, this would still mean that participants form a new memory during the intervention phase, although indeed with different content than the formation of an extinction memory. Still, this memory seems to be stronger than the original acquisition memory. Interestingly, based on our pilot studies, a lower number of trials (i.e. 15) was not sufficient for reducing avoidance responses.
In contrast to the avoidance results, the US expectancies and fear levels were similar across groups. The fear ratings results at the end of the experiment indicate that despite the reduction in avoidance for the ConR group, individuals continued to report more fear for A than for B. The interpretation of the US expectancy ratings should be done in light of the avoidance data. It appears that the ExRP group still expected the shock even after emitting the avoidance response, whereas the ConR group reported similar US expectancies without pressing the avoidance button. This discrimination in US expectancies and avoidance responding could be informative for theories that stress the relation between expectancies and avoidance (Lovibond, Citation2006).
We acknowledge that procedurally, contingency reversal is similar to punishment protocols typically used in animals (Azrin & Holz, Citation1966; Dinsmoor, Citation1977; Johnston, Citation1972; Sandler, Davidson, Greene, & Holzschuh, Citation1966). As explained above, however, we do not refer to the specific schedule as punishment as it also implies the reduction of behaviour, something that was the key question in the present study. Importantly, both unpublished results from our lab and published results from other (see Jean-Richard-Dit-Bressel, Killcross, & McNally, Citation2018 for a review), show that in humans punishment schedules may not always lead to the reduction of the behaviour in the long run, with the punished behaviour reappearing after the termination of the punishment schedule. This calls for the further investigation of the factors that govern such reduction.
Our paradigm resembles similar paradigms in which costs for an action are involved (e.g. Pittig, Citation2019). As in such paradigms, the contingency reversal introduces a cost that could motivate participants to stop performing the action because it has lost its functionality.
Despite the potential usefulness of this study in unveiling the mechanisms of reducing avoidance, there are two points that prevent the direct translation of our study to clinical populations. First, the association of a response to a negative outcome could prove emotionally challenging to individuals with a psychiatric disorder. Second, it remains to be seen whether the maintained fear levels may lead to the return of avoidance at a later stage. However, our study results suggest that it can be potentially more helpful to focus on reducing avoidance by focussing on instrumental schedules than on schedules that aim to enhance inhibitory learning of CS-noUS relationships (Craske et al., Citation2014).
Unfortunately, our study was not designed to address the continuous correlation between expectancy ratings and avoidance data on a trial-to-trial basis. Future studies could do this by modifying our methodology.
In summary, we have shown that contingency reversal leads to more avoidance reduction, compared to ExRP, at test despite similar levels of subjective fear (i.e. US-expectancy, fear ratings). Protocols that target avoidance responding by pairing it with costs could prove beneficial for reducing maladaptive avoidance.
Supplementary_Material
Download PDF (107.7 KB)Acknowledgements
We would like to thank Febe van der Flier for discussions during the set up of the experiment as well as Anna de Witt, Rosalie van der Meer, and Tessa Nederpel for their assistance with data collection. AMK is also affiliated with KU Leuven.
Data Availability Statement
The performance data of all participants are available at: https://osf.io/z45dx/. All data are fully anonymised.
Disclosure statement
No potential conflict of interest was reported by the author(s).
Additional information
Funding
Notes
1 Contingency reversal is similar to punishment protocols (Azrin & Holz, Citation1966; Dinsmoor, Citation1977; Johnston, Citation1972; Sandler et al., Citation1966). However, we abstain from using the term punishment because it refers not only to a procedure but also to an effect (behavior reduction), and whether this effect occurs is the key question here.
References
- American Psychiatric Association (2013). Diagnostic and statistical manual of mental disorders: DSM 5. Arlington, VA: American Psychiatric Publishing.
- Azrin, N. H., & Holz, W. C. (1966). Punishment. In W. K. Honig (Ed.), Operant behavior: Areas of research and application (pp. 380–447). New York: Appleton.
- Bouton, M. E. (2002). Context, ambiguity, and unlearning: Sources of relapse after behavioral extinction. Biological Psychiatry, 52, 976–986. doi: 10.1016/S0006-3223(02)01546-9
- Brooks, D. C., Hale, B., Nelson, J. B., & Bouton, M. E. (1995). Reinstatement after counterconditioning. Animal Learning & Behavior, 23, 383–390. doi: 10.3758/BF03198938
- Carver, C. S., & White, T. L. (1994). Behavioral inhibition, behavioral activation, and affective responses to impending reward and punishment: The BIS/BAS scales. Journal of Personality and Social Psychology, 67, 319–333. doi: 10.1037/0022-3514.67.2.319
- Craske, M. G., Treanor, M., Conway, C. C., Zbozinek, T., & Vervliet, B. (2014). Maximizing exposure therapy: An inhibitory learning approach. Behaviour Research and Therapy, 58, 10–23. doi: 10.1016/j.brat.2014.04.006
- Dinsmoor, J. A. (1977). Escape, avoidance, punishment: Where do we stand? Journal of the Experimental Analysis of Behavior, 28, 83–95. doi: 10.1901/jeab.1977.28-83
- Engelhard, I. M., Leer, A., Lange, E., & Olatunji, B. O. (2014). Shaking that icky feeling: Effects of extinction and counterconditioning on disgust-related evaluative learning. Behavior Therapy, 45, 708–719. doi: 10.1016/j.beth.2014.04.003
- Eysenck, H. J., & Eysenck, S. B. G. (1975). Manual of the Eysenck personality questionnaire (junior and adult). New York: Hodder & Stoughton.
- Jean-Richard-Dit-Bressel, P., Killcross, S., & McNally, G. P. (2018). Behavioral and neurobiological mechanisms of punishment: Implications for psychiatric disorders. Neuropsychopharmacology, 43, 1639–1650. doi: 10.1038/s41386-018-0047-3
- Johnston, J. M. (1972). Punishment of human behavior. American Psychologist, 27, 1033–1054. doi: 10.1037/h0033887
- Krypotos, A.-M., & Engelhard, I. M. (2018). Testing a novelty-based extinction procedure for the reduction of conditioned avoidance. Journal of Behavior Therapy and Experimental Psychiatry, 60, 22–28. doi: 10.1016/j.jbtep.2018.02.006
- Lommen, M. J., Engelhard, I. M., & van den Hout, M. A. (2010). Neuroticism and avoidance of ambiguous stimuli: Better safe than sorry? Personality and Individual Differences, 49, 1001–1006. doi: 10.1016/j.paid.2010.08.012
- Lovibond, P. F. (2006). Fear and avoidance: An integrated expectancy model. In M. G. Craske, D. Hermans, & D. Vansteenwegen (Eds.), Fear and learning: From basic processes to clinical implications (pp. 117–132). Washington, DC: American Psychological Association.
- Pittig, A. (2019). Incentive-based extinction of safety behaviors: Positive outcomes competing with aversive outcomes trigger fear-opposite action to prevent protection from fear extinction. Behaviour Research and Therapy, 121, 103463. doi: 10.1016/j.brat.2019.103463
- Pittig, A., Treanor, M., LeBeau, R. T., & Craske, M. G. (2018). The role of associative fear and avoidance learning in anxiety disorders: Gaps and directions for future research. Neuroscience & Biobehavioral Reviews, 88, 117–140. doi: 10.1016/j.neubiorev.2018.03.015
- Rouder, J. N., & Morey, R. D. (2012). Default Bayes factors for model selection in regression. Multivariate Behavioral Research, 47, 877–903. doi: 10.1080/00273171.2012.734737
- Rouder, J. N., Speckman, P. L., Sun, D., Morey, R. D., & Iverson, G. (2009). Bayesian t tests for accepting and rejecting the null hypothesis. Psychonomic Bulletin & Review, 16, 225–237. doi: 10.3758/PBR.16.2.225
- Sandler, J., Davidson, R. S., Greene, W. E., & Holzschuh, R. D. (1966). Effects of punishment intensity on instrumental avoidance behavior. Journal of Comparative and Physiological Psychology, 61, 212–216. doi: 10.1037/h0023149
- van der Ploeg, H. M. (2000). Handleiding bij de zelf-beoordelings vragenlijst, een nederlandse bewerking van de Spielberger Stait-Trait anxiety inventory, STAI-DY. Lisse: Swets en Zeitlinger.
- van Uijen, S. L., Leer, A., & Engelhard, I. M. (2018). Safety behavior after extinction triggers a return of threat expectancy. Behavior Therapy, 49, 450–458. doi: 10.1016/j.beth.2017.08.005
- Vervliet, B., & Indekeu, E. (2015). Low-cost avoidance behaviors are resistant to fear extinction in humans. Frontiers in Behavioral Neuroscience, 9, 351. doi: 10.3389/fnbeh.2015.00351
- Wilson, G. T. (1973). Counterconditioning versus forced exposure in extinction of avoidance responding and conditioned fear in rats. Journal of Comparative and Physiological Psychology, 82, 105–114. doi: 10.1037/h0033819