
ABSTRACT
To ensure that listeners pay attention and do not habituate, emotionally intense vocalizations may be under evolutionary pressure to exploit processing biases in the auditory system by maximising their bottom-up salience. This “salience code” hypothesis was tested using 128 human nonverbal vocalizations representing eight emotions: amusement, anger, disgust, effort, fear, pain, pleasure, and sadness. As expected, within each emotion category salience ratings derived from pairwise comparisons strongly correlated with perceived emotion intensity. For example, while laughs as a class were less salient than screams of fear, salience scores almost perfectly explained the perceived intensity of both amusement and fear considered separately. Validating self-rated salience evaluations, high- vs. low-salience sounds caused 25% more recall errors in a short-term memory task, whereas emotion intensity had no independent effect on recall errors. Furthermore, the acoustic characteristics of salient vocalizations were similar to those previously described for non-emotional sounds (greater duration and intensity, high pitch, bright timbre, rapid modulations, and variable spectral characteristics), confirming that vocalizations were not salient merely because of their emotional content. The acoustic code in nonverbal communication is thus aligned with sensory biases, offering a general explanation for some non-arbitrary properties of human and animal high-arousal vocalizations.
Introduction
Like other animals, humans communicate with a variety of nonverbal signals: we smile and frown at each other, giggle when tickled, scream when frightened, and so on. One way to describe these behaviours is to focus on the form of these signals. For instance, identifying the acoustic properties of nonverbal vocalizations that are associated with particular emotions (Anikin & Persson, Citation2017; Lima et al., Citation2013; Schröder et al., Citation2001) helps to clarify how meaning is encoded acoustically in these signals. In addition to such proximate or how questions, we can ask why signals assume this particular form, and not another (Tinbergen, Citation1963). Could we just as easily have evolved to laugh in sadness and to smile ferociously at our opponents? In this article I argue that high-intensity nonverbal vocalizations of humans, and presumably also of other animals, have non-arbitrary acoustic properties that make them maximally salient to the audience. In the rest of the text, I develop this “salience code” hypothesis of emotion expression, discuss the available evidence, and report the results of three perceptual experiments designed to test it.
Sensory biases
Researchers have long known that there are many similarities between the vocal signals of distantly related animal species. For example, in many mammals and birds aggressive calls are low-pitched and harsh, while friendly or appeasing calls are high-pitched and tonal (Morton, Citation1977; Ohala, Citation1984). Although not universal, this frequency code explains a large variety of vocal behaviours (August & Anderson, Citation1987; Briefer, Citation2012) and has a plausible cognitive mechanism, namely a reliably developing cross-modal association between auditory frequency and size (Hamilton-Fletcher et al., Citation2018; Spence, Citation2011).
Another dimension of affect (Russell, Citation1980), and a very common way to characterise both animal (Briefer, Citation2012; Filippi et al., Citation2017) and human (Lassalle et al., Citation2019; Lima et al., Citation2013; Lingle et al., Citation2012; Schröder et al., Citation2001) vocalizations, is the degree of physiological activation (arousal) or emotion intensity that they express. Acoustic changes associated with high arousal include increased duration with shorter pauses between syllables, high fundamental frequency (pitch), more high-frequency energy in the spectrum (bright timbre), variable pitch and sound intensity, and low harmonicity (a harsh voice quality; Briefer, Citation2012; Fitch et al., Citation2002; Lima et al., Citation2013; Lingle et al., Citation2012; Schröder et al., Citation2001). Confirming the predictable nature of high-arousal calls, participants recognise high emotion intensity not only in foreign languages (Lassalle et al., Citation2019), but even in calls of unfamiliar animal species (Filippi et al., Citation2017).
Many of the acoustic properties associated with high-intensity calls are direct consequences of the physiological changes triggered in the vocal apparatus by a powerful emotion. For example, activating laryngeal muscles and elevating subglottal pressure raises the pitch and makes the voice louder and brighter due to boosted harmonics (Gobl & Ní Chasaide, Citation2010). As vocal effort increases further, the vibration of vocal folds becomes irregular, causing unpredictable pitch jumps and other nonlinear phenomena that make the voice harsh (Fitch et al., Citation2002). The exact mechanisms linking emotion with vocal production are not yet sufficiently well understood (Gobl & Ní Chasaide, Citation2010), but they probably involve direct motor control of laryngeal and respiratory musculature as well as slower effects mediated by the autonomous nervous system and hormonal levels (LeDoux, Citation2012; Scherer, Citation1986).
Pushing the question one step further, however, what evolutionary pressures might have caused intense emotional states to have these specific effects on the voice? Because it is usually in the signaller’s interest to make high-intensity calls easy for conspecifics to detect and difficult to ignore, such calls may be under selective pressure to optimally activate the auditory system of receivers. This line of reasoning is known in biology as the sensory bias or sensory exploitation hypothesis (Ryan & Cummings, Citation2013). It was initially applied to the relatively narrow problem of sexual selection of male calls and visual ornaments to match the sensitivity of female peripheral receptors. The hypothesis remains controversial in this original context (Fuller et al., Citation2005; Ron, Citation2008), but the logic behind it is more general. Perception has evolved to promote survival and reproduction, rather than to represent the external world accurately (Neuhoff, Citation2018), and the resulting perceptual distortions or biases – such as enhanced sensitivity to particular sensory features – can be exploited by signallers.
Naturally, in the long run signal production and perception must coevolve. In the case of vocalizations, this is particularly manifest for specialised adaptations such as echolocation that simultaneously place new demands on both vocal production and auditory processing. In general, the auditory system is tuned for optimal discrimination of biologically relevant sounds (Woolley et al., Citation2005), and adaptations such as improved hearing in the most relevant frequency ranges have been described in mammals at large (Stebbins, Citation1980) as well as in individual species (Theunissen & Elie, Citation2014). However, the key assumption behind the sensory bias hypothesis is that production often outpaces perception in terms of the speed and flexibility of its evolution. For example, reptiles and birds neither hear nor produce sounds above approximately 10 kHz because their middle ear is anatomically incapable of handling high frequencies; in contrast, the independently evolved mammalian middle ear is well-equipped to exploit this frequency range, and many mammals have evolved ultrasonic calls for communication or echolocation (Köppl, Citation2009; Stebbins, Citation1980).
Apart from evolvability constraints, the auditory system must perceive and localise (Köppl, Citation2009) not only vocalizations, but also environmental sounds, which have very different acoustic properties (Singh & Theunissen, Citation2003; Smith & Lewicki, Citation2006). This relative inertia of auditory perception is illustrated by the fact that hominins rapidly evolved very specific neurological adaptations for speech, while the auditory system remained similar to that of other apes (Fitch, Citation2018). In fact, human speech combines the acoustic features of environmental sounds and vocalizations, possibly to match the preferred input to the auditory system (Smith & Lewicki, Citation2006; Theunissen & Elie, Citation2014).
In sum, with regard to meaningful acoustic variation within a species’ repertoire and on shorter time scales, vocal production is more likely to adapt to the auditory perception than the other way round. Accordingly, vocalizations associated with intense emotional states may have been under evolutionary pressure to “tickle the brain” – that is, to involuntarily attract and hold the attention of conspecifics.
Salience
The capacity of sensory stimuli for commanding attention in a bottom-up, involuntary fashion is known as their salience and distinguished from the voluntary, top-down component of attention. The last decade has seen active development of experimental paradigms and computer algorithms for the evaluation of visual and, more recently, auditory salience. The most general finding is that salient sounds tend to be highly variable and unpredictable. Simply maintaining high intensity or periodically varying the sound is not enough to make it salient: even loud bursts become less surprising after a few repetitions (Huang & Elhilali, Citation2017; Kaya & Elhilali, Citation2017). In contrast, attention is drawn to unpredictable acoustic changes: a tone presented against a noisy background (Kayser et al., Citation2005), a random tone sequence (Southwell et al., Citation2017), a sudden change in overall amplitude (Kim et al., Citation2014) or in a particular frequency range (Kaya & Elhilali, Citation2014; Kayser et al., Citation2005), rapid amplitude modulation or “roughness” (Zhao et al., Citation2018), etc. There is also evidence that acoustic changes in a particular direction are experienced as more salient. For example, looming stimuli with increasing intensity are more salient than receding ones, perhaps as a defense mechanism for rapid detection of approaching hazards (Neuhoff, Citation2018; Tajadura-Jiménez et al., Citation2010). More generally, salient acoustic events are associated with sudden increases – rather than decreases – in loudness, pitch, spectral centroid (timbral brightness), harmonicity, and spectral bandwidth (Huang & Elhilali, Citation2017). In addition, long sounds are generally more salient than short ones (Kayser et al., Citation2005).
Although the research on auditory salience is still at an early stage, these characteristics of salient acoustic events appear to have many parallels with the most common characteristics of high-intensity vocalizations. As described above, greater duration, loudness, pitch, and a bright timbre are all associated with high general activation or arousal in both speech and animal vocalizations. High-intensity vocalizations also tend to be more variable, particularly due to the prevalence of nonlinear vocal phenomena, which elicit a stronger response from the audience (Reby & Charlton, Citation2012) and prevent habituation (Karp et al., Citation2014). In fact, crying babies and barking dogs are self-reported to be harder to ignore than specially designed sirens and fire alarms (Ball & Bruck, Citation2004), and it has been suggested that the acoustics of dog barks is functionally optimal for attracting the attention of humans (Jégh-Czinege et al., Citation2019). There is thus indirect evidence that sounds produced in highly aroused states possess many acoustic characteristics associated with auditory salience. To the best of my knowledge, this study is the first to test this salience code hypothesis empirically.
The present study
The chosen emotional sounds were human nonverbal vocalizations. Unlike speech, they are free from semantic confounds and language-specific phonological constraints. At the same time, nonverbal vocalizations express a wide range of emotions and related states such as pain (Anikin & Persson, Citation2017; Lima et al., Citation2013; Maurage et al., Citation2007). Moreover, similar sounds are produced by modern-day apes (Davila-Ross et al., Citation2009; Lingle et al., Citation2012), and at least some were presumably present in our prelinguistic hominin ancestors. To some extent, the results may therefore generalise to both speech and vocalizations of non-human mammals.
To avoid circularity, bottom-up salience of these vocalizations had to be measured independently of their emotional content. In contrast to vision research, where eye tracking gives a ground-truth measure of bottom-up salience (Kaya & Elhilali, Citation2017), there is no generally accepted method for measuring the salience of sounds. Various approaches have been explored: annotation of soundscapes (Kim et al., Citation2014), detection of targets against noisy backgrounds (Kaya & Elhilali, Citation2014; Kayser et al., Citation2005), distraction from a working memory task (Vachon et al., Citation2017), pairwise comparisons (Kayser et al., Citation2005), pupil dilation (Huang & Elhilali, Citation2017), microsaccade inhibition (Zhao et al., Citation2018), etc.
In this study two independent samples of participants provided two measures of salience: (1) self-reported salience based on explicit pairwise comparisons and (2) objective salience operationalised as the drop in performance in a short-term memory task. These two salience measures were then compared with the ratings of emotion intensity and the acoustic characteristics of experimental stimuli. The two key predictions were (1) that there would be a close match between perceived emotion intensity and auditory salience, and (2) that the acoustic characteristics of salient nonverbal vocalizations would be similar to the previously described predictors of salience in mixed synthetic and environmental sounds – that is, that the responsible acoustic features are a property of human auditory perception in general, rather than specific to emotional vocalizations.
Methods
Stimuli
The experimental stimuli (N = 128) were human nonverbal vocalizations of amusement, anger, disgust, effort, fear, pain, pleasure, and sadness: 8 male + 8 female = 16 sounds in each category (). Of these 128 sounds, 118 were selected from a corpus of spontaneous, non-staged vocalizations obtained from social media (Anikin & Persson, Citation2017), some of which were shortened to keep the duration of all stimuli under 3 s. The selected vocalizations were relatively free from background noise, and although audio quality was more variable than in studio recordings, a machine learning algorithm classified these sounds based on acoustic measurements with an accuracy on a par with human raters in the validation study (Anikin & Persson, Citation2017).
Table 1. Experimental stimuli.
Spontaneous sounds of anger, fear, and sadness consisted of high-intensity vocalizations such as high-pitched screams. To maintain a variety of intensity levels within each emotion, ten milder, intentionally produced vocalizations were added from another corpus (Maurage et al., Citation2007). To control for the tendency of high-pitched sounds to appear louder, the subjective loudness was estimated in sone (assuming sound pressure level of 70 dB above a reference value of 2 × 10⁻⁵ Pa) within each 200-ms frame throughout the duration of each sound. As a compromise between normalising for peak and average loudness, the stimuli were normalised for the 75% quantile of per-frame loudness values. Loudness estimation and normalisation, as well as the acoustic analysis of experimental stimuli, were performed using the R package soundgen (Anikin, Citation2019).
Acoustic analysis
Each sound was described with 22 acoustic parameters (italicised below) chosen to facilitate comparisons with previous research (Arnal et al., Citation2015; Huang & Elhilali, Citation2017):
General descriptives: duration, RMS amplitude (mean and SD across all frames), loudness in sone (mean and SD across all frames).
Intonation: to ensure optimal accuracy, all intonation contours were extracted manually using soundgen's interactive pitch editor pitch_app and summarised as mean pitch (on a musical scale) and its standard deviation (in semitones). Harmonics-to-noise ratio (HNR or harmonicity – a measure of tonality, the ratio of energy in the harmonic component and aperiodic noise) was estimated in each frame as the peak of autocorrelation function and summarised by its mean and SD across frames.
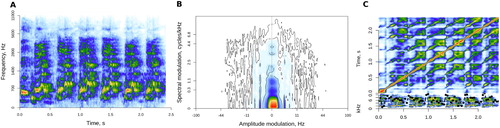
Auditory spectrum ((A)): the input for this analysis was a mel-transformed auditory spectrogram produced with melfcc function from tuneR package (Ligges et al., Citation2018) with 20 ms Hamming windows, a step of 5 ms, and 128 frequency bins on the mel scale. Following Huang and Elhilali (Citation2017), the spectrum of each frame was summarised by its centroid (centre of gravity, a measure of timbral brightness), bandwidth (weighted distance from the centroid), flatness (a ratio of geometric and arithmetic means), and irregularity (average difference in strength between adjacent frequency bins). Each of these four measures was then averaged across all frames (mean and SD).
Modulation spectrum ((B)): the result of a two-dimensional Fourier transform of a spectrogram, modulation spectrum represents the sound as a combination of amplitude and frequency modulation (Singh & Theunissen, Citation2003). It was extracted for an entire vocalisation, rather than per frame, using the modulationSpectrum function in soundgen. The result was summarised by the centroid of amplitude modulation (2–32 Hz) and frequency modulation (0–10 cycles/kHz; see Huang & Elhilali, Citation2017) as well as by the proportion of high-frequency amplitude modulation in the “roughness” range of 30–150 Hz (Arnal et al., Citation2015; Zhao et al., Citation2018).
Self-similarity matrix ((C)): this transformation represents the internal structure of a sound by comparing its parts to each other. The auditory spectrogram was divided into 40-ms windows, and cosine similarity was calculated for all window combinations, resulting in a square self-similarity matrix (SSM). Acoustic novelty was then calculated by sliding a 200-ms Gaussian checkerboard matrix along SSM's diagonal (Foote, Citation2000). Peaks in the novelty contour correspond to sudden changes in spectral structure on the time scale determined by the length of the checkerboard filter. The novelty contour of each sound was extracted using the ssm function in soundgen and summarised by its mean and SD.
Figure 1. Three representations of the same laugh: mel-scaled auditory spectrogram (A), modulation spectrum (B), and self-similarity matrix (C). SSM's lower panel shows the novelty contour (dotted black line) over the input spectrogram.
Procedure
Three experiments were performed to measure:
Emotion intensity. Participants rated the intensity of 128 sounds arranged into eight blocks, one block for each emotion. For example, for the 16 laughs in the “amusement” block the question was: “How intense is the amusement”? The order of both blocks and sounds within each block was randomised for each participant. The intensity was rated on a continuous horizontal scale ranging from mild to extreme. The sound could be repeated as many times as needed, and there was no time limit for responding.
Self-reported salience. A new sample of participants were presented with two sounds and asked: “Which sound is more attention-grabbing and harder to ignore?” They could then select one of the sounds or answer similar to indicate a tie. These comparisons were performed among all 128 sounds, rather than within one emotion category. Emotion was not mentioned in the instructions to avoid priming the subjects for thinking in terms of emotion intensity or arousal. The sounds could be replayed as many times as needed, and there was no time limit for responding. The order of sound pairs was randomised for each participant under the constraint that the same stimulus should never appear in two consecutive pairs. Each participant rated 100 sound pairs.
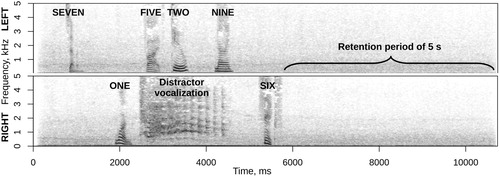
Objective salience. A new sample of participants had to memorise and repeat a spoken sequence of six numbers presented through earphones in one channel, while ignoring a distractor vocalisation in the other channel. The degree to which different distractor vocalizations disrupted accurate recall in this dichotic-listening short-term memory task was regarded as an implicit measure of their “objective” salience. A target sequence consisted of six non-repetitive single-digit numbers, each spoken by a random computer-synthesized voice and played with unpredictable timing from a randomly chosen stereo channel (left or right). About 10% of sequences did not contain a distractor, and the rest contained one vocalisation timed to coincide with the onset of one of the six spoken digits. Each distractor vocalisation could overlap with one to four targets, but never in the same channel (). To reduce the pop-out effect of any sound against silence, both targets and distractors were embedded in a background of steady street noise at 13 dB below the level of targets and distractors. High accuracy (4.8 out of 6 digits on average, all six correct in over half the trials) proves that targets could be clearly heard over both background and distractors. Fifty unique sequences were generated with each distractor vocalisation to cancel out possible effects of the timing and channel, incidental qualities of target sequences, and variations in the background noise. Pilot pre-testing revealed that estimating implicit salience required much more data compared to emotion intensity and self-reported salience. Accordingly, only half of the 128 vocalizations were tested (8 out of 16 in each emotion category, selected to preserve the full range of emotion intensity). Each trial began with the screen showing a fixation cross, while the participant listened to the sequence of digits followed by a five-second retention period. Five seconds after the last target a number pad appeared, and the participant had to enter target digits in the original order. Digits flashed green for correct responses and red for errors. The average accuracy was updated after each block and continuously displayed on the screen.
Figure 2. An example sequence with six target digits (715296) and a distractor (laugh) from the short-term memory experiment designed to obtain an implicit measure of salience. Spectrograms of left and right stereo channels with 25 ms Gaussian windows and 50% overlap.
Participants
Separate samples of participants, fluent in English and with no self-reported hearing problems, were recruited for the three experiments (self-reported salience, objective salience, and emotion intensity) on the online platform https://www.prolific.co/. No demographic characteristics were collected; according to the statistics on the website, about 75% of participants on this platform are native English speakers, 57% are female, and 72% are between 20 and 40 years of age. To ensure the quality of collected data, clearly invalid submissions were not considered or reimbursed (e.g. very rapid identical responses to many consecutive sounds). Additional verification steps were experiment-specific, such as catch trials with a pair of identical sounds (see Appendix for details). Since there were no expectations as to the effect size, power analysis was not performed, and data collection continued until the desired precision of a-posteriori estimates was achieved (Kelley et al., Citation2003), namely the width of 95% credible intervals of ± 5% for each sound for both emotion intensity and self-reported salience. Unfortunately, it proved unfeasible to achieve a comparable precision level for objective salience, even after limiting this analysis to 64 out of 128 vocalizations. The final sample sizes after quality control were as follows: emotion intensity N = 45 participants (5727 trials, 43–45 trials per sound), self-reported salience N = 90 (10146 trials, 128–200 trials per sound), objective salience N = 238 (11695 trials, 147–177 trials per sound).
Data analysis
All analyses were performed on unaggregated, trial-level data using Bayesian multilevel models, which are more flexible than the corresponding frequentist models and provide a natural framework for combining the results of multiple experiments. In Bayesian modelling, the output of the analysis is a posterior distribution of credible parameter values given the data, model structure, and prior assumptions (McElreath, Citation2018). These posterior distributions were summarised by their medians and 95% credible intervals, reported in the text as 95% CIs. Linear models were fit using the R package brms (Bürkner, Citation2017) with default conservative priors. To estimate salience scores for each sound based on pairwise comparisons in Experiment 2 (“self-reported salience”), a custom model was written directly in Stan (https://mc-stan.org/). The outcome distributions were as follows: beta for intensity scores, ordered logistic for pairwise comparisons, and zero-inflated binomial for recall errors, with appropriate random effects. Please see the Appendix for more details on data analysis. All materials for running the experiments (HTML, audio stimuli, etc.), datasets of responses, and scripts for statistical analysis can be downloaded from http://cogsci.se/publications.html.
Results
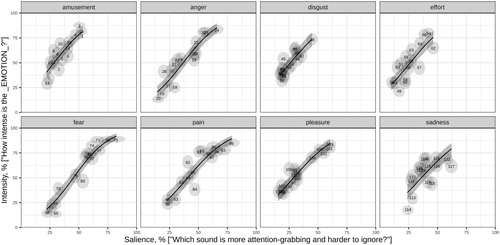
Salience scores extracted from pairwise comparisons of 128 vocalizations were excellent predictors of emotion intensity scores produced by a different sample of participants (R2 = .65 assuming a linear relationship), particularly within each emotion category (R2 = .81 after adding an interaction with emotion). The likely reason is that different emotions are expressed with distinct acoustic call types, whose auditory salience can be generally high (e.g. screams) or low (e.g. grunts or laughs). Thus, the most intense laughs had a salience score of only ∼50%, far below the top salience of screams of fear or pain. At the same time, salience scores almost perfectly explained the perceived intensity of both amusement and fear considered separately ().
Figure 3. Perceived intensity of emotion and self-reported salience of experimental stimuli. Light-gray ellipses mark the position of individual sounds (labelled 1 through 128) with two-dimensional 95% CIs. Solid lines show the relation between intensity and salience within each emotion class predicted with multilevel beta-regression, with shaded 95% CIs.
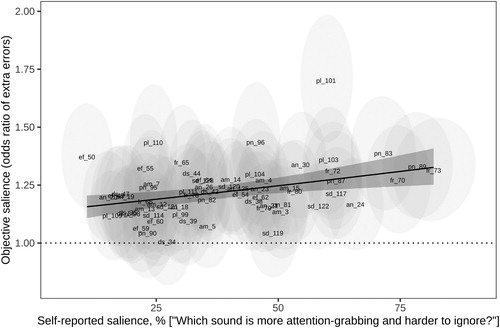
The average number of recall errors in the short-term memory task was about 22% higher with vs. without a distractor vocalisation: odds ratio (OR) = 1.22, 95% CI [1.14, 1.31]. The effect of different distractors varied greatly: 23 out of 64 vocalizations seemed to have little or no effect on recall accuracy (95% CI of the OR overlapped with one), while the remaining 41 vocalizations increased the odds of recall errors by up to 70% (). None of the analysed individual acoustic characteristics were significant predictors of recall errors, probably because of the relatively noisy nature of data from the memory task. However, both self-reported salience and intensity ratings were positive predictors of recall errors. The odds of a recall error were ∼25% higher for sounds with the highest vs. lowest salience score: OR = 1.25, 95% CI [1.08, 1.45]. Crucially, the positive effect of self-reported salience on recall errors remained essentially unchanged after controlling for the duration of distractor vocalisation (OR = 1.27 [1.06, 1.53]), while duration had no detectable independent effect on recall errors (OR = 0.98 [0.85, 1.13]). In other words, the elevated proportion of recall errors was not simply a matter of longer vocalizations obscuring more targets, but a result of greater distraction caused by salient vocalizations.
Figure 4. Extra errors attributable to the presence of a distractor vocalisation as a function of its self-reported salience. Light-gray ellipses mark the position of individual sounds (N = 64) with two-dimensional 95% CIs. The solid regression line shows the best fit with shaded 95% CI. The dotted line marks OR = 1 (as many errors as without any distractors). am = amusement, an = anger, ds = disgust, ef = effort, fr = fear, pn = pain, pl = pleasure, sd = sadness.
Likewise, vocalizations that were rated higher on emotion intensity were responsible for ∼16% more recall errors: OR = 1.16 [1.02, 1.32] for maximum vs. minimum intensity. However, multiple regression suggests that perceived emotion intensity had no independent effect on recall errors (OR = 0.99 [0.77, 1.25]) after controlling for self-reported salience (OR = 1.26 [0.96, 1.70]). In other words, participants were easily distracted by vocalizations suggestive of high emotion intensity, but this effect was mediated by the auditory salience of these sounds.
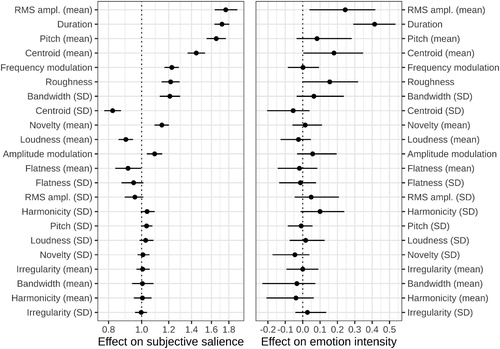
To see how well relative salience judgments could be predicted from low-level acoustic characteristics, the choice between two sounds in each trial was modelled as a function of their difference on 22 acoustic characteristics. A multilevel ordered logistic regression model correctly predicted ∼66% of participants’ responses in a three-choice task (chance level = 33%) and identified the acoustic characteristics that made a vocalisation highly salient: greater RMS amplitude and duration, higher pitch and spectral centroid (brightness), more variable bandwidth, more high-frequency modulation (roughness, amplitude and frequency modulation), higher novelty derived from the self-similarity matrix, and a few weaker predictors such as low spectral flatness and more variable harmonicity (, left panel). Likewise, intensity scores were predicted from the acoustic characteristics of each sound scaled relative to other sounds expressing the same emotion (, right panel). Since the stimuli were normalised for subjective loudness, its average level did not vary much, but the lack of effect of the variability in loudness is surprising, and so is the weak effect of pitch variability. Otherwise, these findings are in line with theoretical predictions: emotional vocalizations attract more attention if they produce a greater excitation in the auditory system due to the intensity and unpredictability of sensory stimulation.
Figure 5. Acoustic predictors of self-reported salience (left panel; odds scale, i.e. no effect = 1) and emotion intensity (right panel; linear scale, i.e. no effect = 0). Beta-coefficients from multiple regression showing the effect of a 1 SD difference in each acoustic characteristic, with 95% CI. Mirroring the design of the two experiments, acoustic predictors were normalised across all sounds for salience and within emotion category for intensity; the magnitude of effects is directly comparable within each panel.
Discussion
In line with the salience code hypothesis, high-intensity nonverbal vocalizations displayed acoustic characteristics previously reported to be associated with high bottom-up auditory salience. These acoustic properties made emotionally intense vocalizations more effective at involuntarily attracting the listeners’ attention based on both self-reported distraction and an objectively measured drop in accuracy on a short-term memory task. In fact, the relationship between self-rated salience and emotion intensity ratings was so tight as to raise the suspicion that participants interpreted the two questions as synonymous, or that emotion intensity mediated both salience ratings and recall errors.
Several pieces of evidence argue against this interpretation. Multiple regression analysis suggests that salience ratings mediated the effect of emotion intensity on recall errors in a short-term memory task, not the other way round. Furthermore, the predictors of self-reported salience in emotional vocalizations were in line with psychoacoustic research on auditory salience, which is conducted using mixed vocal and environmental sounds, rather than emotional stimuli (Huang & Elhilali, Citation2017; Kayser et al., Citation2005; Zhao et al., Citation2018). In other words, high-intensity emotional vocalizations competed with goal-directed attention and were rated as highly distracting mostly because of their low-level acoustic characteristics, and not because listeners interpreted them as conveying a strong emotion.
It is also noteworthy that the correlation between salience and intensity ratings (which were provided by independent samples of participants) was considerably higher within each emotion category than across all 128 sounds. Each emotion was expressed with one or several, partly distinct types of sounds (laughs of amusement, moans and sighs of pleasure, etc.; see ). These call types differ in their eliciting context and overall salience in addition to displaying meaningful within-call variation (Briefer, Citation2012; Fischer et al., Citation2017). For example, grunts and groans of disgust convey a wide range of intensity levels, although even the most intense ones are acoustically less salient than screams of relatively mild pain or fear (). At the same time, grunts with higher bottom-up salience express stronger disgust, and likewise, more salient screams are associated with more intense fear. The salience code reported here thus informs relatively subtle within-call acoustic variation, and not only qualitative differences between generally high-arousal (screams, roars) and low-arousal (sighs, moans) call types.
Vocalizations with high bottom-up salience possessed three acoustic characteristics. First, they were longer and louder, presumably causing more excitation in afferent sensory pathways. Second, salient sounds were highly variable and unpredictable, as reflected in such acoustic measures as amplitude and frequency modulation, roughness, variability in spectral bandwidth and harmonicity, and novelty extracted from self-similarity matrices. From a predictive coding perspective, unpredictability in sensory input causes a mismatch with top-down expectations, attracting attention and making it difficult to ignore the elusive stimulus (Kaya & Elhilali, Citation2014; Southwell et al., Citation2017). Third, salient vocalizations tended to have relatively high pitch and a bright timbre, as also reported by Huang and Elhilali (Citation2017). The mechanisms responsible for this effect are less clear. High-frequency sounds appear to be louder than low-frequency sounds of the same amplitude, but subjective loudness was controlled in this study, and the effect of pitch on salience was too large to be attributable to any remaining variations in loudness. Possibly, high-pitched vocalizations with strong harmonics were interpreted as evidence of high vocal effort (Gobl & Ní Chasaide, Citation2010), capturing attention in a top-down manner. Likewise, certain sounds, such as sexual moans #101 and 110 (), caused unexpectedly large drops in task performance, again suggesting a possible role of top-down attention.
This ambiguity highlights the difficulty of isolating purely bottom-up attentional mechanisms or measuring salience as a property fully encapsulated from top-down control (Huang & Elhilali, Citation2017). In real-life encounters, listeners take into account the speaker's identity, sex, age, facial expression, and other available contextual information, which may considerably affect the allocation of attention predicted by a purely bottom-up model. But even in a controlled experiment, it is challenging to separate bottom-up from top-down influences.
Another limitation of the present study is that it relied on the perceived emotion intensity rather than the actual (unknown) affective state of the speaker. As a result, while the current results demonstrate a close correlation between how emotionally intense and how distracting a vocalisation is perceived to be, it remains an assumption that this perceived intensity is an accurate reflection of the speaker's arousal level. Listeners are good at identifying the emotion portrayed with nonverbal vocalizations (Lima et al., Citation2013; Maurage et al., Citation2007) as well as the production context of unstaged, naturalistic vocalizations of the kind used in this study (Anikin & Persson, Citation2017). Even so, in future studies it would be important to map neurological and somatic markers of the intensity of particular emotions or overall arousal, such as changes in skin conductance, onto the accompanying changes in vocal production instead of relying on subjective ratings of listeners. Another productive avenue for follow-up research would be to systematically manipulate salience-relevant acoustic characteristics of emotional speech or vocalizations. As our understanding of bottom-up auditory salience keeps improving, very specific hypotheses can be formulated and tested to either support or falsify the claim that more salient vocalizations convey – or are perceived to convey – more intense emotions. If the salience code is confirmed and shown to be generalisable beyond human nonverbal vocalizations, it can provide a powerful framework for guiding research on acoustic communication and integrating it with the neuroscience of auditory perception.
Returning to the ultimate question of evolutionary causation, I would argue that the salience code of emotion expression described here is best seen as an example of sensory exploitation. The initial selective pressures would presumably have affected the vocalizations emitted in high-stake, survival-relevant contexts: infant separation cries (Lingle et al., Citation2012), anti-predator alarm calls of varying urgency (Manser, Citation2001), aggressive and mating calls (Reby & Charlton, Citation2012), etc. Natural selection would have favoured changes in the physiological links between arousal and voice production that made high-intensity vocalizations of this kind easier for conspecifics to notice and harder to ignore. Once established, these physiological links would then automatically generalise to all vocal behaviours, explaining why even close-range vocalizations, such as grunts of disgust and moans of pleasure, obey the same salience code.
Other explanations are also possible. If vocal production and auditory perception have been co-evolving closely (Ron, Citation2008), the match between emotion intensity and bottom-up salience could be the result of the auditory system being exquisitely tuned to the acoustic properties of high-intensity calls, either innately or as a result of developmental plasticity and increasing sensitivity to the typical or most relevant sensory input (Bao, Citation2015; Woolley et al., Citation2005). The properties of high-intensity vocalizations, in turn, may be shaped by factors unrelated to salience, such as the need for the caller to demonstrate his fitness and stamina by producing long, loud, and high-pitched vocalizations (Fischer et al., Citation2004). For instance, Ma and Thompson (Citation2015) hypothesised that acoustic correlates of emotion (such as intensity, production rate, and spectral characteristics) have evolved to be affected by emotion because they reveal important biological information about the speaker, such as their size, proximity, and speed.
Whatever the exact evolutionary story, efficient communication requires some coordination between the form of signals and sensory biases. The close correspondence between the effects of strong emotion on the voice and the sensitivity of the auditory system demonstrated in this study is an example of this communicative principle, and possibly also a general explanation for some non-arbitrary properties of human and animal high-arousal vocalizations.
Acknowledgments
I would like to thank Tomas Persson and Peter Gärdenfors for their comments on the manuscript.
Disclosure statement
No potential conflict of interest was reported by the author(s).
Data availability statement
All materials for running the experiments (HTML, audio stimuli, etc.), datasets of responses, and scripts for statistical analysis can be downloaded from http://cogsci.se/publications.html.
Additional information
Funding
References
- Anikin, A. (2019). Soundgen: An open-source tool for synthesizing nonverbal vocalizations. Behavior Research Methods, 51(2), 778–792. https://doi.org/10.3758/s13428-018-1095-7
- Anikin, A., & Persson, T. (2017). Non-linguistic vocalizations from online amateur videos for emotion research: A validated corpus. Behavior Research Methods, 49(2), 758–771. https://doi.org/10.3758/s13428-016-0736-y
- Arnal, L. H., Flinker, A., Kleinschmidt, A., Giraud, A. L., & Poeppel, D. (2015). Human screams occupy a privileged niche in the communication soundscape. Current Biology, 25(15), 2051–2056. https://doi.org/10.1016/j.cub.2015.06.043
- August, P. V., & Anderson, J. G. (1987). Mammal sounds and motivation-structural rules: A test of the hypothesis. Journal of Mammalogy, 68(1), 1–9. https://doi.org/10.2307/1381039
- Ball, M., & Bruck, D. (2004, October 1–3). The salience of fire alarm signals for sleeping individuals: A novel approach to signal design. Proceedings of the Third Human Behaviour in Fire Conference (pp. 303–314), Belfast, Northern Ireland, UK.
- Bao, S. (2015). Perceptual learning in the developing auditory cortex. European Journal of Neuroscience, 41(5), 718–724. https://doi.org/10.1111/ejn.12826
- Briefer, E. F. (2012). Vocal expression of emotions in mammals: Mechanisms of production and evidence. Journal of Zoology, 288(1), 1–20. https://doi.org/10.1111/j.1469-7998.2012.00920.x
- Bürkner, P. C. (2017). Brms: An R package for Bayesian multilevel models using Stan. Journal of Statistical Software, 80(1), 1–28. https://doi.org/10.18637/jss.v080.i01
- Davila-Ross, M. D., Owren, M. J., & Zimmermann, E. (2009). Reconstructing the evolution of laughter in great apes and humans. Current Biology, 19(13), 1106–1111. https://doi.org/10.1016/j.cub.2009.05.028
- Filippi, P., Congdon, J. V., Hoang, J., Bowling, D. L., Reber, S. A., Pašukonis, A., Hoeschele, M., Ocklenburg, S., de Boer, B., Sturdy, C. B., Newen, A., & Güntürkün, O. (2017). Humans recognize emotional arousal in vocalizations across all classes of terrestrial vertebrates: Evidence for acoustic universals. Proceedings of the Royal Society B: Biological Sciences, 284(1859), Article 20170990. https://doi.org/10.1098/rspb.2017.0990
- Fischer, J., Kitchen, D. M., Seyfarth, R. M., & Cheney, D. L. (2004). Baboon loud calls advertise male quality: Acoustic features and their relation to rank, age, and exhaustion. Behavioral Ecology and Sociobiology, 56(2), 140–148. https://doi.org/10.1007/s00265-003-0739-4
- Fischer, J., Wadewitz, P., & Hammerschmidt, K. (2017). Structural variability and communicative complexity in acoustic communication. Animal Behaviour, 134, 229–237. https://doi.org/10.1016/j.anbehav.2016.06.012
- Fitch, W. T. (2018). The biology and evolution of speech: A comparative analysis. Annual Review of Linguistics, 4, 255–279. https://doi.org/10.1146/annurev-linguistics-011817-045748
- Fitch, W. T., Neubauer, J., & Herzel, H. (2002). Calls out of chaos: The adaptive significance of nonlinear phenomena in mammalian vocal production. Animal Behaviour, 63(3), 407–418. https://doi.org/10.1006/anbe.2001.1912
- Foote, J. (2000, July). Automatic audio segmentation using a measure of audio novelty. In Proceedings of IEEE 2000 international conference on multimedian and expo (pp. 452–455). New York: IEEE.
- Fuller, R. C., Houle, D., & Travis, J. (2005). Sensory bias as an explanation for the evolution of mate preferences. The American Naturalist, 166(4), 437–446. https://doi.org/10.1086/444443
- Gobl, C., & Ní Chasaide, A. (2010). Voice source variation and its communicative functions. In W. J. Hardcastle, J. Laver, & F. E. Gibbon (Eds.), The handbook of phonetic sciences (2nd ed., pp. 378–423). Wiley-Blackwell.
- Hamilton-Fletcher, G., Pisanski, K., Reby, D., Stefańczyk, M., Ward, J., & Sorokowska, A. (2018). The role of visual experience in the emergence of cross-modal correspondences. Cognition, 175, 114–121. https://doi.org/10.1016/j.cognition.2018.02.023
- Huang, N., & Elhilali, M. (2017). Auditory salience using natural soundscapes. The Journal of the Acoustical Society of America, 141(3), 2163–2176. https://doi.org/10.1121/1.4979055
- Jégh-Czinege, N., Faragó, T., & Pongrácz, P. (2019). A bark of its own kind: The acoustics of ‘annoying’ dog barks suggests a specific attention-evoking effect for humans. Bioacoustics, 1–16. https://doi.org/10.1080/09524622.2019.1576147
- Karp, D., Manser, M. B., Wiley, E. M., & Townsend, S. W. (2014). Nonlinearities in meerkat alarm calls prevent receivers from habituating. Ethology, 120(2), 189–196. https://doi.org/10.1111/eth.12195
- Kaya, E. M., & Elhilali, M. (2014). Investigating bottom-up auditory attention. Frontiers in Human Neuroscience, 8, 327. https://doi.org/10.3389/fnhum.2014.00327
- Kaya, E. M., & Elhilali, M. (2017). Modelling auditory attention. Philosophical Transactions of the Royal Society B: Biological Sciences, 372(1714), 1–10. Article 20160101. https://doi.org/10.1098/rstb.2016.0101
- Kayser, C., Petkov, C. I., Lippert, M., & Logothetis, N. K. (2005). Mechanisms for allocating auditory attention: An auditory saliency map. Current Biology, 15(21), 1943–1947. https://doi.org/10.1016/j.cub.2005.09.040
- Kelley, K., Maxwell, S. E., & Rausch, J. R. (2003). Obtaining power or Obtaining Precision. Evaluation & the Health Professions, 26(3), 258–287. https://doi.org/10.1177/0163278703255242
- Kim, K., Lin, K. H., Walther, D. B., Hasegawa-Johnson, M. A., & Huang, T. S. (2014). Automatic detection of auditory salience with optimized linear filters derived from human annotation. Pattern Recognition Letters, 38, 78–85. https://doi.org/10.1016/j.patrec.2013.11.010
- Köppl, C. (2009). Evolution of sound localisation in land vertebrates. Current Biology, 19(15), R635–R639. https://doi.org/10.1016/j.cub.2009.05.035
- Lassalle, A., Pigat, D., O’Reilly, H., Berggen, S., Fridenson-Hayo, S., Tal, S., Elfström, S., Råde, A., Golan, O., Bölte, S., Baron-Cohen, S., & Lundqvist, D. (2019). The EU-emotion voice database. Behavior Research Methods, 51(2), 493–506. https://doi.org/10.3758/s13428-018-1048-1
- LeDoux, J. (2012). Rethinking the emotional brain. Neuron, 73(4), 653–676. https://doi.org/10.1016/j.neuron.2012.02.004
- Ligges, U., Krey, S., Mersmann, O., & Schnackenberg, S. (2018). tuneR: Analysis of music and speech. https://CRAN.R-project.org/package=tuneR
- Lima, C. F., Castro, S. L., & Scott, S. K. (2013). When voices get emotional: A corpus of nonverbal vocalizations for research on emotion processing. Behavior Research Methods, 45(4), 1234–1245. https://doi.org/10.3758/s13428-013-0324-3
- Lingle, S., Wyman, M. T., Kotrba, R., Teichroeb, L. J., & Romanow, C. A. (2012). What makes a cry a cry? A review of infant distress vocalizations. Current Zoology, 58(5), 698–726. https://doi.org/10.1093/czoolo/58.5.698
- Ma, W., & Thompson, W. F. (2015). Human emotions track changes in the acoustic environment. Proceedings of the National Academy of Sciences, 112(47), 14563–14568. https://doi.org/10.1073/pnas.1515087112
- Manser, M. B. (2001). The acoustic structure of suricates’ alarm calls varies with predator type and the level of response urgency. Proceedings of the Royal Society of London. Series B: Biological Sciences, 268(1483), 2315–2324. https://doi.org/10.1098/rspb.2001.1773
- Maurage, P., Joassin, F., Philippot, P., & Campanella, S. (2007). A validated battery of vocal emotional expressions. Neuropsychological Trends, 2(1), 63–74.
- McElreath, R. (2018). Statistical rethinking: A Bayesian course with examples in R and Stan. Chapman and Hall/CRC.
- Morton, E. S. (1977). On the occurrence and significance of motivation-structural rules in some bird and mammal sounds. The American Naturalist, 111(981), 855–869. https://doi.org/10.1086/283219
- Neuhoff, J. G. (2018). Adaptive biases in visual and auditory looming perception. In T. L. Hubbard (Ed.), Spatial biases in perception and cognition (pp. 180–190). Cambridge University Press.
- Ohala, J. J. (1984). An ethological perspective on common cross-language utilization of F₀ of voice. Phonetica, 41(1), 1–16. https://doi.org/10.1159/000261706
- Reby, D., & Charlton, B. D. (2012). Attention grabbing in red deer sexual calls. Animal Cognition, 15(2), 265–270. https://doi.org/10.1007/s10071-011-0451-0
- Ron, S. R. (2008). The evolution of female mate choice for complex calls in túngara frogs. Animal Behaviour, 76(6), 1783–1794. https://doi.org/10.1016/j.anbehav.2008.07.024
- Russell, J. A. (1980). A circumplex model of affect. Journal of Personality and Social Psychology, 39(6), 1161–1178. https://doi.org/10.1037/h0077714
- Ryan, M. J., & Cummings, M. E. (2013). Perceptual biases and mate choice. Annual Review of Ecology, Evolution, and Systematics, 44, 437–459. https://doi.org/10.1146/annurev-ecolsys-110512-135901
- Scherer, K. R. (1986). Vocal affect expression: A review and a model for future research. Psychological Bulletin, 99(2), 143–165. https://doi.org/10.1037/0033-2909.99.2.143
- Schröder, M., Cowie, R., Douglas-Cowie, E., Westerdijk, M., & Gielen, S. (2001, September 3–7). Acoustic correlates of emotion dimensions in view of speech synthesis. Proceedings of Eurospeech 2001, Aalborg, Denmark.
- Singh, N. C., & Theunissen, F. E. (2003). Modulation spectra of natural sounds and ethological theories of auditory processing. The Journal of the Acoustical Society of America, 114(6), 3394–3411. https://doi.org/10.1121/1.1624067
- Smith, E. C., & Lewicki, M. S. (2006). Efficient auditory coding. Nature, 439(7079), 978–982. https://doi.org/10.1038/nature04485
- Southwell, R., Baumann, A., Gal, C., Barascud, N., Friston, K., & Chait, M. (2017). Is predictability salient? A study of attentional capture by auditory patterns. Philosophical Transactions of the Royal Society B: Biological Sciences, 372(1714), 1–11. Article 20160105. https://doi.org/10.1098/rstb.2016.0105
- Spence, C. (2011). Crossmodal correspondences: A tutorial review. Attention, Perception, & Psychophysics, 73(4), 971–995. https://doi.org/10.3758/s13414-010-0073-7
- Stebbins, W. C. (1980). The evolution of hearing in the mammals. In A. Popper & R. Fay (Eds.), Comparative studies of hearing in vertebrates (pp. 421–436). Springer.
- Tajadura-Jiménez, A., Väljamäe, A., Asutay, E., & Västfjäll, D. (2010). Embodied auditory perception: The emotional impact of approaching and receding sound sources. Emotion, 10(2), 216–229. https://doi.org/10.1037/a0018422
- Theunissen, F. E., & Elie, J. E. (2014). Neural processing of natural sounds. Nature Reviews Neuroscience, 15(6), 355–366. https://doi.org/10.1038/nrn3731
- Tinbergen, N. (1963). On aims and methods of ethology. Zeitschrift für tierpsychologie, 20(4), 410–433. https://doi.org/10.1111/j.1439-0310.1963.tb01161.x
- Vachon, F., Labonté, K., & Marsh, J. E. (2017). Attentional capture by deviant sounds: A noncontingent form of auditory distraction? Journal of Experimental Psychology: Learning, Memory, and Cognition, 43(4), 622–634. https://doi.org/10.1037/xlm0000330
- Woolley, S. M., Fremouw, T. E., Hsu, A., & Theunissen, F. E. (2005). Tuning for spectro-temporal modulations as a mechanism for auditory discrimination of natural sounds. Nature Neuroscience, 8(10), 1371–1379. https://doi.org/10.1038/nn1536
- Zhao, S., Yum, N. W., Benjamin, L., Benhamou, E., Furukawa, S., Dick, F., & Chait, M. (2018). Rapid ocular responses are a robust marker for bottom-up driven auditory salience. BioRxiv, Article 498485.
Appendix: Supplemental Methods
Experiment 1: emotion intensity
Participants
Four out of 50 participants were excluded for obvious cheating (very rapid identical responses to many consecutive sounds), and another was excluded based on very low (r < .05) correlation of the provided scores with the median scores of all other participants, suggesting random responses. The remaining sample size was thus 45 – that is, each sound was rated 45 times. This sample size ensured that the average width of 95% CIs on emotion intensity estimates per sound was approximately ± 5%.
Data analysis
Intensity ratings were modelled as beta-distributed, with random intercepts per sound and per participant. Modelling the differences between sounds as a random effect made the model more sparse compared to estimating 128 independent coefficients, thereby decreasing the risk of overfitting. To analyse the relationship between salience and emotion intensity, fitted self-reported salience values from Experiment 2 were added as a predictor, with a random slope per emotion. For plotting purposes, uncertainty from both experiments was incorporated by making repeated random draws from both posteriors, resulting in two-dimensional credible intervals ( in the main text). Acoustic predictors of emotion intensity were determined by normalising (z-transforming) acoustic characteristics of sounds within each emotion category and using them as predictors of trial-level intensity scores. Modelling was performed with default conservative priors in the brms package, but models with acoustic predictors imposed additional shrinkage on regression coefficients with a horseshoe prior to control for multiple comparisons.
Experiment 2: self-reported salience
Participants
Participants were recruited until the precision of salience estimates was similar to that in Experiment 1 (95% CI ± 5% for each sound); each participant rated 100 or 128 sound pairs. Two verification steps were employed to ensure data quality. First, there were three catch trials with a pair of identical sounds, which were expected to be ranked as similar. Second, the average salience was estimated based on all responses, and the proportion of responses violating this average ranking was calculated for each participant. On average, participants made choices that contradicted the population consensus in 12% of trials; if this proportion exceeded 20% (cutoff chosen based on an analysis of random response patterns), the participant was excluded from the analysis. Based on these two criteria, 12 out of 102 submissions were excluded, resulting in a final sample size of 90 participants. In a sensitivity analysis, salience estimates based on the full (N = 102) and high-quality (n = 90) samples were almost perfectly correlated (r = .998), indicating that the exclusion of 12 participants had only a negligible effect on results.
Data analysis
It was assumed that the choice between two sounds reflected the distance between them on a unidimensional salience scale: participants would respond sound 1 if the difference in salience between sounds 1 and 2 was large and positive, sound 2 if it was large and negative, and similar (tie) if it was close to zero. The threshold for calling a tie was assumed to vary across individuals, and the latent salience variable was mapped onto responses via ordered logistic regression. The corresponding Bayesian model was written in Stan (https://mc-stan.org/) and accessed from R (https://cran.r-project.org/). The latent salience variable is underspecified; to ensure convergence, the position of the first sound was therefore fixed at zero, and the overall scale was set by the normal prior on salience scores with an arbitrarily chosen standard deviation. To facilitate comparisons with intensity scores in Experiment 1, the posterior distribution of salience estimates was normalised to range from 0% to 100%.
To check the consistency of responses, the dataset was repeatedly split into two halves (45 participants each), salience ratings were calculated using a simple heuristic (+1 to the chosen sound and −1 to the other sound in each trial, ignoring ties) in each half-dataset, and then the resulting salience scores were correlated. Averaging over 1000 iterations, this correlation was r = .95, 95% CI [.94, .96], suggesting that different groups of participants largely agreed about which sounds were more and which less salient. Acoustic predictors of salience were determined by modelling trial-level choices in pairwise comparisons with ordered logistic regression based on the difference between the two sounds on acoustic characteristics normalised (z-transformed) across all 128 stimuli.
Experiment 3: objective salience
Participants
The required sample size was estimated in a pilot study with 24 vocalizations, aiming to achieve reasonable precision on the estimates of effect size for each vocalisation (extra errors attributable to its presence compared to no distractor). Another 40 vocalizations were then tested with a new sample of participants. Accuracy was high (36% to 100% per participant, 95% of submissions over 50% correct), so all submissions with minimum 40 out of 50 trials were included.
Data analysis
The number of errors per sequence was modelled as a draw from a zero-inflated binomial distribution with six trials (one for each digit), with a random intercept per participant to account for individual variability in general performance and another random intercept per distractor, with 65 levels (64 for different vocalizations and one for “none”). First, a model with no fixed effects was constructed to evaluate the expected number of errors for each vocalisation (including “none”). The objective salience of each vocalisation was operationalised as the ratio of the odds of making an error with a particular distractor vocalisation vs. without any distractors. This odds ratio (OR) was calculated for each step in the MCMC chain and summarised as the median and 95% coverage interval.
Second, a similar model was constructed only for those trials that included a distractor vocalisation to test whether acoustic characteristics of distractor vocalizations and their intensity and salience ratings from Experiments 1 and 2 predicted the number of errors. The ratings from Experiments 1 and 3 were treated as point estimates with measurement errors, calculated as the median and standard deviation, respectively, of their posterior distributions for each vocalisation.