
ABSTRACT
Across various contexts, older adults demonstrate a positivity effect – an age-related increase in a relative bias toward positive emotional stimuli as compared to negative stimuli. Previous research has demonstrated how this effect can influence decision making processes, specifically information search and choice satisfaction. However, the potential impact of the positivity effect and resulting age differences in information acquisition on decision quality has not been conclusively determined. We conducted an online decision making study comprising choices among charitable organisations with 152 younger and 152 older adults to investigate this relationship. We did not observe the positivity effect defined as higher positivity bias in older compared to younger adults. On the contrary, younger adults showed a slightly higher positivity bias. We also did not observe a link between a bias in information search toward positive or negative stimuli and decision quality. The results replicate the link between positivity bias and decision satisfaction. Older and younger adults did not differ in their decision quality. Finally, the findings did not support a potential influence of loss prevention orientation. Further research is required to address the factors that could influence the positivity effect in decision making.
Past research has described an interplay between affect, cognition, and decision making (Dolan, Citation2002; Schwarz, Citation2000). An important perspective on the role that emotions play in cognition and decision making is how these relationships transform with age (Mikels et al., Citation2015). Research has shown age-related changes in how emotions influence attention, memory, and aspects of decision making (Reed & Carstensen, Citation2015). Despite advances in studies on age differences in cognitive and emotional processes, more research on potential real-life implications is needed (Scheibe, Citation2018). Paradoxically, studies on ageing demonstrate that despite a potential decrease in quality of life (Kahana et al., Citation2012) and declines in health (Tovel & Carmel, Citation2014) and cognitive abilities (Zaval et al., Citation2015), older adults often maintain relatively high emotional well-being (Charles & Carstensen, Citation2010). These observations are consistent with the socioemotional selectivity theory (SST) – a life-span motivation theory describing changes in priorities that occur with age (Carstensen, Citation2006). The SST posits that, unlike younger adults, older adults perceive time horizons, or the time remaining in life, as limited. This leads to prioritising goals related to emotional well-being.
The positivity effect
One of the implications of the SST that has received much attention in literature is that older adults show a relatively stronger affinity toward positive emotional stimuli than toward negative ones. Studies have shown that older adults preferentially attend to or memorise information with a positive valence over a negative one compared to younger adults (Reed et al., Citation2014). This age by valence interaction is referred to as a positivity effect (PE). The current study aimed to investigate whether the PE and the resulting bias in information search can adversely influence the decision making quality of older adults.
Loss prevention orientation
A different perspective on age-related changes in motivation is the “selection, optimisation, compensation” (SOC) framework (Baltes et al., Citation1999; Ebner et al., Citation2006). The SOC posits that older adults are confronted with limitations in available resources, and thus adaptively focus on goals related to maintaining their current resources and preventing losses (Ebner et al., Citation2006). Elaborating on loss prevention orientation, Depping and Freund (Citation2011, Citation2013) suggested that in a decision situation, older adults would preferentially attend to and memorise information related to potential losses. In the current study, we derived hypotheses primarily from PE and SST research; however, we also aimed to assess whether loss prevention orientation potentially contributed to the information search and choice behaviour in our decision task.
The PE and decision making
Several studies have shown that the age-related PE also extends to aspects of decision making, such as information search (English & Carstensen, Citation2015; Löckenhoff & Carstensen, Citation2007, Citation2008) and decision satisfaction (Bjälkebring et al., Citation2016; English & Carstensen, Citation2015; Kim et al., Citation2008). Some authors have suggested that decision quality can be negatively affected by the PE – decision situations can require individuals to consider the attributes of choice alternatives that are associated with negative emotional stimuli (Carstensen & DeLiema, Citation2018; Reed & Carstensen, Citation2015). Despite the great interest in the PE in literature and the evidence of the PE in information search, research examining the potential influence of the age-related positivity bias during information search on the quality of resulting decisions is limited. The potential existence of such a link is of considerable interest in the contexts of older adults’ decision making and the SST. Our main research question was whether the PE and the resulting bias are related to the quality of value-based decisions. We aimed to answer this question by conducting a study with a group of younger adults and a group of older adults, using a task in which participants made donation decisions among sets of charitable organisations. Bjälkebring et al. (Citation2016) showed that decisions about charitable donations might be susceptible to the PE, which made donation decisions suitable for the current study.
The framework of value-based decision making (Rangel et al., Citation2008) considers several computations involved in the choice: the representation of the decision problem, the valuation of available actions, the comparison of their values; evaluation of the outcome, the learning process, and the updating of other processes. Previous research has shown the PE in information search (Löckenhoff & Carstensen, Citation2007) and decision satisfaction (Kim et al., Citation2008). Therefore, the PE could potentially influence the valuation of available actions and the evaluation of the outcome. Decision makers with a positivity bias or negativity bias would fail to conduct a balanced information search and would not make the necessary trade-offs between the positive and negative characteristics of alternatives. Based on the previous studies that used comparable tasks (Löckenhoff & Carstensen, Citation2007, Citation2008), we expected younger adults to review similar amounts of positive and negative information, whereas we expected older adults to show positivity.
The methodological approach of the current study
One approach to measuring information search is Mouselab, a computer-based process-tracing tool that presents decision-relevant information in a matrix of cells. It also records the contents, amount, and sequence of information searched for prior to making a decision (Willemsen et al., Citation2011). In the study by Queen et al. (Citation2012), younger and older adults completed a Mouselab task with hypothetical choices among cars. Participants clicked the cells in the matrix to see the scores presented as pluses or minuses. The results indicated similarities in the decision making of younger and older adults, including a similar extent of information search. Studies on the PE and information search used a decision grid task similar to Mouselab to demonstrate the age-related difference in positivity (English & Carstensen, Citation2015; Löckenhoff & Carstensen, Citation2007, Citation2008). One distinct property of the tasks used in these studies was that cells containing information were labelled to indicate whether they contained positive or negative values.
We used a similar task to present decision scenarios with choices between charitable organisations. Our version of the decision grid task was different in several aspects from the tasks used in the previous literature (e.g. Löckenhoff & Carstensen, Citation2007). Our task did not include characteristics that have the same ratings for each option since these characteristics would not be relevant to measures of bias or expected value. These characteristics were previously referred to as neutral (English & Carstensen, Citation2015; Löckenhoff & Carstensen, Citation2007, Citation2008) and were intended to increase the subjective difficulty of the choice. At the end of the task, we randomly selected five trials for each participant and presented five charities chosen in these trials. Each participant made a final selection of a preferred organisation, and we implemented this decision by transferring a donation to the charitable organisation. Participants were informed beforehand about the consequences of their choices. Thus, by using an incentivised donation decision, we additionally deviated from the previously used hypothetical healthcare choices or consumer choices (English & Carstensen, Citation2015; Löckenhoff & Carstensen, Citation2007). Resources available to prospective donors sometimes provide systematic evaluations of charities’ characteristics. For example, a non-profit consulting firm Phineo AG assessed aspects of transparency of select German charities (Buttkus & Schäffler, Citation2014; von der Ahe & Lüdecke, Citation2016). Our task, thus, represented a plausible situation in which a person considered donating to one of several charities, and the choice involved trading off some characteristics of alternatives for others.
In the current study, the decision quality measure was conceptualised similarly to previous research on decision quality in older adults (Queen et al., Citation2012; Queen & Hess, Citation2010). Specifically, for each option, we calculated the expected value based on the values of all of the characteristics, weighted by the importance ratings of each characteristic that the participants provided. We used this approach to assess how well participants selected charities that best met their own priorities.
Some of the limitations of Mouselab research also applied to the current study: the Mouselab procedure favours a serial review of information, requires holding information about options in memory, and prevents quick comparisons among multiple items (Glöckner & Betsch, Citation2008). We considered that the relatively low number of information cells in our task would minimise the potential effect of memory limitations in older participants. For example, the previously mentioned study by Queen et al. (Citation2012) demonstrated the comparable information search and decision quality of older adults and younger adults in a Mouselab task under two conditions – with a simple matrix with five options and five characteristics (5 × 5 grid) and a complex matrix with eight options and six characteristics (8 × 6 grid). With the caveat that in our task values had more possible increments, our matrix had fewer pieces of information – four options and four characteristics (4 × 4 grid).
The current study considered two possible mechanisms through which the PE could influence the information search of older adults in the decision grid task. One mechanism was the avoidance of negative stimuli values due to the valences of cues. A stronger positivity bias could lead older adults to ignore the negative but value-relevant information more frequently. Thus, older adults would not be able to take this information into consideration when making decisions. Another mechanism was an overweighting of the positive values of options due to more attention being paid to them. Research has demonstrated the role of attention in stimulus value computation during a choice (Fehr & Rangel, Citation2011; Hare et al., Citation2011). We considered that both of these potential consequences of an increased positivity bias could decrease decision quality. We assessed the potential influence of the PE on decision quality through both of these mechanisms. We also tested whether ignoring characteristics with a specific valence more often was on its own predictive of decision quality.
The potential contribution of loss prevention orientation
We also considered the possibility that loss prevention orientation could contribute to age differences in information search. Depping and Freund (Citation2011, Citation2013) indicated that older adults may have an increased sensitivity toward negative information during decisions. However, it is not entirely clear how an increased sensitivity to negative information would interact with the design of the decision grid task. If older adults demonstrate a high sensitivity to potential losses, it could influence their assumptions about the content of negative cells. Specifically, high sensitivity to negative information could lead older adults to perceive information cells labelled with negative cues as highly negative. If participants expect all negative cues to be associated with strong losses, it could decrease the perceived informativeness of the negative cells, thus decreasing the incentive to review them. This effect could potentially contribute to older adults less frequently reviewing the negative cells. To assess the evidence for this potential alternative explanation, we administered a simplified version of the decision grid task. This task presented the values of information cells openly. Each trial included two options, with four characteristics each. Assuming the contribution of loss prevention orientation, we expected that in the simplified decision task, increased sensitivity to negative values would most strongly influence the perception of comparisons between positive and negative values because these comparisons would provide the strongest contrasts among the options. We used an approach similar to the analysis that Hare et al. (Citation2011) performed. In their study, participants used a four-point scale to indicate how much they wanted food products that were presented in three attention conditions. Participants also rated the healthiness and taste of the products. A regression analysis using choices as a dependent variable and ratings with conditions as independent variables demonstrated participants’ increased responsiveness to the healthiness of food products in the health attention condition. We intended to use a similar approach to compare how older and younger adults respond to characteristics that compare positive and negative valences. The analysis indicated whether loss prevention orientation influenced performance in the decision grid task.
Hypotheses
Based on the SST and the existing empirical evidence, we formulated several hypotheses. First, we predicted that we would observe the PE, specifically that older adults would show a stronger positivity bias in review of option attributes than younger adults (H1), which is similar to findings in healthcare and consumer choices. We refer to the measure of the positivity bias as the positivity index. It indicated a participant’s relative preference for positive information cells as compared to negative information cells. The positivity index was calculated as the difference between the numbers of the reviewed positive cells and the reviewed negative cells divided by the sum of all cells reviewed.
Next, we hypothesised that a stronger bias towards either positive or negative information in the review of the choice options’ characteristics would result in lower decision quality (H2a). Specifically, we considered that this relationship could reflect two potential mechanisms – complete avoidance of the stimuli of one valence and relatively more attention being paid to one valence. We refer to this measure as the bias index, and it was calculated as the absolute difference between the number of reviewed positive information cells and negative information cells divided by the sum of all reviewed information cells. Higher values on this measure thus reflected both higher positivity and higher negativity biases. We used the bias index measure instead of the positivity index for this analysis because it better represented the hypothesised mechanism linking information search and decision making quality. In our task, negative and positive information had identical diagnostic values. Accordingly, a high decision quality would require a consistent review of negative and positive information. The bias index represented the degree of deviation from consistent review. In previous decision grid task studies, younger adults showed close to an even-handed review of positive and negative information (Löckenhoff & Carstensen, Citation2007, Citation2008), whereas older adults showed a preference for positive information. Based on these findings, we expected the bias index measure to be similar to the positivity index.
We also conducted analyses with an alternative measure of bias towards either a positive or negative valence, which were based solely on the numbers of unique cells opened. We refer to this as the ignorance-based bias index. Unlike the bias index, this measure reflected only the extent to which either negative information or positive information was ignored relatively more often. Thus, a higher measure of the ignorance-based bias index indicated that a participant tended to avoid completely some of the information about choice options due to its valence. We hypothesised that a higher ignorance-based bias index would be linked to a lower decision quality (H2b). The analysis indicated whether this component of the PE could, on its own, account for the differences in decision quality.
We also hypothesised that a higher measure of the positivity index would be associated with higher decision satisfaction, as measured by choice satisfaction ratings (H3). We expected that the bias towards positive valence would specifically predict more positive evaluations of choice outcomes, which is consistent with previous findings (e.g. English & Carstensen, Citation2015).
Next, we predicted that the decision quality would be lower in the older adults group than in the younger adults group (H4). Since we expected age differences in positivity, as well as a relationship between the bias index and decision quality, we also expected group differences in choice quality.
To rule out an alternative explanation for the PE – the loss prevention account – we additionally used choice data from the simplified decision task to test age differences in how participants compared information with different valences. If older adults focused on loss prevention, we expected them to base their decisions most strongly on characteristics where one option had a negative value and another option had a positive value because these characteristics potentially offered the strongest contrasts between the options. We expected older adults to take these characteristics with mixed valences into account during decisions – more so than younger adults would (H5).
Method
Participants
A priori power analysis is described in the Supplementary Material. The younger adults group included participants of between 18 and 30 years old, whereas the older adults group included participants between 65 and 80 years. We aimed to recruit a similar number of men and women in both age groups. Before participants started to work on the experimental task, they were asked whether they had any current or previous neurological or psychiatric disorders, such as dementia, or depression, or other major illnesses. They also completed the Informant Questionnaire on Cognitive Decline in the Elderly (IQCODE). We expected the study to take roughly between 30 and 45 min in total. Participants were recruited with the help of the online panel and survey technology provider Toluna, which finds respondents either by using maintained panels, or through other websites by using the “Real-Time Sampling®” method. Toluna maintains panels in various countries and has offices worldwide. We recruited German participants and, correspondingly, all instructions and materials were presented in German. A set of various checks that ensure data quality verifies that participants responding to the surveys are real, valid, and not duplicated. Checks against careless responses were included in the decision task itself, such as exclusion based on insufficient information review, trial durations that were too short or long, an attention check in the rating task, and catch trials in the simplified decision task and decision grid task.
Material
Informant Questionnaire on Cognitive Decline in the Elderly (IQCODE)
To rule out cognitive decline, we used a short seven-item version of the IQCODE (Ehrensperger & Monsch, Citation2016; Ehrensperger et al., Citation2010) and administered it as a self-report questionnaire. Participants used a scale from 1 (strong improvement) to 5 (strong decline) to describe changes in several aspects of their cognitive functioning across two years. The score was calculated as an average response across all items. The cut-off was based on a previously proposed threshold of 3.43 for detecting dementia using the informant-based seven-item IQCODE (Ehrensperger et al., Citation2010). The self-reported 16-item IQCODE has proven suitable for detecting dementia with similar thresholds of 3.6 (Jansen et al., Citation2008) and 3.38 (Eramudugolla et al., Citation2012).
Subjective Numeracy Scale (SNS)
To control for potential differences in numeracy, we administered the SNS (Fagerlin et al., Citation2007). The German version includes seven items (excluding an item from an English version that is related to calculating 15% tips since it is not relevant in the German context) that measure subjective numeracy skills and attitudes towards information presented in numeric form on a scale from 1 to 5 (Garcia-Retamero & Galesic, Citation2013). The SNS measure was calculated as an average response.
Behavioural task
The online behavioural task was developed with the help of the jsPsych library (de Leeuw, Citation2015) and was administered via a web browser. It consisted of five parts. First, users read a description of the procedure, provided their informed consent, and completed the questionnaires. Next, all four characteristics of the charitable organisations from the rating and choice parts of the task were presented with brief descriptions, so that participants had a chance to familiarise themselves with the whole set of option characteristics. Participants then rated the personal importance of four characteristics using a nine-point scale in randomised order (see A). To prevent inadvertently repeated clicking on buttons that could lead to skipping trials, inter-stimulus intervals were set to 500 ms. After the rating task, participants completed the simplified decision task with eight regular trials and two catch trials. Then, they completed the decision grid task with 10 regular trials and two catch trials. In both decision tasks, participants were offered a chance to review the values describing the characteristics of a set of charities. The description of each charity comprised two negative and two positive characteristics (except for charities presented in the catch trials). After a review of the information, participants chose a preferred alternative by clicking a button with its name. Before the beginning of both decision tasks participants were required to complete practice trials.
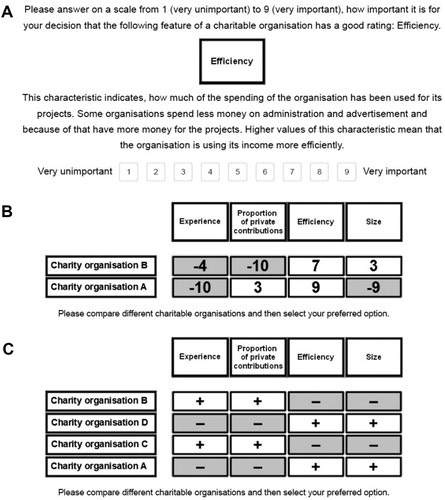
Figure 1. Panel A depicts the rating task in which participants rate four characteristics on a scale from one to nine. Panel B demonstrates the simplified decision task. Choice options had one characteristic with positive values, one characteristic with negative values, and two characteristics with mixed positive and negative values. Participants were asked to compare the options and select a preferred one. Panel C demonstrates the decision grid task. Participants saw the cues indicating whether the contents were negative or positive and had to click on the cells to review the values.
Participants were informed that five of their decisions would be randomly chosen and presented together at the end of the task, including decisions made in the simplified decision task, decision grid task, and catch trials but not including the practice trials. The charitable organisations corresponding to those choices were revealed and presented along with short lists describing their areas of work. Thus, participants made their final selection knowing the names and priorities of the specific charities to which they would be donating. Each of the participants’ decisions could have been picked for this final selection list; therefore, each decision was equally important.
Values for the characteristics of the charities were constructed based on publicly available information. The “experience” characteristic was based on the age of the organisation; the “efficiency” characteristic was based on the proportion of spending not used for administrative, PR, and fundraising purposes; and the “size” characteristic was based on the number of employees working for the organisation. Previously, these characteristics were predictive of donations to charitable organisations (for a review, see Trussel & Parsons, Citation2007). The “proportion of private contributions” characteristic reflected the share of contributions, such as donations, membership fees, and others, in the total income. Evidence from some experimental studies points to a negative relationship between government support and contributions that participants made to charities (for a review, see de Wit & Bekkers, Citation2017); thus, a higher proportion of private income is likely to be perceived as a positive characteristic. The scores for various characteristics were constructed as relative percentile scores in the larger pool of 203 charitable organisations and then transformed into scores of between −1 and −10 or between 1 and 10 for the negative and positive values, respectively. Then, 68 of the charities were selected from the larger pool to be used in the simplified decision task and decision grid task trials.
The positive and negative scores of the charitable organisations were described in the instructions as values above and below the typical values for characteristics, respectively. Participants were also informed about the minimal and maximal possible values of the scores (−1 and −10 for negative cells, 1 and 10 for positive cells). We interpreted the positive and negative values of the choice options’ characteristics as corresponding to positive or negative emotional valences since they required participants to consider potential gains or losses (Löckenhoff & Carstensen, Citation2007). Each trial included either two (in the simplified decision task) or four (in the decision grid task) choice alternatives presented in rows. We used anonymized charity names (e.g. “Charitable organisation A” or “Charitable organisation B”) in order to eliminate the influence of potential brand preferences. The letters A, B, C, and D were assigned to options randomly. We informed the participants that they could determine what information to review to avoid any demand effects. The positions of the options in both decision tasks were randomised in each trial, while the positions of the characteristics were randomised between subjects to avoid confusing the participants between trials.
Simplified decision task
Each simplified decision task trial presented two options with four characteristics. One characteristic in each trial had two positive values, and another characteristic had two negative values. These characteristics were referred to as characteristics with fixed valences. The third characteristic had a positive value for the first option and a negative value for the second option, whereas the fourth characteristic had a negative value for the first option and a positive value for the second option (see B). Thus, in each trial, a participant needed to consider trade-offs with regard to characteristics with positive or negative valences and two characteristics with mixed valences. Participants completed two practice trials before starting the simplified decision task. The pairs of options had the following properties (excluding the catch trial and practice trials): (1) simple tallies of the characteristics’ values for each option were never equal in a trial, and the differences between the pairs of tallies throughout the trials ranged between two and nine; (2) considering only the characteristics with mixed valences and ignoring the characteristics with fixed valences would change the simple tallies of scores for options, so that a different option would be preferable. Thus, participants who focused primarily on characteristics with mixed valences would typically prefer different options, compared to participants who considered all characteristics. Throughout the trials, each characteristic had, at least once, a negative, positive, or mixed valence. One catch trial for the simplified decision task included one obviously preferable option with three positive values and one negative one; additionally, all values for this option were higher, than for the alternative. The second catch trial for the simplified decision task included one obviously inferior option with four negative values, which were also all lower, than for the alternative.
Decision grid task
Before starting the decision grid task, participants completed four practice trials to become accustomed to the procedure. In the first two practice trials, there were two options with two characteristics, and participants were required to click on each of the four information cells before proceeding. In the third and fourth practice trials, there were four options with four characteristics each, as in the regular trials, and participants were instructed that they could decide which cells to click. The characteristics of the choice options were demonstrated similarly to Löckenhoff and Carstensen’s (Citation2007) decision grid task. Information related to specific attributes was concealed in cells that were labelled as negative or positive by pluses on a white background, or minuses on a light grey background, respectively (see C). Participants opened the cells one by one by clicking to review the information they contained. Clicking on a new cell automatically closed the previous one. Simple tallies of the numerical values of the characteristics presented in the decision grid task for each choice option were unique and ranged between −8 and 11 throughout the regular trials (excluding the catch trial and practice trials). After each trial, participants rated their satisfaction with their decision on a scale from one to nine. One catch trial for the decision grid task included one option with four positive values and thus, if participants paid attention to the task, represented an obviously preferable alternative even without opening the cells. Another catch trial for the decision grid task included one inferior choice alternative with four negative values, which should not have been selected if the participant had been paying attention to the task.
Planned analysis
Data exclusion
Participants were excluded if they reported neurological or psychiatric disorders such as dementia, or depression, or other major illnesses, or if they reported cognitive decline exceeding the threshold on the IQCODE. To decrease the potential noisiness of the measure of positivity in the review that could occur if only one cell, positive or negative, was reviewed in a trial, we excluded – in all trial-level analysis – any trials in which a participant opened less than two cells. We excluded all trials with decision times quicker than 300 ms, because quick reaction times could indicate careless responders (Curran, Citation2016). Trials with durations longer than five minutes were also excluded since they could have indicated being distracted from the task. Additionally, participants with fewer than two trials in the main behavioural task that meet the inclusion criteria, were also excluded from the analyses of the decision grid task data, since the lack of eligible data would also have indicated inattentiveness. Finally, participants were excluded if they failed to provide a correct answer on the attention check trial during the rating task, or if they failed the catch trials by selecting an obviously inferior option.
Data transformation
All variables that were included in the regression analysis as interactions were mean centred.
Measures
A list of measures and indices that we used for the analyses of the decision grid task data is available in Table S1, and a list of measures and indices that we used for the analyses of the simplified decision task data is available in Table S2. Apart from the measures derived from the behavioural data and required for the planned analyses, we also planned to collect data on participants’ age, gender, and years of education to characterise our sample and assess the generalisability of the findings.
Index of positivity in review
Following Löckenhoff and Carstensen (Citation2007), we calculated the positivity index as the difference between the counts of reviewed positive and negative cells divided by the sum of all positive and negative cells reviewed, and it varied between −1 and 1. Positive values indicated that the positive cells are reviewed more often, whereas negative values indicate a more frequent review of negative cells. Repeated reviews of the cells were counted to calculate the positivity index in review in the same way as the first initial reviews of the cells. We also calculated the bias index by taking the absolute values of the positivity index. The bias index varied between 0 and 1, and higher values indicated a more frequent review of cells of either valence - positive or negative. The bias index also reflected an aspect of information search. Higher values of this index represented a stronger bias towards information with a positive or negative valence. We additionally used an ignorance-based bias index that was restricted to only unique reviews of the cells, which is similar to what was done in the study by Löckenhoff and Carstensen (Citation2008). This measure reflected whether more of the positive or negative information was completely ignored (in comparison to just receiving relatively less attention). It was calculated as an absolute value of the difference between the numbers of unique reviewed positive cells and unique reviewed negative cells divided by the number of all unique cells reviewed.
Decision quality
Decision quality was based on the expected values for each choice option calculated from the individual ratings of the importance of the charity’s characteristics and the values presented in the corresponding information cells. Specifically, for each option the expected value was calculated as a sum of cell values weighted by the importance ratings of the characteristic (cell value × the importance rating of the characteristic). These weighted values were divided by the expected value of the best option in the trial to calculate the expected value ratio (EVR) scores, which is similar to the analysis that Queen et al. (Citation2012) described, but taking into account all available information cells in the trial, including those that the participant did not open. Picking the best option thus resulted in a score of one. Selecting the option with the highest value was considered desirable, since it maximised the potential impact of a donation. Thus, by design, optimal choices were most likely made when all of the information was considered, and when the negative and positive properties of the options were weighted similarly. We also used the obtained ratings of choice satisfaction after each trial on a scale from one to nine to test the relationship between the PE and choice satisfaction.
Results
In the following section we first describe the results of the confirmatory analysis. We then describe the data in more detail and report on the exploratory analyses to provide additional context for the confirmatory tests. We collected data from 152 younger adults and 152 older adults that met the inclusion criteria.Footnote1 At the end of the task we presented each participant with the charities they had chosen in five randomly selected trials. Each participant made a final selection of a preferred organisation. We implemented these decisions by transferring donations to the value of one Euro per participant to the charitable organisations. For 11 of the participants included in the analysis, data on the final selection of the charity out of five presented options was not saved, likely due to a technical issue. For two of the participants in the younger adults group, the decision satisfaction ratings after the last decision making trial were also not saved. We included available data from these participants in the analysis, apart from the two missing decision satisfaction ratings. The characteristics of the younger and older adults are presented in (please find additional correlations among the participants’ characteristics and dependent and control measures in Table S3).
Table 1. Characteristics of younger and older adults.
Task materials, raw data and the analysis script are available on the Open Science Framework (https://osf.io/xne5s/), in addition to the Stage 1 registered report (https://osf.io/r6jfh/).
Confirmatory analyses
We analysed the collected data in accordance with the registered analysis plan. The results from the regression models are presented in . To obtain standardised coefficients, we centred variables and rescaled them by dividing them by standard deviation, with the exception of the binary variables that indicated age group and choice. We first tested whether our sample demonstrated the PE (H1), defined as a higher positivity bias in the group of older adults, in comparison to the group of younger adults. We did not observe a significant difference in the positivity index between the age groups.
Table 2. Mixed-effects regression models predicting the positivity index in review and decision quality.
Table 3. Mixed-effects regression models predicting decision satisfaction and decision quality.
Table 4. Mixed-effects logistic regression model predicting choices in the simplified decision task from differences among the scores of features with positive, negative, and mixed values that interacted with the age group.
We then tested whether the bias index was linked to a decreased quality of decisions measured by the EVRFootnote2 (H2). The bias index was calculated as an absolute value of the positivity index and represented a degree of deviation from an equal review of positive and negative information. Both age groups showed a similar extent of the information acquisition bias. We also did not observe a significant effect of the bias index on the EVR (H2). Additionally, we tested whether the ignorance-based bias index was linked to a decreased quality of decisions measured by the EVR (H2b). Similar to the H2, we did not observe a bias effect in the review of unique cells on the EVR.
We then tested the link between the positivity index and decision satisfaction (H3). Positivity was significantly related to ratings of decision satisfaction, confirming the hypothesised effect. Next, we compared decision quality, measured with the EVR between the two age groups (H4). The regression coefficient suggested that older adults had a lower decision quality; however, the effect was not significant. We used a mixed-effects logistic regression model to analyse the choices in the simplified decision task (H5). Interactions of interest between the age group variable and the values of characteristics with mixed valences were not significantly related to the choices (), suggesting a lack of support for loss prevention orientation in older adults’ decisions in the presented task.
Exploratory analyses
We calculated effect sizes for the tests with averaged measures for each participant across the trials. In a comparison of the averaged positivity index between older and younger adults, Cohen’s d was negligible with d = -.134, confidence interval (CI) 95% = [-.36, .092], and p = .245. The correlation between the averaged bias index and decision quality was small with r = .072, CI 95% = [-.041, .183], and p = .212. Between the averaged bias index based on unique review and decision quality, we also observed a small correlation coefficient with r = .043, CI 95% = [-.07, .155], and p = .454. The correlation between the averaged positivity index and decision satisfaction, was also small with r = .068, CI 95% = [-.045, .179], and p = .236. The comparison between the averaged decision quality of older and younger adults, showed a small Cohen’s d of d = -.213, CI 95% = [-.439, .014], and p = .065.
We explored the information search and decision quality measures to provide additional context for the confirmatory testing results. First, we addressed potential differences in the search pattern variability, operationalised as the standard deviation of the positivity index, throughout the task. We did not observe a difference between the age groups in positivity index variability (Table S4); therefore, it is unlikely that our measures were confounded by age differences in the stability of information search patterns. We also evaluated whether older adults conducted a less extensive information search; however, we did not observe a significant difference between the age groups (Table S5).
We assessed whether older and younger adults showed a positivity or negativity bias in review. For each age group, we used one-sample two-sided t-tests with the positivity index. Younger adults had an average positivity index of .246 (p < .001), which indicates that on average the difference between the numbers of reviewed positive and negative information cells constituted 24.6% of all reviewed cells in a trial. Interestingly, older adults had a slightly lower average positivity index of .205 (p < .001). These results suggest that both groups showed a positivity bias. We tested whether it was possible to reject a specific effect size for an age group comparison of the positivity index. We used the two one-sided tests (TOST) procedure (Lakens, Citation2017) implemented in R for equivalence testing using the positivity index averaged across trials for each participant. The planned sample size of 150 participants per group allowed us to reject an effect size of approximately d = .34 with a power of .8 for a t-test comparing measures on the level of participants, which is lower than previously reported (d = .482). Therefore, we used the TOST procedure with equivalence bounds of d = .34. In the current results, younger adults had a numerically higher average positivity index than older adults. Correspondingly, the result of the TOST procedure indicated that we could reject the upper equivalence bound (younger adults have a higher positivity index) with p = .037, and we could reject the lower equivalence bound (older adults have a higher positivity index) with p < .001.
To rule out the potential effect of a relatively quicker completion of the task on decision quality, we used exploratory regression models similar to the analyses testing H2, H2b and H4 in a subset of participants who took longer than at least half of the mean duration for the respective age group to complete the study (including 125 younger adults with a completion time longer than approximately 10 min and 123 older adults with a completion time longer than approximately 13 min; see Table S6). The pattern of results was generally similar to the findings from the confirmatory tests; therefore, it is unlikely that the decision quality analysis was adversely affected by those participants who completed the task quickly.
Discussion
In the current study, we investigated the relationship between the age-related PE and decision making in a sample of older and younger adults. Previous literature has demonstrated a stronger positivity bias in older adults’ information search, in comparison to younger adults, in various contexts, including in decision tasks (Carstensen & DeLiema, Citation2018). We did not observe such a PE in the information search in our donation task. Equivalence testing for a comparison of the positivity index between younger and older adults supported the rejection of an effect size of at least d = .34, which is lower than the previously reported d = .482 (Reed et al., Citation2014). This test rejected potential positivity as well as negativity bias.
Some previous studies have also presented a lack support for the PE (for example, Grühn et al., Citation2005; Fernandes et al., Citation2008). The meta-analysis by Reed et al. (Citation2014) suggested that the PE can be suppressed by instructions that constrain information processing and, consequently, decrease positivity bias in older adults. For example, older adults showed a decreased positivity bias in information search when they were directed to focus on specific facts and details in the study by Löckenhoff and Carstensen (Citation2007). However, we observed a positivity bias in both age groups, and it is, therefore, unlikely that our task inadvertently suppressed the PE similarly to the study mentioned.
Furthermore, younger adults showed a numerically higher positivity bias than older adults. The current findings differ from previous studies that used a similar decision grid task and demonstrated a neutral or negatively biased information search in younger adults (Löckenhoff & Carstensen, Citation2007, Citation2008). A negativity bias in younger adults would also be expected in the context of extensive research, demonstrating higher importance for negative than positive information in decision making and memory (Baumeister et al., Citation2001; Kahneman & Tversky, Citation1982; Rozin & Royzman, Citation2001). Therefore, in the context of previous research, the higher positivity bias in younger adults was a notable finding.
Barber et al. (Citation2016) showed that the positivity bias can be increased in younger adults who are thinking about a limited future. Similarly, one possible explanation for the observed positivity in younger adults is that the charity decision task promoted a positivity-focused information search in younger adults. In the study by Bjälkebring et al. (Citation2016), younger adults were more motivated by negative affect in charitable giving than older adults. In comparison, the current study did not use emotional stimuli that could have induced negative emotions (e.g. pictures depicting children in need).
Consistently with the literature, a stronger positivity bias during decision making was associated with higher decision satisfaction. This result indicates that focusing more on positive information is linked to a higher subjective assessment of a resulting choice. However, we did not observe the hypothesised links between the bias index or the ignorance-based bias index and decision quality. The observed heterogeneity between the participants in the EVR ruled out potential floor or ceiling effects for decision quality. One potential explanation for the lack of a relationship between the bias and EVR is that the present heterogeneity of the positivity index and, consequently, the bias index, was insufficient to cause detectable differences in decision outcomes among participants. Correspondingly, we did not establish a significant difference in decision quality between the age groups in the confirmatory analysis, although older adults had a numerically lower average decision quality. Another possibility is that a potential improvement in the decision quality of participants was limited by a factor other than an unbiased information search, for example, limitations in both younger and older adults’ processing of information. Overall, these findings indicate the need for research that more closely examines age differences in attention to positive and negative stimuli during information search, as well as their influence on decision making.
We also considered the possibility that younger and older adults may show varying susceptibility to fatigue, which could have affected their performance in the task to varying degrees. Both age groups showed some decrease in the quantity of information searched for and an increase in positivity bias throughout the task. However, we observed no differences in these changes between the age groups. The exploratory test also confirmed that older and younger adults showed a similar extent of information search and repeat reviews of information. We also observed no difference in the variability of positivity bias, which indicates the similar stability of information search patterns for younger and older adults in the task.
We assessed the evidence for loss prevention orientation as one alternative explanation. The motivation to avoid losses could increase the review of negative information cells, which was not evident in our results, though. However, there remained the possibility that older adults avoided opening negative cells in the decision grid task if they were averse to negative information and considered all possible losses more impactful than gains. Such an effect would be hard to detect in the decision grid task alone. Therefore, we assessed it using a task with cell values presented openly. The SST would predict that a stronger attention would be paid to positive stimuli in both tasks, thereby decreasing the importance of characteristics that had negative values. In the simplified task with only two options, loss prevention orientation would predict that more attention would be paid to characteristics for which one option had a positive value and another option had a negative value because the contrast between options would be more relevant for these characteristics. We did not find support for an age-related difference in attention to characteristics when contrasting the positive and negative values. This finding suggests a lack of the predicted effect of loss prevention orientation during ageing. However, further research would be required to reconcile the potential contributions of loss avoidance and the PE in older adults.
The current study has several potential limitations. We conducted the study online, and this could have led to a selection effect, especially in the older participants. For reference, in the study by König et al. (Citation2018) which analysed data from 2015, 73% of European adults aged 50–54 used the internet within seven days of taking part in the survey, but only 48% of adults aged 65–69 and 36% aged 70–74 did so. The average SNS scores in our study were comparable to those reported in the study by Rolison et al. (Citation2013) for older and younger adults. We included participants based on their average IQCODE scores which resulted in a sample average that was similar to the one previously reported for healthy older adults (Ehrensperger et al., Citation2010). Another potential limitation of our study was that plus and minus signs or values were not very emotionally salient. The replicated link between positivity bias and decision satisfaction indicated that information review measures in our study were in general consistent with previous studies. Additionally, we incentivised decisions of participants to ensure that choices had real world consequences.
The current study investigated a potential contribution of the PE to value-based decision making. Contrary to previous literature, we did not observe the PE defined as an age-related increase in positivity bias. We also did not establish an effect of bias in the information search on decision quality. Correspondingly, confirmatory analyses did not provide support for systematically compromised decision quality of older adults due to the PE. The present findings suggest the comparability of the examined characteristics of the information search and decision making for younger and older adults. Further research would be required to investigate additional factors underlying age differences in positivity and the resulting decision outcomes. Our task was similar to a range of various decision situations that younger and older adults may be confronted with in real life, such as charitable donations or online shopping. Applied to consumer behaviour, our findings would suggest that when making a choice, older and younger adults could show a preference for information related to the advantages and positive characteristics of the options. Additionally, both age groups would be similarly likely to make beneficial decisions.
Supplementary_Material
Download MS Word (31.1 KB)Disclosure statement
No potential conflict of interest was reported by the authors.
Notes
1 In each age group, two extra participants completed the task due to a technical difficulty with stopping data collection. This is a minor deviation from the planned sample size, and we included these participants in the analysis.
2 Please note, that the calculation of the EVR included an adjustment of the expected values of options in each trial by detracting the minimal expected value in the respective trial to avoid cases in which the expected value would be divided by a negative value or by a zero.
References
- Baltes, P. B., Staudinger, U. M., & Lindenberger, U. (1999). Lifespan psychology: Theory and application to intellectual functioning. Annual Review of Psychology, 50(1), 471–507. https://doi.org/10.1146/annurev.psych.50.1.471
- Barber, S. J., Opitz, P. C., Martins, B., Sakaki, M., & Mather, M. (2016). Thinking about a limited future enhances the positivity of younger and older adults’ recall: Support for socioemotional selectivity theory. Memory & Cognition, 44(6), 869–882. https://doi.org/10.3758/s13421-016-0612-0
- Baumeister, R. F., Bratslavsky, E., Finkenauer, C., & Vohs, K. D. (2001). Bad is stronger than good. Review of General Psychology, 5(4), 323–370. https://doi.org/10.1037/1089-2680.5.4.323
- Bjälkebring, P., Västfjäll, D., Dickert, S., & Slovic, P. (2016). Greater emotional gain from giving in older adults: Age-related positivity bias in charitable giving. Frontiers in Psychology, 7(JUN), 1–8. https://doi.org/10.3389/fpsyg.2016.00846
- Buttkus, C., & Schäffler, S. (2014). Wirkungstransparenz bei Spendenorganisationen. https://www.phineo.org/downloads/PHINEO_Studie_Wirkungstransparenz_2014.pdf
- Carstensen, L. L. (2006). The influence of a sense of time on human development. Science, 312(5782), 1913–1915. https://doi.org/10.1126/science.1127488
- Carstensen, L. L., & DeLiema, M. (2018). The positivity effect: A negativity bias in youth fades with age. Current Opinion in Behavioral Sciences, 19, 7–12. https://doi.org/10.1016/j.cobeha.2017.07.009
- Charles, S. T., & Carstensen, L. L. (2010). Social and emotional aging. Annual Review of Psychology, 61(1), 383–409. https://doi.org/10.1146/annurev.psych.093008.100448
- Curran, P. G. (2016). Methods for the detection of carelessly invalid responses in survey data. Journal of Experimental Social Psychology, 66, 4–19. https://doi.org/10.1016/j.jesp.2015.07.006
- de Leeuw, J. R. (2015). jsPsych: A JavaScript library for creating behavioral experiments in a Web browser. Behavior Research Methods, 47(1), 1–12. https://doi.org/10.3758/s13428-014-0458-y
- Depping, M. K., & Freund, A. M. (2011). Normal aging and decision making: The role of motivation. Human Development, 54(6), 349–367. https://doi.org/10.1159/000334396
- Depping, M. K., & Freund, A. M. (2013). When choice matters: Task-dependent memory effects in older adulthood. Psychology and Aging, 28(4), 923–936. https://doi.org/10.1037/a0034520
- de Wit, A., & Bekkers, R. (2017). Government support and charitable donations: A meta-analysis of the crowding-out hypothesis. Journal of Public Administration Research and Theory, 27(2), 301–319. https://doi.org/10.1093/jopart/muw044
- Dolan, R. J. (2002). Emotion, cognition, and behavior. Science, 298(5596), 1191–1194. https://doi.org/10.1126/science.1076358
- Ebner, N. C., Freund, A. M., & Baltes, P. B. (2006). Developmental changes in personal goal orientation from young to late adulthood: From striving for gains to maintenance and prevention of losses. Psychology and Aging, 21(4), 664–678. https://doi.org/10.1037/0882-7974.21.4.664
- Ehrensperger, M. M., Berres, M., Taylor, K. I., & Monsch, A. U. (2010). Screening properties of the German IQCODE with a two-year time frame in MCI and early Alzheimer’s disease. International Psychogeriatrics, 22(1), 91–100. https://doi.org/10.1017/S1041610209990962
- Ehrensperger, M. M., & Monsch, A. U. (2016). P2-295: A validation study of the very short German 7-item IQCODE [Poster presentation]. Alzheimer’s & Dementia, 12(7), 745–P745. https://doi.org/10.1016/j.jalz.2016.06.1555
- English, T., & Carstensen, L. L. (2015). Does positivity operate when the stakes are high? Health status and decision making among older adults. Psychology and Aging, 30(2), 348–355. https://doi.org/10.1037/a0039121
- Eramudugolla, R., Cherbuin, N., Easteal, S., Jorm, A. F., & Anstey, K. J. (2012). Self-reported cognitive decline on the informant questionnaire on cognitive decline in the elderly is associated with dementia, instrumental activities of daily living and depression but not longitudinal cognitive change. Dementia and Geriatric Cognitive Disorders, 34(5–6), 282–291. https://doi.org/10.1159/000345439
- Fagerlin, A., Zikmund-Fisher, B. J., Ubel, P. A., Jankovic, A., Derry, H. A., & Smith, D. M. (2007). Measuring Numeracy without a math test: Development of the subjective numeracy scale. Medical Decision Making, 27(5), 672–680. https://doi.org/10.1177/0272989X07304449
- Fehr, E., & Rangel, A. (2011). Neuroeconomic foundations of economic choice—recent advances. Journal of Economic Perspectives, 25(4), 3–30. https://doi.org/10.1257/jep.25.4.3
- Fernandes, M., Ross, M., Wiegand, M., & Schryer, E. (2008). Are the memories of older adults positively biased? Psychology and Aging, 23(2), 297–306. https://doi.org/10.1037/0882-7974.23.2.297
- Garcia-Retamero, R., & Galesic, M. (2013). Transparent communication of health risks (R. Garcia-Retamero & M. Galesic, Eds.). Springer. https://doi.org/10.1007/978-1-4614-4358-2
- Glöckner, A., & Betsch, T. (2008). Multiple-reason decision making based on automatic processing. Journal of Experimental Psychology: Learning Memory and Cognition, 34(5), 1055–1075. https://doi.org/10.1037/0278-7393.34.5.1055
- Grühn, D., Smith, J., & Baltes, P. B. (2005). No aging bias favoring memory for positive material: Evidence from a heterogeneity-homogeneity list paradigm using emotionally toned words. Psychology and Aging, 20(4), 579–588. https://doi.org/10.1037/0882-7974.20.4.579
- Hare, T. A., Malmaud, J., & Rangel, A. (2011). Focusing attention on the health aspects of foods changes value signals in vmPFC and improves dietary choice. Journal of Neuroscience, 31(30), 11077–11087. https://doi.org/10.1523/JNEUROSCI.6383-10.2011
- Jansen, A. P. D., Van Hout, H. P. J., Nijpels, G., Van Marwijk, H. W. J., Gundy, C., De Vet, H. C. W., & Stalman, W. A. B. (2008). Self-reports on the IQCODE in older adults: A psychometric evaluation. Journal of Geriatric Psychiatry and Neurology, 21(2), 83–92. https://doi.org/10.1177/0891988707311558
- Kahana, E., Kelley-Moore, J., & Kahana, B. (2012). Proactive aging: A longitudinal study of stress, resources, agency, and well-being in late life. Aging & Mental Health, 16(4), 438–451. https://doi.org/10.1080/13607863.2011.644519
- Kahneman, D., & Tversky, A. (1982). The psychology of preferences. Scientific American, 246(1), 160–173. https://doi.org/10.1038/scientificamerican0182-160
- Kim, S., Healey, M. K., Goldstein, D., Hasher, L., & Wiprzycka, U. J. (2008). Age differences in choice satisfaction: A positivity effect in decision making. Psychology and Aging, 23(1), 33–38. https://doi.org/10.1037/0882-7974.23.1.33
- König, R., Seifert, A., & Doh, M. (2018). Internet use among older Europeans: An analysis based on SHARE data. Universal Access in the Information Society, 17(3), 621–633. https://doi.org/10.1007/s10209-018-0609-5
- Lakens, D. (2017). Equivalence tests. Social Psychological and Personality Science, 8(4), 355–362. https://doi.org/10.1177/1948550617697177
- Löckenhoff, C. E., & Carstensen, L. L. (2007). Aging, emotion, and health-related decision strategies: Motivational manipulations can reduce age differences. Psychology and Aging, 22(1), 134–146. https://doi.org/10.1037/0882-7974.22.1.134
- Löckenhoff, C. E., & Carstensen, L. L. (2008). Decision strategies in health care choices for self and others: Older but not younger adults make adjustments for the age of the decision target. The Journals of Gerontology. Series B, Psychological Sciences and Social Sciences, 63(2), P106–P109. https://doi.org/10.1093/geronb/63.2.P106
- Mikels, J. A., Shuster, M. M., & Thai, S. T. (2015). Aging, emotion, and decision making. In T. M. Hess, J. Strough, & C. E. Löckenhoff (Eds.), Aging and decision making: Empirical and applied perspectives (pp. 169–188). Elsevier Academic Press. https://doi.org/10.1016/B978-0-12-417148-0.00009-1
- Queen, T. L., & Hess, T. M. (2010). Age differences in the effects of conscious and unconscious thought in decision making. Psychology and Aging, 25(2), 251–261. https://doi.org/10.1037/a0018856
- Queen, T. L., Hess, T. M., Ennis, G. E., Dowd, K., & Grühn, D. (2012). Information search and decision making: Effects of age and complexity on strategy use. Psychology and Aging, 27(4), 817–824. https://doi.org/10.1037/a0028744
- Rangel, A., Camerer, C., & Montague, P. R. (2008). A framework for studying the neurobiology of value-based decision making. Nature Reviews Neuroscience, 9(7), 545–556. https://doi.org/10.1038/nrn2357
- Reed, A. E., & Carstensen, L. L. (2015). Age-related positivity effect and Its implications for social and health Gerontology. In N. A. Pachana (Ed.), Encyclopedia of geropsychology (pp. 1–9). Springer. https://doi.org/10.1007/978-981-287-080-3_50-1
- Reed, A. E., Chan, L., & Mikels, J. A. (2014). Meta-analysis of the age-related positivity effect: Age differences in preferences for positive over negative information. Psychology and Aging, 29(1), 1–15. https://doi.org/10.1037/a0035194
- Rolison, J. J., Wood, S., Hanoch, Y., & Liu, P.-J. (2013). Subjective numeracy scale as a tool for assessing statistical numeracy in older adult populations. Gerontology, 59(3), 283–288. https://doi.org/10.1159/000345797
- Rozin, P., & Royzman, E. B. (2001). Negativity bias, negativity dominance, and contagion. Personality and Social Psychology Review, 5(4), 296–320. https://doi.org/10.1207/S15327957PSPR0504_2
- Scheibe, S. (2018). Predicting real-world behaviour: Cognition-emotion links across adulthood and everyday functioning at work. Cognition and Emotion, 0(0), 1–7. https://doi.org/10.1080/02699931.2018.1500446
- Schwarz, N. (2000). Emotion, cognition, and decision making. Cognition and Emotion, 14(4), 433–440. https://doi.org/10.1080/026999300402745
- Tovel, H., & Carmel, S. (2014). Maintaining successful aging: The role of coping patterns and resources. Journal of Happiness Studies, 15(2), 255–270. https://doi.org/10.1007/s10902-013-9420-4
- Trussel, J. M., & Parsons, L. M. (2007). Financial reporting factors affecting donations to charitable organizations. Advances in Accounting, 23(07), 263–285. https://doi.org/10.1016/S0882-6110(07)23010-X
- von der Ahe, B., & Lüdecke, R. (2016). Wirkungstransparenz bei Spendenorganisationen. https://www.phineo.org/downloads/PHINEO_Studie_Wirkungstransparenz_2016.pdf
- Willemsen, M. C., Böckenholt, U., & Johnson, E. J. (2011). Choice by value encoding and value construction: Processes of loss aversion. Journal of Experimental Psychology: General, 140(3), 303–324. https://doi.org/10.1037/a0023493
- Zaval, L., Li, Y., Johnson, E. J., & Weber, E. U. (2015). Complementary contributions of fluid and crystallized intelligence to decision making across the life span. Aging and Decision Making, 149–168. https://doi.org/10.1016/B978-0-12-417148-0.00008-X