
ABSTRACT
Vocal bursts are non-linguistic affectively-laden sounds with a crucial function in human communication, yet their affective structure is still debated. Studies showed that ratings of valence and arousal follow a V-shaped relationship in several kinds of stimuli: high arousal ratings are more likely to go on a par with very negative or very positive valence. Across two studies, we asked participants to listen to 1,008 vocal bursts and judge both how they felt when listening to the sound (i.e. core affect condition), and how the speaker felt when producing it (i.e. perception of affective quality condition). We show that a V-shaped fit outperforms a linear model in explaining the valence-arousal relationship across conditions and studies, even after equating the number of exemplars across emotion categories. Also, although subjective experience can be significantly predicted using affective quality ratings, core affect scores are significantly lower in arousal, less extreme in valence, more variable between individuals, and less reproducible between studies. Nonetheless, stimuli rated with opposite valence between conditions range from 11% (study 1) to 17% (study 2). Lastly, we demonstrate that ambiguity in valence (i.e. high between-participants variability) explains violations of the V-shape and relates to higher arousal.
In recent decades, affective sciences have variously explored the underlying nature of affective states (see, for instance, Cowen et al., Citation2019; Kragel & LaBar, Citation2015; Zachar & Ellis, Citation2012). One of the most popular models is the “Affect Circumplex” proposed by Russell (Citation1980; Citation2003; Russell & Barrett, Citation1999). This model represents affect in terms of two dimensions: an arousal axis, ranging from deactivated to activated, and a bipolar hedonic valence axis, ranging from displeasure to pleasure.
Specific mixtures of arousal and valence are used to represent prototypical affective states, if any exist (but see Wilson-Mendenhall et al., Citation2011), or to describe specific instances of an emotion category. A prototypical affective state, such as fear, is thus characterised in this model as high arousal negative valence state.
Importantly, the circumplex model of affect assumes that valence and arousal are independent. This is because the existence of any linear or non-linear relationship would suggest that a more parsimonious model (in terms of the number of dimensions) is able to explain the emotional experience equally well.
Nonetheless, findings suggest that arousal and valence tend to form a V-shaped relation, both in terms of subjective experience and in affective evaluations of stimuli (Kuppens et al., Citation2013). This means that higher pleasure (or displeasure) is more likely to be experienced in combination with higher arousal. Despite being subject to cultural and intersubjective variability (Kuppens et al., Citation2017), this V-shaped relation is consistently reported across various studies and datasets. However, following a general trend in affective science, until recently, the majority of studies have focused on visual stimuli (Kurdi et al., Citation2017; Lang et al., Citation2008). It is thus important to determine whether the V-shaped relation represents an intrinsic feature of the arousal-valence model rather than a bias holding for affectively-laden visual stimuli specifically (Kuppens et al., Citation2013). More recent results across different sensory modalities show that the V-shaped relation holds strong also for natural and artificial sounds (Yang et al., Citation2018), synthetic nonverbal vocalizations (Anikin Citation2020), and odours (Toet et al., Citation2020).
Does the V-shaped relation between arousal and valence also hold for human vocal bursts? Most studies centred on affective reactions to vocal bursts do not directly address this question and rather focus on different topics, such as the universality of affect (Cordaro et al., Citation2016), its generalizability across species (Filippi et al., Citation2017; Fritz et al., Citation2018), or the relation between acoustic and affective properties (Belin et al., Citation2008; Laukka et al., Citation2005). However, some studies initially devised to address different research questions do report evidence of the V-shaped relation (see, for instance, Green & Cliff, Citation1975; Sauter et al., Citation2010a ; Cowen et al., Citation2019; Anikin Citation2020; Holz et al., Citation2021). This evidence calls for a more systematic investigation of the V-shaped relation in vocal bursts, which is the first aim of this study.
Moreover, we sought to test whether the same relation holds for semantic knowledge about affective stimulus properties and for the actual subjective feeling it brings about. Following Russell (Citation2003), we will call them Perception of Affective Quality (PAQ) and Core Affect (CA), respectively. For instance, two melancholic sighs, the first one produced by a stranger and the second one by someone we care about, are likely to elicit the same PAQ but different subjective reactions in terms of CA (Russell, Citation2017). Moderate evidence supporting a dissociation between PAQ and CA comes from a series of experiments by Itkes and colleagues (Citation2017, Citation2019), in which participants were instructed to provide either feeling-focused (i.e., CA) or knowledge-focused (i.e., PAQ) judgments about pictures and movie clips. A limitation of these investigations is that feeling-focused and knowledge-focused ratings were collected in separate groups of participants. Further studies are thus needed to test whether PAQ and CA ratings are uncoupled in response to vocal bursts and when the same individual is providing both judgments.
Lastly, a recent model supports an intriguing hypothesis concerning the occasional dissociation between valence and arousal and violations of the V-shaped relationship (Brainerd, Citation2018; Mattek et al., Citation2017). Mattek and colleagues suggest that, while arousal is tightly associated with positive/negative valence when stimuli are unambiguously positive (or negative), the two dimensions come apart as a function of stimulus ambiguity. However, data supporting this hypothesis usually fail to distinguish between PAQ and CA (Mattek et al., Citation2017, supplementary materials).
In light of all this, the present research aims to answer three questions. First, does the V-shaped valence/arousal relation hold strong for affective states communicated via human vocal bursts?
Second, if a V-shape relationship exists for vocal bursts, is it specific to ratings of subjective experience (i.e. How did you feel when listening to the vocalization? – CA), or does it apply to semantic judgments as well? (i.e. How did the speaker feel when producing the vocalization? – PAQ). Also, do CA and PAQ come apart significantly in the context of vocal bursts?
Third, does stimulus ambiguity explain violations in the V-shaped relation between valence and arousal in vocal bursts? If this is the case, does ambiguity equally affect judgments about one’s own experience (CA) and others’ emotional experience (PAQ)?
Two studies were designed to answer these questions. In the first study, we asked a small convenience sample to provide valence and arousal judgments about 1,008 vocal bursts under two experimental conditions, collected across multiple experimental sessions (∼48,000 ratings collected in total). We then confirmed the findings obtained from study 1 in a second online experiment, conducted on a much larger and heterogeneous cohort (∼900 participants; ∼38,000 ratings collected in total).
Materials and methods
Participants – Study 1. Participants of study 1 were graduate students with a background in psychology or medicine (i.e. 18 years of education). All individuals signed informed consent to take part in the study after the risks and procedures were explained. Volunteers did not receive any compensation for their participation. They were clinically healthy and reported no history of neurological or psychiatric conditions, as well as no history of drug or alcohol abuse. They had normal hearing and normal or corrected-to-normal vision. The local Ethical Review Board approved the experimental protocol and procedures (CEAVNO: Comitato Etico Area Vasta Nord Ovest; Protocol No. 1485/2017), and the study was conducted in accordance with the Declaration of Helsinki. From an initial sample of 19 individuals, 12 Italian native speakers (6 F, 6 M; 29.02 ± 2.12 years of age) completed the data collection. Four individuals dropped out after the first experimental session, whereas three participants withdrew after having completed half of the study protocol. Prior to the beginning of each experimental session, participants were asked to self-assess their anxiety level and positive/negative mood on a scale ranging from 0 to 100. Overall, individuals reported low levels of anxiety (32.53 ± 18.4) and a moderately positive mood (65.31 ± 9.34).
Participants – Study 2. In the second study, we recruited 1,128 Italian participants through advertisements on social media. Of these, 925 individuals (545 F, 14 non-binary; 31.6 ± 11.3 years of age) provided consent to participate in the experiment and rated at least one vocal burst. Seven hundred and thirty-seven (737) individuals completed all trials. All participants reported having normal hearing, and the average number of education years was 15.5 ± 2.6. Risks and procedures were explained on the welcome page, and participants had the right to withdraw at any time. Study 2 was approved by the local Ethical Review Board (Comitato Etico congiunto per la ricerca della Scuola Normale Superiore e della Scuola Superiore Sant'Anna; Protocol No. 14/2022) and was conducted following the Declaration of Helsinki.
Stimuli. Stimuli consisted of nonlinguistic utterances commonly referred to as vocal bursts. These vocalizations predate spoken words (Banse & Scherer, Citation1996; Cordaro et al., Citation2016; Prather et al., Citation2009; Snowdon, Citation2003) in conveying specific emotional content (Simon-Thomas et al., Citation2009; Sauter et al., Citation2010b; Cordaro et al., Citation2016; Bryant, Citation2021) which is not only interpreted by conspecifics but, to some extent, by exemplars of other species as well (Filippi et al., Citation2017; Fritz et al., Citation2018). Two thousand and thirty-two (2,032) vocal bursts recorded by 56 speakers (26 F, 30 M, age range: 18-35) were collected from two previously published datasets: 425 utterances recorded by 11 professional actors were obtained from the VENEC corpus (Laukka et al., Citation2013), and 1,607 vocalizations recorded by 45 naïve subjects (countries of origin: United States, India, Kenya, Singapore) retrieved from Cowen and colleagues (Cowen et al., Citation2019). The procedure to record vocal bursts consisted in presenting to each individual a subset of specific scenarios deemed to elicit 30 emotions of interest, such as sadness, fear, and sexual desire, covering a broad spectrum of combinations of valence and arousal (see Supplementary Table 1; adapted from Cowen et al., Citation2019). Then, they had to imagine being present in the given scenario and produce the most appropriate non-linguistic sound. In addition, Cowen et al. (Citation2019) also sampled spontaneous non-linguistic vocal utterances by the same actors (see their Supplementary Materials). From this pool of stimuli, we selected 1,008 vocal bursts (600 utterances from female speakers) based on their duration: stimuli lasting less than 567 ms or more than 1,700 ms were discarded.
Stimuli – Study 1. In the first study, each individual listened and rated all stimuli under two experimental conditions. Ratings were obtained from 18 experimental sessions over multiple days. In total, each participant completed 8-15 h of data collection. Further, in study 1, we modified the duration of vocal bursts so that each stimulus lasted exactly 850 ms. Thus, each sound could be maximally stretched or compressed in time by 50% of its original duration, and the procedure was performed using a pitch-preserving algorithm (audioStretch, phase-vocoder method). This allowed changing stimulus duration without altering its spectral properties (e.g. fundamental frequency, speech harmonics). Lastly, stimuli were normalised in loudness according to the EBU R 128 Standard.
Stimuli – Study 2. In the second study, participants were presented with the original version of the 1,008 vocal bursts. Extant literature suggests that temporal structure is a crucial characteristic of vocal bursts (Bryant & Aktipis, Citation2014), which may affect the perceived emotion intensity and authenticity. To assess whether unedited sounds differ in their affective properties, no time compression or stretching was applied, and the stimuli were not normalised in loudness. Each participant listened to a random selection of 12 stimuli under two experimental conditions, and the average completion time was approximately 8 min.
Protocol and Procedure. Participants were asked to listen to vocal bursts under two alternative experimental conditions: “Core Affect” (CA) and “Perception of Affective Qualities” (PAQ). CA required individuals to focus on their internal affective state as a result of stimulus presentation, namely on how they felt when listening to the sound. Instead, PAQ prompted participants to consider the speaker’s affective state, namely to evaluate how the speaker felt when producing the sound (Itkes et al., Citation2017, Citation2019).
Protocol and Procedure – Study 1. Because affective ratings can be contaminated by inter-subject variability (an issue emphasised by Barrett et al., Citation2018; Kuppens et al., Citation2013; Kuppens et al., Citation2017), we asked all participants to rate each of the 1,008 vocal bursts under CA and PAQ conditions. The two experimental conditions consisted of 9 blocks of 112 randomly selected vocal bursts, with the order of blocks randomised across individuals. Participants were instructed to complete no more than one block of stimuli per day to avoid fatigue or loss of concentration. The two experimental conditions were acquired in distinct periods of time, with a minimum of 3 and a maximum of 5 days between the end of the first condition and the beginning of the second. The order of experimental conditions was counterbalanced across participants (i.e. half of them participated in the CA condition first, whereas the remaining six in the PAQ first).
Stimulus presentation and the recording of ratings were implemented in MATLAB (R2019b; MathWorks Inc., Natick, MA, USA). The study was conducted remotely: participants ran a pre-compiled MATLAB executable binary on their personal computers. To ensure the counter-balanced presentation of CA and PAQ, the material relative to the second condition was provided only after completing the nine blocks of the first one. Volunteers were asked to perform the experiment in a quiet environment, wear headphones, and set the audio volume to a comfortable level. Before starting the data collection, participants had to indicate their current mood and anxiety level using two visual-analog scales. The mood scale ranged from “very negative” to “very positive”, whereas the anxiety scale ranged from “not at all” to “very much”. After this, individuals were redirected to the study instruction page that preceded the actual beginning of the experiment. For each vocal burst, they had to move the cursor to indicate either the subjective (i.e. CA condition) or the speaker’s (i.e. PAQ condition) level of arousal ranging from “very calm” to “very excited”. Similarly, valence was rated in each condition on a visual analog scale ranging from “very negative” to “very positive”. In both cases, a central anchor point indicated the mid-level. The starting position of the cursor was randomised for each trial and slider. Lastly, to investigate if raters systematically perceived the time stretching of stimuli, for each vocal burst, we asked them to indicate whether they perceived it as “modified” or “not modified”.
Protocol and Procedure – Study 2. In the second study, we took advantage of online recruitment to reach a larger cohort of participants and increase sample heterogeneity. The experiment was implemented in Qualtrics XM (Qualtrics, Provo, UT). Firstly, we randomly split the 1,008 vocal bursts into 84 batches (12 unique stimuli each). Each participant was presented with a randomly selected batch of stimuli and instructed to provide valence and arousal ratings under the CA and PAQ conditions (i.e. 48 responses in total). Differently from study 1, valence and arousal scores were collected in separate blocks. We opted for this procedure as it was brought up during the review process that the concomitant rating of valence and arousal dimensions could result in spurious correlations between the two (Lima et al., Citation2013). Thus, four blocks of ratings were collected for the 12 stimuli included in a batch: (1) valence under the PAQ condition, (2) arousal under the PAQ condition, (3) valence under the CA condition, and (4) arousal under the CA condition. The order of stimuli within a batch and of response blocks was randomised across subjects. Volunteers were asked to perform the experiment in a quiet environment free from distractions and set the audio volume to a comfortable level. Participants were instructed to provide valence scores using a visual analog scale that ranged from “extremely unpleasant” to “extremely pleasant”, with the central anchor point “neither pleasant nor unpleasant”. Arousal ratings were collected on a visual analog scale ranging from “not aroused at all” to “very aroused”, with the central anchor point being “moderately aroused”. For study 2, the starting position of the cursor was fixed. Specifically, for the arousal scale, the cursor appeared on the left anchor point (“not aroused at all”), whereas, for the valence, it appeared on the central anchor point (“neither pleasant nor unpleasant”). For each stimulus, affective dimension and condition we collected an average of 9 ratings (CA valence median number of acquired ratings, [min – max] = 9, [5–11]; PAQ valence = 9, [6–11]; CA arousal = 9, [5–11]; PAQ arousal = 8, [6–11]).
Data Analysis. Across the two studies, we tested whether a V-shaped association, rather than a linear trend, captured the valence-arousal relationship in CA and PAQ conditions. To do this, we first computed the between-participants average valence and arousal scores and then built three regression models summarised by formulae A, B, and C. Formula A tested the existence of a linear relationship between affective dimensions. Formulae B and C, instead, expressed two V-shaped associations: a quadratic relationship and a linear association between absolute difference from neutral valence and arousal scores, respectively.
Formula A:
Arousal = α + β * Valence
Formula B:
Arousal = α + β * Valence + β * Valence2
Formula C:
Arousal = α + β * |(Valence-50)|
For both CA and PAQ, the adjusted coefficient of determination R2 evaluated which model better explained the relationship between the two affective dimensions. Because stimuli selection may affect fitting results, we compared the linear and the V-shaped models after equating the number of vocal bursts over emotion categories with random selection. To do this, we used categorical ratings (Cowen et al., Citation2019) and a winner-takes-it-all approach to attribute each vocal burst to one of the 30 emotions of interest. Categories with less than 8 exemplars were discarded, and the minimum number of stimuli per category was established. We then randomly selected the same number of vocal bursts for each emotion and obtained their valence and arousal ratings averaged across participants. Using this subset of vocal bursts, we fitted the linear and the V-shaped models and assessed the difference between the adjusted coefficients of determination. We repeated this analysis 1,000 times, selecting a random subset of vocal bursts at each iteration and using valence and arousal ratings collected in studies 1 and 2. Such a procedure ensured that differences in fitting (if any) did not depend on the unequal distribution of vocal bursts across emotion categories. To further rule out the possibility that results observed in the 1,008 vocal bursts were specific to this set of exemplars, we repeated the same analysis on the original set of 2,032 stimuli and by using dimensional ratings collected by Cowen and coauthors (Citation2019). On a separate note, we characterised valence and arousal ratings of vocal bursts as a function of the emotion category they belong to and across conditions (i.e. core affect and perception of affective quality; see Supplementary materials).
Moreover, using data collected in study 2, we compared the V-shape goodness of fit with the one obtained from the linear model using a generalised linear mixed-effects approach. Specifically, instead of aggregating valence and arousal scores across individuals, single-trial responses from each participant were modelled. This allowed the specification of both fixed and random effects. As a first step, the dataset was arranged so that each row expressed the valence and arousal scores of a single participant listening to a specific vocal burst. Two models were then built and compared: the first (formula D) included the fixed terms specified in formula A and – as random terms – the participant and the stimulus identity; the second model (formula E) included the fixed terms specified in formula B and the random terms of formula D. After having inspected the distribution of arousal scores, we opted for a Poisson distribution and a log link function to model ratings of the dependent variable. As a further check, we repeated the analysis by modelling scores of the dependent variable using the Normal distribution. Because the fit expressed by formula D is nested in formula E, in addition to inspecting the goodness of fit parameters (i.e. adjusted R2, bayesian information criterion – BIC, Akaike information criterion – AIC, and log-likelihood), we used the theoretical likelihood ratio test to directly compare the two models and assess the significance of the difference. These analyses were repeated across the two experimental conditions (i.e. CA and PAQ), as in the case of the fixed-effects approach.
Formula D:
Arousal = α + β * Valence + (1 | Participant) + (1 | Stimulus)
Formula E:
Arousal = α + β * Valence + β * Valence2 + (1 | Participant) + (1 | Stimulus)
Also, we investigated whether and to what extent valence and arousal ratings were consistent across experimental conditions. Specifically, the difference between CA and PAQ valence scores was computed for each participant and then averaged across subjects. We used a Wilcoxon signed-rank test to evaluate whether the median of the distribution of differences was significantly distant from zero. Statistical significance for this test was set to p < 0.05. We repeated the procedure for the arousal dimension as well.
As the original conceptualisation of valence is bipolar (Russell, Citation2003; Russell & Carroll, Citation1999), we separately assessed the significance of CA-PAQ differences for positively – and negatively-valenced stimuli. To this aim, sounds having positive (or negative) average scores in both experimental conditions were identified, and the between-condition difference was assessed using a Wilcoxon signed-rank test (p < 0.05).
To further explore the relationship between CA and PAQ, we built a linear model testing the association between valence and arousal ratings across the two conditions. CA scores were used to predict PAQ, and adjusted R2 was considered a measure of the goodness of fit.
Furthermore, we explored the reproducibility of valence and arousal scores collected under the CA and PAQ conditions across the two studies. In this regard, we employed between-participants average valence scores obtained from study 1 under the CA condition to predict CA valence scores collected in study 2. The adjusted coefficient of determination R2 was used to measure the extent to which the variation in ratings collected in the second study was explained by the scores of the first experiment. The procedure was repeated for judgments of CA arousal, PAQ valence, and PAQ arousal.
We also compared the between-participants variability in valence and arousal ratings between the CA and the PAQ conditions. In this regard, we first estimated the between-participants average and standard deviation of valence and arousal judgments of each stimulus. Afterward, to account for potential differences in average ratings between conditions while focusing on variability, for each affective dimension, we computed the coefficient of variation as the standard deviation divided by the average. We compared the coefficients of variation obtained from CA and PAQ using a Wilcoxon signed rank test (p < 0.05) and repeated this analysis for studies 1 and 2 separately.
Lastly, we were interested in clarifying whether stimulus ambiguity could explain violations of the V-shaped relationship between valence and arousal and investigating if the role of ambiguity was similar between experimental conditions. Here, we defined ambiguity in terms of between-individuals variability in ratings (cf. Brainerd, Citation2018), as – for instance – an average score of 50 could result from consistent ratings (i.e. lower between-subjects standard deviation; low ambiguity) or scores with extremely opposite polarity (i.e. 10 vs 90; high between-subjects standard deviation; high ambiguity). In brief, to identify ambiguous stimuli (i.e. those having significantly higher-than-average standard deviations), as well as vocal bursts rated consistently between participants (i.e. those having significantly lower-than-average standard deviations), we first computed the standard deviation of each stimulus’ valence and then created a null distribution by randomly shuffling valence scores of each participant 10,000 times and computing stimulus standard deviation at each iteration. Stimuli with a standard deviation larger than the 97.5th percentile of the null distribution were considered ambiguous, whereas those having a standard deviation smaller than the 2.5th percentile were defined as unambiguous (α = 0.05, two-tailed test). Also, to quantify the extent to which stimuli violated the V-shape, for each vocal burst, we estimated the squared distance (i.e. fitting error) between the actual arousal rating and the one predicted by the quadratic relationship with valence (i.e. formula B). Across the two studies and conditions, we then used the Wilcoxon rank sum test (p < 0.05) to verify whether ambiguous stimuli were departing from the V-shape valence-arousal relationship (i.e. had greater fitting errors) more than unambiguous vocal bursts. As the fitting error represented the squared distance from predicted arousal (i.e. the unsigned difference), we then assessed – using again Wilcoxon rank sum test; p < 0.05 – whether arousal ratings of ambiguous vocal bursts were significantly higher (or lower) than those of stimuli rated consistently. To rule out the possibility that findings obtained from this analysis were due to the between-participants averaging procedure, we assessed the effects of stimulus ambiguity on arousal ratings with a linear mixed model. Using single-participant data collected in study 2 and the model summarised by formula F, we estimated the significance of the main effect of ambiguity and of the interaction between ambiguity and valence in determining arousal scores.
Formula F:
Arousal = α + β * |(Valence-50)| + β * Ambiguity + β * (Ambiguity × |(Valence-50)|) +
(1 | Participant) + (1 | Stimulus)
As a side note, in study 1, pairwise Pearson’s product-moment correlations assessed the coherence in valence and arousal ratings across participants. The significance level was adjusted for the number of tests (i.e. all possible pairings of subjects) using Bonferroni correction (pcrit = 7.6*10−4). Also, because each individual rated 1,008 vocal bursts, we explored the existence of carry-over effects by computing the autocorrelation function of valence and arousal ratings (autocorr) and its significance (p < 0.05; see Supplementary Materials and Supplementary Figures 1–2).
All analyses were conducted using MATLAB (R2019b; MathWorks Inc., Natick, MA, USA).
Results
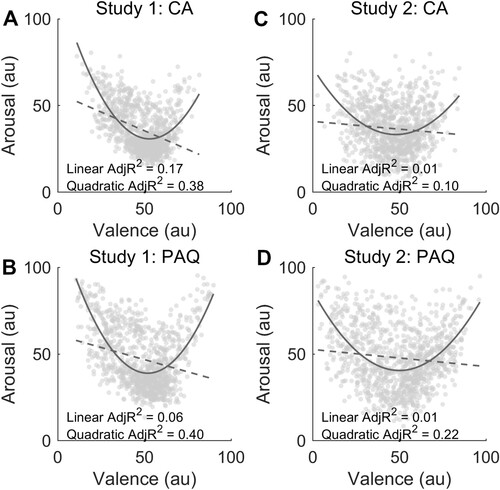
To answer our first question, we evaluated whether a V-shaped fit, rather than a linear model, explained the relationship between arousal and valence in response to brief human vocalizations. We compared the three models on group-averaged scores and found that the quadratic fit and the one based on the absolute difference from neutral valence outperformed the linear model across the two experimental conditions and studies. In study 1 CA data, we observed adjusted R2 values of 0.38, 0.36, and 0.17 for the quadratic, absolute difference from neutral valence, and linear fits, respectively (A). Likewise, in the PAQ condition, we found that the V-shaped fits attained an adjusted R2 value of 0.40 (formula B) and 0.37 (formula C), whereas explained variance was 0.06 for the linear fit (B). In the CA condition of study 2, we found adjusted R2 values of 0.10 and 0.01 for the quadratic and linear fits, respectively (C). In the PAQ condition, the adjusted R2 value was 0.22 for the quadratic fit and 0.01 for the linear model (D). The adjusted R2 for the model based on the absolute difference from neutral valence was 0.11 in CA and 0.22 in PAQ.
Figure 1. The figure shows the extent to which the quadratic (V-shaped; solid line) and the linear models (dashed line) explain the relationship between valence and arousal in the core affect (CA; panel A) and in the perception of affective quality (PAQ; panel B) of study 1. Panel C (CA condition) and D (PAQ condition) represent the valence-arousal relationship in study 2.
The two V-shaped models outperformed the linear fit even when participants’ ratings were aggregated differently. Indeed, by computing median valence and arousal scores in the CA condition of study 1, we found adjusted R2 of 0.31, 0.29, and 0.15 for the quadratic, the absolute difference from the neutral valence and the linear fits, respectively (Supplementary Figure 3A). Similar results were observed in the PAQ condition: adjusted R2 was 0.40, 0.35, and 0.06 for the quadratic, absolute difference, and linear fits, respectively (Supplementary Figure 3B). In line with this, the quadratic, the absolute difference, and the linear fits yielded 0.12, 0.15, and 0.01 adjusted R2 in study 2 CA data (Supplementary Figure 3C), and 0.23, 0.24, and 0.01 adjusted R2 in the study 2 PAQ condition (Supplementary Figure 3D). That the V-shaped model explained the valence-arousal relationship better than the linear model was also evident in the original ratings collected by Cowen and colleagues on 2,032 vocal bursts (2019; e.g. quadratic fit: adjusted R2 = 0.33; linear fit: adjusted R2 = 0.21; Supplementary Figure 4).
Concerning categorical ratings collected by Cowen and colleagues (Citation2019), we observed uneven distribution of vocal bursts across emotions, both for the original set of 2,032 vocal bursts (Supplementary Figure 5) and for the selection of 1,008 stimuli employed in studies 1 and 2 (Supplementary Figure 6). Also, we reported valence and arousal ratings of emotion categories across studies, and conditions in Supplementary Figures 7–11. To rule out the possibility that the uneven distribution of stimuli across the affect space may have affected the fitting results, we repeated the comparison between the quadratic V-shaped and the linear models after equating the number of vocal bursts over emotion categories with random sampling. Importantly, we still observed higher fitting values for the V-shaped model, as compared to the linear one (). Using CA ratings collected in study 1, we found that the average (± standard deviation) adjusted R2 across the 1,000 iterations (each: n = 168 vocal bursts; 21 emotion categories; 8 vocal bursts per category) was 0.104 ± 0.035 (min: 0.015, max: 0.248) for the linear model and 0.343 ± 0.048 (min: 0.200, max: 0.491) for the quadratic one (A). Also, across random resamplings, the V-shaped fit explained on average 23.9% (± 4.8%) variance more than the linear model (B). In study 2, the average adjusted R2 was 0.0007 ± 0.009 (min: −0.006, max: 0.054) for the CA linear fit and 0.112 ± 0.035 (min: 0.005, max: 0.256) for the CA quadratic model (E). The V-shaped fit explained on average 11.1% (± 3.5%) variance more than the linear model (F).
Figure 2. The figure shows the goodness of fit of the linear and quadratic (V-shaped) models after equating the number of vocal bursts over emotion categories with random selection (n = 1,000 iterations). In panels A, C, E, and G, each dot represents the adjusted R2 coefficient of the V-shaped (dark grey) and linear (light grey) models for a random selection of 168 vocal bursts (21 emotion categories, 8 stimuli per category). In panels B, D, F, and H, histograms show the distribution of the difference between the two models. The dark grey dot and line represent the average difference and standard deviation across the 1,000 random iterations.
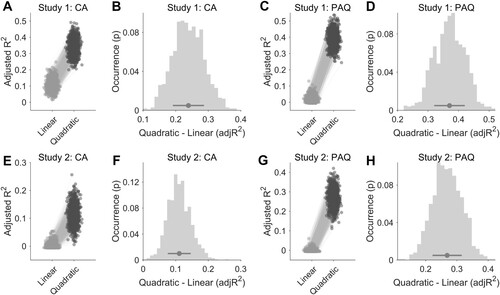
Similarly, using PAQ ratings obtained from study 1, we showed that the average adjusted R2 coefficient across iterations was 0.022 ± 0.019 (min: −0.006, max: 0.130) for the linear fit and 0.392 ± 0.047 (min: 0.244, max: 0.537) for the quadratic model (C). In this regard, the V-shaped fit explained on average 37.0% (± 5.0%) variance more than the linear model (D). In study 2, the average adjusted R2 coefficient across iterations was −0.001 ± 0.007 (min: −0.006, max: 0.061) for the PAQ linear fit, 0.268 ± 0.047 (min: 0.112, max: 0.421) for the PAQ quadratic model (G), and the V-shaped fit explained on average 26.9% (± 4.7%) variance more than the linear model (H).
The same analysis conducted on the entire set of 2,032 vocal bursts and dimensional ratings collected by Cowen and colleagues (Citation2019) confirmed that a quadratic model explained the valence-arousal relation better than a linear fit (Supplementary Figure 12). In line with previous findings (1,000 iterations, each: n = 384 vocal bursts; 24 emotion categories; 16 vocal bursts per category), the average adjusted R2 was 0.229 ± 0.029 (min: 0.147, max: 0.342) for the linear model and 0.352 ± 0.025 (min: 0.274, max: 0.442) for the quadratic one, with an average difference of 12.3% (± 2.2%) in explained variance between the models.
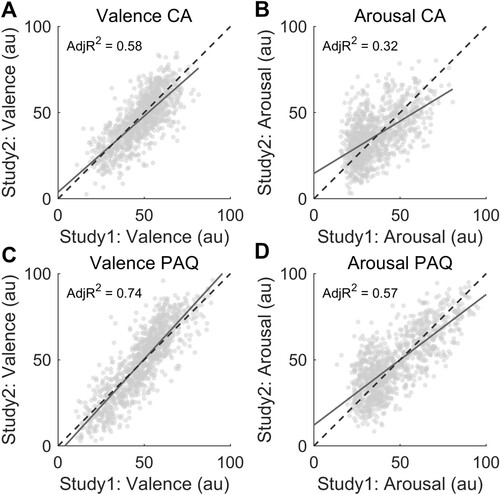
Having obtained valence and arousal ratings from two studies allowed us to explore the reproducibility of judgments acquired under the CA and PAQ conditions (). In PAQ, we found that average valence scores collected in study 1 explained 74% of the variance in ratings obtained from study 2 (C). Concerning valence ratings in CA, the proportion of explained variance dropped to 58% (A). Similar results were observed for the arousal dimension: study 1 arousal ratings explained 57% of the variance of study 2 judgments in the PAQ condition (D) and 32% in CA (B).
Figure 3. Panels A and C show the association between valence ratings collected across the two studies under the CA and PAQ conditions, respectively. The similarity in arousal scores collected between the studies is represented in panel B for the CA condition and D for the PAQ condition. Solid lines represent linear regression lines. Dashed lines express the perfect correspondence between study 1 and study 2 ratings.
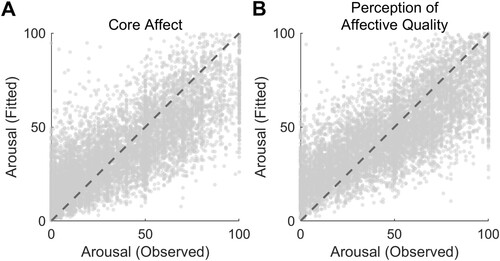
We further analyzed the relationship between valence and arousal using the mixed-effects approach and demonstrated that, even in this case, a quadratic fit explained their association significantly better than a linear model in both experimental conditions. As far as CA was concerned, the adjusted R2 was 0.683 for the quadratic model and 0.679 for the linear one, and the likelihood ratio test statistic resulted to be significant (linear model: log-likelihood = −67,132, BIC = 134,301, AIC = 134,273; quadratic model: log-likelihood = −65,966, BIC = 131,977, AIC = 131,942; LRStat(1) 2333.2, p < 0.001; A). Similar results were observed in the PAQ condition: the adjusted R2 was 0.643 for the quadratic fit and 0.636 for the linear model (linear model: log-likelihood = −64,903, BIC = 129,841, AIC = 129,813; quadratic model: log-likelihood = −63,638, BIC = 127,322, AIC = 127,286; LRStat(1) 2528.8, p < 0.001; B). The modelling of arousal scores using the Normal distribution (rather than the Poisson) did not change the results. In CA data, we observed adjusted R2 = 0.520 for the quadratic model and adjusted R2 = 0.497 for the linear fit (LRStat(1) 485.66, p < 0.001). Using PAQ scores, we found adjusted R2 = 0.542 for the quadratic model and adjusted R2 = 0.515 for the linear fit (LRStat(1) 668.37, p < 0.001).
Figure 4. This figure shows the results for the generalised linear mixed-effects model analysis (study 2; Poisson distribution, log link function, fit method: maximum likelihood using Laplace approximation). Panel A depicts the relationship between arousal scores observed in the CA condition and those predicted based on the squared version of CA valence ratings (formula D in the main text). Panel B shows the same association in PAQ data. Dashed lines represent perfect predictions.
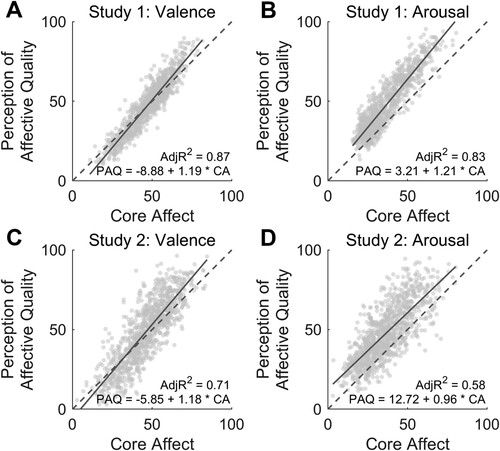
To answer our second question, we investigated to what extent affective ratings in the PAQ condition explained arousal and valence scores in the CA experiment. Across the two studies, we found a strong association for the valence (study 1 – valence adjusted R2 = 0.87; study 2 – valence adjusted R2 = 0.71; A, C), as well as for the arousal dimension (study 1 – arousal adjusted R2 = 0.83; study 2 – arousal adjusted R2 = 0.58; B, D).
Figure 5. This figure summarises the linear relationship between core affect and perception of affective quality ratings of valence (panel A, C) and arousal (panel B, D) across the two studies (study 1 top row, study 2 bottom row).
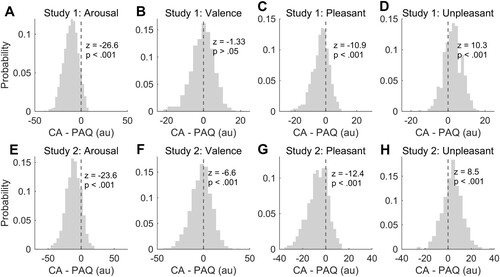
When assessing the differences between CA and PAQ ratings in study 1, we observed higher arousal scores when participants had to judge the speaker’s affective state as compared to their own (z = −26.6, p < 0.001; A). Conversely, valence scores did not differ between CA and PAQ (z = −1.33, p > 0.05; B), indicating no significant shifts in the neutral point between the two experimental conditions. However, because valence was defined along a bipolar dimension in our study, we replicated this analysis by splitting vocal bursts into two independent datasets based on experienced and attributed pleasantness (i.e. pleasant stimuli: average score > 50 in CA and PAQ; unpleasant stimuli: average score < 50 in both conditions). Importantly, we found that the vast majority of vocal bursts (i.e. 898 out of 1008; 89.1%) were rated consistently across the two experimental conditions (451 pleasant, 44.7%; 447 unpleasant, 44.3%). Moreover, CA valence scores were closer to neutral as compared to PAQ ratings, regardless of stimulus polarity (pleasant stimuli: CA mean ± standard deviation = 58.7 ± 5.8, PAQ = 61.9 ± 8.5, Wilcoxon signed rank test z = −10.9, p < 0.001, C; unpleasant stimuli: CA = 37.1 ± 8.3, PAQ = 34.5 ± 10.0, Wilcoxon signed rank test z = 10.3, p < 0.001; D). Participants also reported higher arousal scores for unpleasant stimuli as compared to pleasant ones across the two experimental conditions (CA: pleasant stimuli mean ± standard deviation = 32.1 ± 10.6, unpleasant stimuli = 41.8 ± 13.5; Wilcoxon rank sum test z = −11.2, p < 0.001; PAQ: pleasant stimuli = 42.7 ± 15.8, unpleasant stimuli = 53.7 ± 17.1; Wilcoxon rank sum test z = −10.0, p < 0.001). In study 2, we confirmed that stimuli were rated as more arousing in PAQ than in CA (z = −23.6, p < 0.001; E). Also, we found that valence scores were more negative if collected under the CA condition (mean = 46.2 ± 14.6) as compared to the PAQ experiment (mean = 48.9 ± 20.3; z = −6.6, p < 0.001; F). Of note, although the shift in the neutral point was significant in study 2, but not in study 1, the directionality of the effect was the same across the two (i.e. negative z value). As in study 1, the majority of stimuli (i.e. 832 out of 1008; 82.5%) were rated consistently across the two experimental conditions (386 pleasant, 38.3%; 446 unpleasant, 44.2%). Also, we confirmed that pleasant stimuli were judged less positively when participants followed CA (mean = 60.5 ± 7.2), rather than PAQ task instructions (mean = 67.3 ± 10.1; Wilcoxon signed rank test z = −12.4, p < 0.001; G). Similarly, for unpleasant stimuli, negative valence ratings were less extremes when subjects referred to CA (mean = 33.7 ± 9.6) than to PAQ (mean = 30.1 ± 11.6; Wilcoxon signed rank test z = 8.5, p < 0.001; H). Moreover, unpleasant stimuli were judged as more arousing than pleasant ones under the PAQ (pleasant stimuli, mean = 46.5 ± 15.8; unpleasant stimuli, mean = 51.8 ± 19.2; Wilcoxon rank sum test z = −3.84, p = 0.001), but not the CA condition (pleasant stimuli, mean = 36.3 ± 13.9; unpleasant stimuli, mean = 38.2 ± 15.0; Wilcoxon rank sum test z = −1.77, p = 0.076).
Figure 6. This figure summarises the differences between core affect (CA) and perception of affective quality (PAQ) as a function of arousal (panel A and E), valence (panel B and F), pleasantness (panel C and G), and unpleasantness (panel D and H) of vocal bursts. Arousal, pleasantness, and unpleasantness ratings were more extreme for the PAQ rather than for the CA condition across the two studies. A significant shift in the neutral point was observed in study 2 (panel F) but not in study 1 (panel B).
When investigating the variability in ratings across experimental conditions in study 1, we observed significantly larger coefficients of variation in CA (arousal CV mean = 0.67 ± 0.16; valence CV mean = 0.80 ± 0.22) as compared to PAQ (arousal CV mean = 0.47 ± 0.17; valence CV mean = 0.77 ± 0.25) both for arousal and valence dimensions (Wilcoxon signed rank test z = 26.1, p < 0.001 and z = 6.4, p < 0.001, respectively). In study 2, CV values were significantly higher for the CA as compared to the PAQ condition as well: arousal mean CV was 0.75 (± 0.24) for CA and 0.57 (± 0.22) for PAQ (Wilcoxon signed rank test z = 21.3, p < 0.001), whereas valence mean CV was 0.80 (± 0.25) for CA and 0.67 (± 0.25) for PAQ (Wilcoxon signed rank test z = 14.8, p < 0.001).
Lastly, across the two studies and conditions, we evaluated the extent to which affective ratings violated the V-shaped relationship as a function of stimulus ambiguity and found that ambiguous vocal bursts (i.e. those with a significantly higher-than-average standard deviation in valence) had higher fitting errors (i.e. squared distance from predicted arousal score), than stimuli rated more consistently between participants (CA – study 1: Wilcoxon rank sum test z = 4.85, p < 0.001; study 2: z = 2.92, p = 0.004; PAQ – study 1: z = 4.37, p < 0.001; study 2: z = 3.64, p < 0.001). In addition, we found that vocal bursts characterised by high ambiguity were also considered more arousing, as compared to less ambiguous stimuli (CA – study 1: Wilcoxon rank sum test z = 5.52, p < 0.001; study 2: z = 5.77, p < 0.001; PAQ – study 1: z = 3.91, p < 0.001; study 2: z = 4.12, p < 0.001). Importantly, ambiguous and unambiguous stimuli did not differ in terms of valence (p-values > 0.05 in all conditions and studies). When using single-participant data and the mixed-effect approach, we found that ambiguity significantly explained arousal scores across the two conditions (CA condition: t-stat(5868) 4.820; p-value < 0.001; PAQ condition: t-stat(6399) 3.958; p-value < 0.001). Instead, we did not observe any significant interaction between stimulus ambiguity and absolute distance from neutral valence (CA condition: t-stat(5868) 0.471; p-value = 0.638; PAQ condition: t-stat(6399) −0.969; p-value = 0.333). The distribution of stimulus ambiguity and fitting error in the affect space are shown in Supplementary Figures 13 and 14.
Discussion
In the current work, our first aim was to test whether the V-shaped relationship between valence and arousal, emerging from other studies on affective vocal bursts (e.g. Green & Cliff, Citation1975; Sauter et al., Citation2010a; Cowen et al., Citation2019; Anikin Citation2020; Holz et al., Citation2021), holds across a variety of experimental conditions. To this aim, we collected judgments about a large sample of nonlinguistic human utterances (n = 1,008) across two studies. In study 1, all stimuli were rated by a cohort of 12 participants across several days. In study 2, randomised subsets of the stimuli were rated by a cohort of 925 participants. In both studies, each stimulus was rated under two experimental conditions: focusing on one’s subjective feelings (CA) and trying to interpret the emotion of the speaker (PAQ). We found that the V-shaped relation between arousal and valence holds across conditions and studies. Indeed, a quadratic fit outperformed a linear model in summarising the relationship between the two affective dimensions, even after equating the number of vocal bursts over emotion categories with random sampling. Importantly, the existence of a V-shaped association between valence and arousal does not necessarily imply that states characterised by low arousal and extremely positive or negative valence are nonexistent. Instead, it signals that they are – on average – less likely to be evoked by or communicated through vocal bursts, as compared to low arousal neutral states or to high arousal, very (un)pleasant ones.
Conducting two studies allowed us to verify the stability of results in the face of differences in the experimental design. We summarise the main changes from study 1 to study 2 as follows: (a) the position of the cursor, (b) the temporal characteristics of the stimuli, (c) the order of their presentation, and (d) the composition of the cohorts. First, (a) while in study 1, the starting position of the cursor was randomised, in study 2, it was fixed at neutral valence and at the lowest possible arousal score, respectively. Despite that, no relevant difference seems to follow from this design choice regarding the V-shaped fit. Second, (b) in study 1, each selected vocal burst was modified and could be maximally stretched or compressed in time by 50% of its original duration. The worry that this alteration of the stimuli might have had an impact on subjects’ perception of the emotional charge of vocalizations was mitigated by the fact that only 6% of stimuli were actually perceived as artificially manipulated by at least one-third of our raters. In fact, results are consistent with those of study 2, which used unedited stimuli. Third, (c) while in study 1, subjects were asked to rate both arousal and valence right after the presentation of each stimulus, in study 2, we followed Lima et al. (Citation2013) in proposing the same stimulus several times and asking subjects to rate a single dimension each time. Again, no substantial effect seems to follow from this methodological choice. Finally, (d) conducting two studies with different cohorts also allowed us to address a pressing methodological question in affective science and in psychology more generally (Smith & Little, Citation2018). Small-N design studies – like our study 1 – involve a relatively small number of participants but allow researchers to collect a significant amount of data per participant (i.e. “deep phenotyping” approach). Collaborative effort studies – like our study 2 – rather test a larger number of individuals on a relatively small number of stimuli, thereby allaying worries about sample representativeness. In our case, both studies yielded similar results, thereby indicating that the measured effect is likely to be robust in the face of both inter- and intra-individual variance.
Previous studies on other kinds of stimuli (Itkes et al., Citation2017; Itkes & Kron, Citation2019) investigated how affective ratings of pictures and clips differed between semantic (PAQ) and subjective (CA), concluding that they represent two distinct constructs. However, in these studies, different groups of subjects were asked to provide ratings for the two conditions. This may be potentially problematic due to the well-known problem of intersubject variability in affective ratings (Barrett et al., Citation2018; Kuppens et al., Citation2017). By collecting participants’ ratings for all stimuli in both PAQ and CA, our studies have the advantage of sidestepping possible confounds related to idiographic ratings.
To our knowledge, this is the first study on vocal bursts testing the same stimuli under two distinct experimental conditions: (a) subjective experience of affect (CA), by asking participants to focus on their internal affective state; and (b) emotion attribution (PAQ), in which individuals had to consider how the speaker felt when producing the sound. In our data, we found that perceived pleasantness in CA can be explained by PAQ valence scores (i.e. between 87% and 71% of explained variance) and that between 89% (i.e. study 1) and 83% (i.e. study 2) of vocal bursts are rated consistently in valence across the two experimental conditions.
However, some differences across the two conditions were observed. First, between-participants agreement in ratings was higher in PAQ than in CA. In addition, we observed significantly higher arousal scores when participants had to rate actors’ affective state (PAQ) as compared to their own (CA). One possible interpretation relates to the fact that arousal represents one’s own levels of activation and action-readiness (Frijda, Citation1986; Goldie, Citation2002). In this view, arousal – possibly more so than valence – is perceived at peak levels when the subject is directly involved and engaged in the relevant action: for instance, when facing a threat and physiological responses are recruited to facilitate a flight (or fight) reaction. Clearly, this was not the case in our studies, where participants were asked to rate stimuli that did not directly involve their immediate environment. Relatedly, it has been suggested that arousal may work as a proxy for some salience mechanism (Petrolini & Viola, Citation2020) or as an evolutionary significant attention-grabbing filter (Holz et al., Citation2021). Both readings see arousal as a more primitive construct with respect to valence, which seems to enter the scene at a later stage, i.e. once stimuli have already been “tagged” as relevant (see also Olteanu et al., Citation2019).
Moreover, in the CA condition, participants rated vocal stimuli with less extreme values regardless of stimulus polarity. This suggests that similarly to what happens for arousal, “pleasant for them” does not necessarily translate into “(equally) pleasant for me”. Unpleasant vocal bursts were also rated with higher arousal scores across the two experimental conditions, consistently with existing data showing higher saliency of negative vocalizations (Holz et al., Citation2021; Parsons et al., Citation2014).
Lastly, we investigated whether the decoupling between arousal and (either negative or positive) valence can be explained by valence ambiguity (Mattek et al., Citation2017). It should be noted that the experimental question employed by Mattek and colleagues to collect arousal scores was the following: “Please rate the strength of your emotional response to the image”, followed by the presentation of emotional faces, pictures, and words (Mattek et al., Citation2017, supplementary materials, p. 29, emphasis ours). In our view, this likely prompts people to assume a CA perspective, in which participants focus on what the relevant stimulus evokes in them. By contrast, task instructions for valence rating read as follows: “Please rate how negative/positive this [stimulus] is” (p. 2, emphasis ours), which arguably taps onto PAQ. As a consequence, Mattek and colleagues (Citation2017) may not have adequately distinguished between subjective experience and emotion attribution, thus adding a possible confound in the relationship between arousal and valence. This worry is somehow mitigated by Brainerd (Citation2018), who shows that valence ambiguity is a parsimonious and reliable predictor of the degree of decoupling between arousal and valence in ratings of many extant databases, which relied on different operationalizations of arousal and valence. Our results dovetail with findings reported by Brainerd (Citation2018) and Mattek and colleagues (Citation2017): across the two studies, we show that vocal bursts characterised by higher between-participants variability in valence (i.e. more ambiguous sounds) also violate the V-shaped relationship to a greater extent and are rated higher in arousal. Interestingly, the association between ambiguity and arousal could be neither explained by the distribution of vocal bursts in valence nor by the interaction between ambiguity and valence. Further studies should be conducted to deepen the understanding of appraisal features of ambiguous stimuli.
Overall, the current work suggests that a stimulus’ average affective ratings in CA are not distant from their counterparts in PAQ, which may ease some worries about the practice of conflating the two conditions. However, caution is still advised. Indeed, as compared to PAQ judgments, ratings collected in CA are smaller in magnitude, more variable between participants and less reproducible between studies. Although these differences apply to both affective dimensions, they are more evident for arousal. Thus, researchers should verify that ratings obtained with PAQ-like questions are not interpreted as if they were related to CA (or vice versa). Also, one of the advantages of drawing the CA vs PAQ distinction with respect to ambiguity is that it may allow us to isolate different classes of stimuli. For instance, future work may explore potential differences between actually neutral states on the one hand – i.e. low (or high) arousal combined with intersubjective agreement – and ambivalent or ambiguous states on the other hand – i.e. high arousal combined with intersubjective disagreement. Further investigations on valence ratings focused on positive and negative affect might then contribute to disambiguate between ambivalent states (where positive and negative feelings co-occur) and ambiguous states (where subjects lack clarity about a stimulus’ hedonic value). In all these cases, the potential difference between conditions in which subjects rate stimuli with respect to what they evoke in them (CA) and conditions in which subjects rate how someone else might feel (PAQ) should be kept in mind when designing experimental tasks and when drawing inferences from their results.
Our work is not immune to criticism. The first limitation concerns our sample: both studies exclusively involved Italian speakers, thus limiting the generalizability of our findings to other cultures. Also, participants in study 1 came from a similar background, i.e. graduate students from a local university. Nonetheless, to increase sample heterogeneity, participants of Study 2 were recruited through advertising on social media.
Also, both our studies were conducted remotely. Participants were provided with an executable MATLAB programme (study 1) or Qualtrics survey (study 2), and this did not allow us to obtain full control over the experimental setting (e.g. volume, headphones). Yet, we carefully instructed participants of study 1 to ensure familiarity both with the use of software and the experiment design more generally. Furthermore, recent investigations pointed out the possibility of acquiring high-quality data even using online platforms and remote modalities (Buhrmester et al., Citation2015).
Another limitation depends on the nature of the stimuli, as some of them were acted while others were spontaneous (see Supplemental Material of Cowen et al., Citation2019). This may raise issues concerning the ecological validity of the stimuli since extant literature suggests that high-intensity real-life vocalizations are often rated as more ambiguous in terms of valence, while their arousal is judged more consistently (see Anikin et al., Citation2020; Atias et al., Citation2019).
Lastly, in the mixed-effect approach, we modelled participants’ responses using Normal and Poisson distributions. In this regard, although a zero-one-inflated Beta distribution might have represented a more suited solution, the MATLAB implementation of the generalised linear mixed-effects model does not offer such an option. Nevertheless, the adjusted R2 values obtained from Poisson and Normal mixed models were large (i.e. adjusted R2>0.26; Cohen, Citation2013), zero-inflation was properly accounted for by the Poisson distribution (see ), and residuals Q-Q plot did not show a substantial departure from normality.
SupplementaryMaterials.docx
Download MS Word (7.3 MB)Acknowledgments
L.C. and G.L. would like to thank Giacomo Handjaras for methodological suggestions and feedback. The authors would like to thank Erika Bucci and Valentina Formica for their help in the collection of study 2 data and Pia Campeggiani for her feedback and support. G.L. was supported by Marie Curie programme grant funding H2020, grant #101026032. V.P. was supported by Ministerio de Ciencia, Innovación y Universidades, postdoctoral fellowship IJC2020-043408-I; Agencia Estatal de Investigación, grant numbers: PID2021-122233OB-I00 and PID2021-128950OB-I00. L.C. was supported by IMT School for Advanced Studies Lucca, under Grant PAI (Progetti di Attività Integrata). M.V. was supported by the University of Bologna under the ALMACurie Fellow program.
Disclosure statement
No potential conflict of interest was reported by the author(s).
Additional information
Funding
References
- Anikin, A. (2020). The perceptual effects of manipulating nonlinear phenomena in synthetic nonverbal vocalizations. Bioacoustics, 29(2), 226–247. https://doi.org/10.1080/09524622.2019.1581839
- Anikin, A., Pisanski, K., & Reby, D. (2020). Do nonlinear vocal phenomena signal negative valence or high emotion intensity? Royal Society Open Science, 7(12), 201306. https://doi.org/10.1098/rsos.201306
- Atias, D., Todorov, A., Liraz, S., Eidinger, A., Dror, I., Maymon, Y., & Aviezer, H. (2019). Loud and unclear: Intense real-life vocalizations during affective situations are perceptually ambiguous and contextually malleable. Journal of Experimental Psychology: General, 148(10), 1842–1848. https://doi.org/10.1037/xge0000535
- Banse, R., & Scherer, K. R. (1996). Acoustic profiles in vocal emotion expression. Journal of Personality and Social Psychology, 70(3), 614–636. https://doi.org/10.1037/0022-3514.70.3.614
- Barrett, L. F., Khan, Z., Dy, J., & Brooks, D. (2018). Nature of emotion categories: Comment on cowen and keltner. Trends in Cognitive Sciences, 22(2), 97–99. https://doi.org/10.1016/j.tics.2017.12.004
- Belin, P., Fillion-Bilodeau, S., & Gosselin, F. (2008). The Montreal Affective Voices: a validated set of nonverbal affect bursts for research on auditory affective processing. Behavior Research Methods, 40(2), 531–539. https://doi.org/10.3758/BRM.40.2.531
- Brainerd, C. J. (2018). The emotional-ambiguity hypothesis: A large-scale test. Psychological Science, 29(10), 1706–1715. https://doi.org/10.1177/0956797618780353
- Bryant, G. A. (2021). The evolution of human vocal emotion. Emotion Review: Journal of the International Society for Research on Emotion, 13(1), 25–33. https://doi.org/10.1177/1754073920930791
- Bryant, G. A., & Aktipis, C. A. (2014). The animal nature of spontaneous human laughter. Evolution and Human Behavior, 35(4), 327–335. https://doi.org/10.1016/j.evolhumbehav.2014.03.003
- Buhrmester, M., Kwang, T., & Gosling, S. D.. (2015). Amazon's mechanical turk: A new source of inexpensive, yet high-quality, data?. Perspectives on Psychological Science: A Journal of the Association for Psychological Science, 6(1), 3–5. https://doi.org/10.1177/1745691610393980
- Cohen, J. (2013). Statistical power analysis for the behavioral sciences. Academic Press.
- Cordaro, D. T., Keltner, D., Tshering, S., Wangchuk, D., & Flynn, L. M. (2016). The voice conveys emotion in ten globalized cultures and one remote village in Bhutan. Emotion, 16(1), 117–128. https://doi.org/10.1037/emo0000100
- Cowen, A. S., Elfenbein, H. A., Laukka, P., & Keltner, D. (2019). Mapping 24 emotions conveyed by brief human vocalization. American Psychologist, 74(6), 698–712. https://doi.org/10.1037/amp0000399
- Filippi, P., Congdon, J. V., Hoang, J., Bowling, D. L., Reber, S. A., Pašukonis, A., … Güntürkün, O. (2017). Humans recognize emotional arousal in vocalizations across all classes of terrestrial vertebrates: evidence for acoustic universals. Proceedings of the Royal Society B: Biological Sciences, 284(1859), 20170990. https://doi.org/10.1098/rspb.2017.0990
- Frijda, N. H. (1986). The emotions. Cambridge University Press.
- Fritz, T., Mueller, K., Guha, A., Gouws, A., Levita, L., Andrews, T. J., & Slocombe, K. E. (2018). Human behavioural discrimination of human, chimpanzee and macaque affective vocalisations is reflected by the neural response in the superior temporal sulcus. Neuropsychologia, 111, 145–150. https://doi.org/10.1016/j.neuropsychologia.2018.01.026
- Goldie, P. (2002). Emotions, feelings and intentionality. Phenomenology and the Cognitive Sciences, 1(3), 235–254. https://doi.org/10.1023/A:1021306500055
- Green, R. S., & Cliff, N. (1975). Multidimensional comparisons of structures of vocally and facially expressed emotion. Perception & Psychophysics, 17(5), 429–438. https://doi.org/10.3758/BF03203289
- Holz, N., Larrouy-Maestri, P., & Poeppel, D. (2021). The paradoxical role of emotional intensity in the perception of vocal affect. Scientific Reports, 11(1), 9663. https://doi.org/10.1038/s41598-021-88431-0
- Itkes, O., Kimchi, R., Haj-Ali, H., Shapiro, A., & Kron, A. (2017). Dissociating affective and semantic valence. Journal of Experimental Psychology: General, 146(7), 924–942. https://doi.org/10.1037/xge0000291
- Itkes, O., & Kron, A. (2019). Affective and semantic representations of valence: A conceptual framework. Emotion Review, 11(4), 283–293. https://doi.org/10.1177/1754073919868759
- Kragel, P. A., & LaBar, K. S. (2015). Multivariate neural biomarkers of emotional states are categorically distinct. Social Cognitive and Affective Neuroscience, 10(11), 1437–1448. https://doi.org/10.1093/scan/nsv032
- Kuppens, P., Tuerlinckx, F., Russell, J. A., & Barrett, L. F. (2013). The relation between valence and arousal in subjective experience. Psychological Bulletin, 139(4), 917–940. https://doi.org/10.1037/a0030811
- Kuppens, P., Tuerlinckx, F., Yik, M., Koval, P., Coosemans, J., Zeng, K. J., & Russell, J. A. (2017). The relation between valence and arousal in subjective experience varies with personality and culture. Journal of Personality, 85(4), 530–542. https://doi.org/10.1111/jopy.12258
- Kurdi, B., Lozano, S., & Banaji, M. R. (2017). Introducing the open affective standardized image set (OASIS). Behavior Research Methods, 49(2), 457–470. https://doi.org/10.3758/s13428-016-0715-3
- Lang, P. J., Bradley, M. M., & Cuthbert, B. N.. (2008). International affective picture system (IAPS): Affective ratings of pictures and instruction manual. Technical Report A-8. University of Florida, Gainesville, FL.
- Laukka, P., Elfenbein, H. A., Söder, N., Nordström, H., Althoff, J., Iraki, F. K. E., … Thingujam, N. S. (2013). Cross-cultural decoding of positive and negative non-linguistic emotion vocalizations. Frontiers in Psychology, 4, 353. https://doi.org/10.3389/fpsyg.2013.00353
- Laukka, P., Juslin, P., & Bresin, R. (2005). A dimensional approach to vocal expression of emotion. Cognition & Emotion, 19(5), 633–653. https://doi.org/10.1080/02699930441000445
- Lima, C. F., Castro, S. L., & Scott, S. K. (2013). When voices get emotional: A corpus of nonverbal vocalizations for research on emotion processing. Behavior Research Methods, 45(4), 1234–1245. https://doi.org/10.3758/s13428-013-0324-3
- Mattek, A. M., Wolford, G. L., & Whalen, P. J. (2017). A mathematical model captures the structure of subjective affect. Perspectives on Psychological Science, 12(3), 508–526. https://doi.org/10.1177/1745691616685863
- Olteanu, L., Golani, S., Eitam, B., & Kron, A. (2019). The effect of relevance appraisal on the emotional response. Emotion, 19(4), 715–725. https://doi.org/10.1037/emo0000473
- Parsons, C. E., Young, K. S., Craske, M. G., Stein, A. L., & Kringelbach, M. L. (2014). Introducing the Oxford Vocal (OxVoc) Sounds database: A validated set of non-acted affective sounds from human infants, adults, and domestic animals. Frontiers in Psychology, 5, 562. https://doi.org/10.3389/fpsyg.2014.00562
- Petrolini, V., & Viola, M. (2020). Core affect dynamics: arousal as a modulator of valence. Review of Philosophy and Psychology, 11(4), 783–801. https://doi.org/10.1007/s13164-020-00474-w
- Prather, J. F., Nowicki, S., Anderson, R. C., Peters, S., & Mooney, R. (2009). Neural correlates of categorical perception in learned vocal communication. Nature Neuroscience, 12(2), 221–228. https://doi.org/10.1038/nn.2246
- Russell, J. A. (1980). A circumplex model of affect. Journal of Personality and Social Psychology, 39(6), 1161–1178. https://doi.org/10.1037/h0077714
- Russell, J. A. (2003). Core affect and the psychological construction of emotion. Psychological Review, 110(1), 145–172. https://doi.org/10.1037/0033-295X.110.1.145
- Russell, J. A. (2017). Mixed emotions viewed from the psychological constructionist perspective. Emotion Review, 9(2), 111–117. https://doi.org/10.1177/1754073916639658
- Russell, J. A., & Barrett, L. F. (1999). Core affect, prototypical emotional episodes, and other things called emotion: dissecting the elephant. Journal of Personality and Social Psychology, 76(5), 805–819. https://doi.org/10.1037/0022-3514.76.5.805
- Russell, J. A., & Carroll, J. M. (1999). On the bipolarity of positive and negative affect. Psychological Bulletin, 125(1), 3–30. https://doi.org/10.1037/0033-2909.125.1.3
- Sauter, D. A., Eisner, F., Calder, A. J., & Scott, S. K. (2010a). Perceptual cues in nonverbal vocal expressions of emotion. Quarterly Journal of Experimental Psychology, 63(11), 2251–2272. https://doi.org/10.1080/17470211003721642
- Sauter, D. A., Eisner, F., Ekman, P., & Scott, S. K. (2010b). Cross-cultural recognition of basic emotions through nonverbal emotional vocalizations. Proceedings of the National Academy of Sciences, 107(6), 2408–2412. https://doi.org/10.1073/pnas.0908239106
- Simon-Thomas, E. R., Keltner, D. J., Sauter, D., Sinicropi-Yao, L., & Abramson, A. (2009). The voice conveys specific emotions: evidence from vocal burst displays. Emotion, 9(6), 838–846. https://doi.org/10.1037/a0017810
- Smith, P. L., & Little, D. R. (2018). Small is beautiful: In defense of the small-N design. Psychonomic Bulletin & Review, 25(6), 2083–2101. https://doi.org/10.3758/s13423-018-1451-8
- Snowdon, C. T. (2003). Expression of emotion in nonhuman animals. In R. J. Davidson, K. R. Scherer, & H. H. Goldsmith (Eds.), Series in affective science. Handbook of affective sciences (pp. 457–480). Oxford University Press.
- Toet, A., Eijsman, S., Liu, Y., Donker, S., Kaneko, D., Brouwer, A. M., & van Erp, J. B. (2020). The relation between valence and arousal in subjective odor experience. Chemosensory Perception, 13(2), 141–151. https://doi.org/10.1007/s12078-019-09275-7
- Wilson-Mendenhall, C. D., Barrett, L. F., Simmons, W. K., & Barsalou, L. W. (2011). Grounding emotion in situated conceptualization. Neuropsychologia, 49(5), 1105–1127. https://doi.org/10.1016/j.neuropsychologia.2010.12.032
- Yang, W., Makita, K., Nakao, T., Kanayama, N., Machizawa, M. G., Sasaoka, T., … Miyatani, M. (2018). Affective auditory stimulus database: An expanded version of the International Affective Digitized Sounds (IADS-E). Behavior Research Methods, 50(4), 1415–1429. https://doi.org/10.3758/s13428-018-1027-6
- Zachar, P., & Ellis, R. D. (eds.). (2012). Categorical versus dimensional models of affect: a seminar on the theories of Panksepp and Russell. John Benjamins Publishing.