
 ?Mathematical formulae have been encoded as MathML and are displayed in this HTML version using MathJax in order to improve their display. Uncheck the box to turn MathJax off. This feature requires Javascript. Click on a formula to zoom.
ABSTRACT
The Musical Emotion Discrimination Task (MEDT) is a short, non-adaptive test of the ability to discriminate emotions in music. Test-takers hear two performances of the same melody, both played by the same performer but each trying to communicate a different basic emotion, and are asked to determine which one is “happier”, for example. The goal of the current study was to construct a new version of the MEDT using a larger set of shorter, more diverse music clips and an adaptive framework to expand the ability range for which the test can deliver measurements. The first study analysed responses from a large sample of participants (N = 624) to determine how musical features contributed to item difficulty, which resulted in a quantitative model of musical emotion discrimination ability rooted in Item Response Theory (IRT). This model informed the construction of the adaptive MEDT. A second study contributed preliminary evidence for the validity and reliability of the adaptive MEDT, and demonstrated that the new version of the test is suitable for a wider range of abilities. This paper therefore presents the first adaptive musical emotion discrimination test, a new resource for investigating emotion processing which is freely available for research use.
Over the last few decades research in music psychology has attempted to delineate the mechanisms that enable music listeners to perceive emotions in music (Eerola, Citation2018). During this time many psychometric tests have been developed to investigate the perception of musical emotions, most requiring test-takers to rate music using emotion labels (e.g. Hill & Palmer, Citation2010; Paquette et al., Citation2013) or rating scales of affect with ordered response options (e.g.Lepping et al., Citation2016; Belfi & Kacirek, Citation2021; Imbir & Gołąb, Citation2017). Using these tools researchers have explored the individual differences which may contribute to advantages in the decoding of emotional content in music (e.g. in musical training: Akkermans et al., Citation2019; Battcock & Schutz, Citation2022 Castro & Lima, Citation2014 personality: Ruth et al., Citation2020; Taruffi et al., Citation2017; or auditory perceptual abilities: MacGregor & Müllensiefen, Citation2019), and investigated the contribution of general emotional abilities to the processing of musical emotions (e.g. emotional intelligence: Resnicow et al., Citation2004, or emotional contagion: Akkermans et al., Citation2019). Despite advances in these areas we are yet to fully understand how the processing of emotions in music is linked to the processing of emotions presented in other modalities via general emotion mechanisms (Correia et al., Citation2022; Lima et al., Citation2016), or understand how other domain-general cognitive mechanisms might influence this relationship (Battcock & Schutz, Citation2022). Questions also remain concerning the impact of emotional disorders such as alexithymia (Taruffi et al., Citation2017), music-related disorders such as amusia (Lima et al., Citation2016) and developmental disorders which may influence emotion perception, such as Autism (Leung et al., Citation2022). The following describes the development of the adaptive MEDT (aMEDT): an open-access tool which aims to equip researchers with a new, reliable and effective method of studying music perception to help address these outstanding questions.
The aMEDT has been developed based on the static MEDT (sMEDT; MacGregor & Müllensiefen, Citation2019), but includes a larger, more diverse stimulus set which makes the test suitable for assessing a greater range of ability levels and an adaptive framework which confers several advantages including increased efficiency and accuracy. In addition, the new explanatory item response model used to build the adaptive task relates perceptual processing difficulty to features of the item stimuli. Hence, the model also contributes empirical evidence to the literature of human emotion perception. The following will describe a processing model of emotions in music and discuss specific areas where our understanding of emotion perception in music could be improved before outlining the key objectives for the current research.
Processing of emotions in music
The type of emotion perceived or induced in a listener depends upon a performer’s manipulation of acoustic cues used to communicate expressive intentions (Gabrielsson, Citation1995; Juslin, Citation2000). These acoustic cues include variations of pitch, intensity, temporal events and timbre (Juslin & Laukka, Citation2003). Juslin (Citation2000) reports an experiment where performers were asked to communicate different emotions, and listeners were asked to decode their intentions with reference to discrete emotion categories. Clips that listeners grouped together by emotion category were analysed to detect similarities in musical features. Results showed that certain combinations of acoustic cues could be related directly to basic emotion categories (Ekman, Citation1984); happy music was typically performed in a fast tempo and major key with staccato articulation, for example. Another study digitally manipulated the emotional expression of music excerpts using typical acoustic cues of emotion, and found that listeners could accurately decode the synthesised expression (Bresin & Friberg, Citation1999). Juslin (Citation2000) suggested that the consistency of acoustic profiles of basic emotions exhibited in these studies could be partially explained via similarities between cues utilised to communicate emotion via affective vocalisations and those utilised by performers in music. The existence of shared expressive cues is well established (Coutinho & Dibben, Citation2013), and points towards the involvement of general emotion processing mechanisms which are responsible for informing musical emotional judgements as well as the perception of emotion in speech prosody (Bowman, Citation2015).
In a previous paper, we proposed a cognitive model of emotion processing to facilitate the exploration of processes underlying the perception of emotions in music (see MacGregor & Müllensiefen, Citation2019). Our model outlined the hypothesised contributions of general emotion processing mechanisms and cognitive frameworks to musical emotion decoding (see ). The following explains how the model was informed by previous literature and highlights areas where further research would be most valuable. Effects of individual differences in emotional intelligence and emotional music skills will not be covered here, as evidence for their influence on auditory emotion perception is fairly strong (Akkermans et al., Citation2019; Resnicow et al., Citation2004; Trimmer & Cuddy, Citation2008). For further detail on these effects, refer to our previous paper, where the model is outlined in full (MacGregor & Müllensiefen, Citation2019).
Figure 1. Diagram to illustrate our cognitive model of emotion recognition in music. Note. Reprinted from MacGregor and Müllensiefen (Citation2019). Grey rectangles indicate covert processes that cannot easily be directly measured or controlled, while the grey parallelograms represent readily observable processes. The contribution of individual differences in various latent variables are represented by yellow circles, and purple diamonds represent underlying cognitive mechanisms.
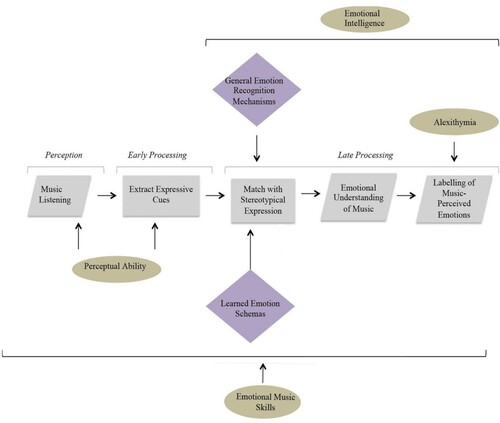
First, perception of a sound triggers the early processing of the signal, which involves extraction of cues that can potentially convey expressive and emotional contents such as intensity, rate or pitch height (Ilie & Thompson, Citation2006). Participants on average showed greater difficulty in decoding shorter excerpts with fewer expressive cues (MacGregor & Müllensiefen, Citation2019), indicating that generally, the greater the number of acoustic cues, the more accurate a listener is likely to be in perceiving the emotional content of the presented stimulus.
Individual differences in perceptual ability are likely to have impact at this early processing stage; for example, there is evidence that congenital amusia, a disorder characterised by impairments in pitch processing (Foxton et al., Citation2004), is associated with parallel impairments in processing emotions in music (Zhou et al., Citation2019). Research further suggests that pitch perception could also impact socio-emotional cognition on a wider scale, with impairments shown to contribute not only to difficulties in recognising expression in other domains, such as judging the authenticity of someone’s laugh, but also to difficulties processing facial expressions (Lima et al., Citation2016). These results require further scrutiny on account of contrasting findings that demonstrate intact musical emotion processing in amusics (Gosselin et al., Citation2007), hence why amusia has not been included in the current model. However, these findings may signify an intriguing relationship between perceptual abilities and emotional processes that could be disentangled through further research into musical emotion perception.
Following perception of the stimulus and extraction of expressive cues, late processing combines acoustic cues to be compared and matched with cognitive representations of stereotypical expressions of emotion to facilitate an understanding of the emotional content of the sound.
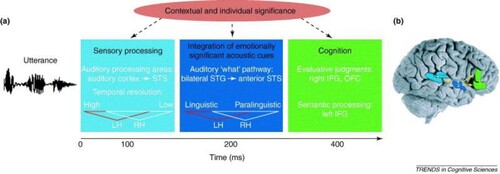
The process of combining different sensory signals to aid comprehension of the emotional significance of a stimulus has been observed in the area of emotion processing with speech prosody (see taken from Kotz & Paulmann, Citation2011; Schirmer & Kotz, Citation2006), which informs the current model on account of previous evidence that demonstrates an overlap between systems responsible for the processing of emotion in music and speech (Juslin & Västfjäll, Citation2008; Peretz et al., Citation2015; Slevc, Citation2008). As pointed out above, it is thought that shared processing of auditory emotion signals is possible in part due to acoustic cues of emotion that are common to both speech and music (Coutinho & Dibben, Citation2013; Ilie & Thompson, Citation2006; Scherer, Citation1995, Citation2004) which appear to permit reliable emotion discrimination in listeners (Akkermans et al., Citation2019; MacGregor & Müllensiefen, Citation2019; Trimmer & Cuddy, Citation2008). There is, in fact, evidence to suggest that those better able to perceive music, either naturally or as a result of musical training, are better equipped to recognise emotions in speech prosody (Correia et al., Citation2022). Such evidence substantiates the role of shared mechanisms in the processing of music and speech (Patel, Citation2007; Patel, Citation2012).
Figure 2. A model outlining the processing of emotions in speech prosody. Note. Reprinted with permission from Schirmer and Kotz (Citation2006). The first box on the left represents the earliest stage of processing (0–100 ms), which recruits auditory perceptual systems. The next stage of processing (200 ms) involves integration of acoustic cues of emotion from speech prosody. The third stage (400 ms) permits an understanding of the stimulus via the engagement of higher cognitive processes. A similar process is hypothesised to underlie the processing of emotion in music.
It is unclear how and whether the function of these shared mechanisms may extend to the processing of emotions presented in other non-auditory modalities, such as visual or facial recognition of emotions, however. While Correia et al. (Citation2022) found no link between music perception skills, assessed using beat, melody, pitch and duration discrimination tasks, and facial emotion recognition, Lima et al. (Citation2016) demonstrated deficits in facial recognition associated with impaired pitch processing. These contrasting outcomes emphasise the need for a better understanding of cross-modal emotion perception, which can be achieved through further investigation into the function of general emotion recognition systems.
The final stage of processing in our model of emotion recognition in music involves the categorisation and labelling of perceived emotions. Categorisation necessitates the formation of a cognitive representation of the music-perceived emotion based on the information derived from previous steps. Schirmer’s component process model (Citation2006) converges with ours in the positioning of this process at the final stage (see ), where higher cognitive processes intervene to produce an evaluation of the emotional stimulus. Alexithymia is expected to have an influence at this late stage of processing, owing to related difficulties in describing and identifying emotions. Previous research has highlighted a deficit in individuals affected by alexithymia that is specific to the processing of emotion in music (Taruffi et al., Citation2017), though our previous study found no relationship between self-reported alexithymia and emotion discrimination ability (MacGregor & Müllensiefen, Citation2019). Further examination, as carried out in the following study, is thus required to elucidate this link.
sMEDT
Current research follows on from the development of the sMEDT (MacGregor & Müllensiefen, Citation2019): a short, two-alternative forced choice (2-AFC), 18 item test of musical emotion discrimination which was presented with the aim of providing a freely accessible measure of musical emotional ability that could be used to investigate individual differences in this area. The test combines the comparison paradigm outlined above with a test designed by Gabrielsson and Juslin (Citation1996) in which a listener decodes the emotional intentions of a performer. In our study, participants listened to pairs of pre-recorded performances of the same melody played with alternative basic emotional expressions (angry, happy, sad, tender) and were asked to determine which of the two sounded “happier”, for example. This use of comparative judgements promoted ecological validity firstly because it more closely mimicked the typical process of music listening, where emotions typically evolve over time (Koelsch, Citation2005), and secondly because it permitted scoring based on the agreement between a performer and listener, thus imitating the communication of emotion which would occur in the context of a natural music performance (Gabrielsson & Juslin, Citation1996).
Recent studies have demonstrated the psychometric properties of the sMEDT and exhibited the value of its application in emotion research. Pausch et al. (Citation2021) employed the German version of the sMEDT in a recent study (n = 699). They reported that variance in sMEDT score contributed to a general factor of musicality alongside measures of beat, intonation and melody perception, thus demonstrating construct validity. The test performed with an acceptable level of test-retest reliability in this sample (r = .69). Another investigation (Ruth et al., Citation2020) found that sMEDT scores were related to personality, with “Openness” scores from the Big-Five Inventory (Gosling et al., Citation2003) predicting some of the variance in performance. Though results are yet to be published, the sMEDT is also currently being employed in the investigation of emotion perception in patients with Frontotemporal Dementia and Alzheimer’s disease as a follow up to a meta-analysis conducted by van’t Hooft et al., (Citation2021), as well as contributing to a battery of music perception tests that are currently employed in secondary schools as part of the Long-Gold Project (https://longgold.org/), a longitudinal project that investigates the development of musical skills alongside other important developmental factors such as cognitive, academic and social abilities (Müllensiefen, Harrison, Caprini & Fancourt, Citation2015).
Despite providing evidence for its psychometric properties, use of the sMEDT has also revealed ceiling effects (Rödel, Citation2021) which can be attributed to the set number of items and limited variability in item difficulty. Studies have therefore shown that the non-adaptive test is inadequate for distinguishing between individuals of higher ability.
Research aims
The current research aims to address previous issues by developing a new, adaptive version of the sMEDT, which will include a larger set of more diverse stimuli featuring a greater range of instruments, melodies, and emotions than the previous test. Through developing this broader stimulus set, we aim to increase the difficulty range of the test items. Excerpts will also be made shorter, on account of previous findings indicating that short clips were more difficult to decipher (MacGregor & Müllensiefen, Citation2019), a result attributed to the reduced number of acoustic cues which are typically relied on for recognition. Once items are produced they will be assessed by a large and heterogeneous sample of participants, and ratings of item difficulty will be calculated as part of a quantitative model to produce a new, adaptive version of the MEDT grounded in IRT.
Item response theory
Item response theory is a method of test development which is considered an alternative to classical test theory (Baker & Kim, Citation2017). The differences between the two approaches will be outlined to illustrate why IRT has been chosen to boost the psychometric properties of the MEDT.
Classical test theory (CTT) aims to measure a latent trait by taking a total score from responses to a fixed set of items. Development of this fixed-item test involves gathering data from a large sample to ensure the test doesn’t exhibit ceiling or floor effects. Items produced using a CTT approach are generally considered to be equivalent in weight and only the total test score is relevant for measurement. In contrast to CTT, IRT is based on a model which estimates the difficulty of each item, and this difficulty information is used to construct an adaptive test suited to an individual test-taker’s ability. The use of different test items for different participants allows for an ability estimate which is independent from bias that could be introduced by particular items or samples using the CTT approach (Baker & Kim, Citation2017).
With adaptive testing, the selection of an item relies on estimates of test-taker ability that are updated for each trial based on response accuracy. Correct responses contribute to an increase in estimated ability, and subsequent presentation of more difficult items, while incorrect responses lead to a decrease in estimated ability, and easier items. This means items that are too easy or too difficult for an individual are avoided, saving time during the test session, preventing frustration on the part of the individual taking part, increasing the information gathered on each trial and therefore ultimately strengthening the accuracy of the measurement tool. Adaptive tests additionally allow administrators to specify the number of items presented to a test-taker, so they can adhere to time constraints within their own experiments and weigh up test duration against test length and measurement error in a principled way. The advantages of an adaptive framework are numerous, but in short, this approach facilitates the development of a shorter, more effective and more versatile test.
Summary
In sum, key research aims of the current study are (a) to develop a large, diverse set of items for the investigation of musical emotion discrimination ability, (b) use these items to construct a quantitative model of musical emotion discrimination ability, and (c) utilise this model to build the first adaptive test for the measurement of musical emotion discrimination.
Study 1
Method
Participants
The participant sample was sourced from different populations. One part of the sample was recruited among undergraduate psychology students from Goldsmiths, University of London, who were compensated with course credits through a research participation scheme (n = 232). After removing participants who completed less than 50% of the test n = 176 remained (145 female, aged 18–56 (M = 20.3, SD = 5.1), with 4 who provided no demographic information). Another part of the sample (n = 511) was gathered via SoundOut, an online market research platform. Of the 511, there were 447 participants who completed more than 50% of the test (245 female, aged between 18–69 (M = 28.7, SD = 9.6), 25 with no demographic information). SoundOut participants were reimbursed for their time with monetary compensation. The final sample therefore consisted of 623 participants who completed more than 50% of the test (390 female, aged 18–69 (M = 26.31, SD = 9.33), 29 with no demographic information collected). The study was granted ethical approval by the Goldsmiths, University of London Ethics Committee.
Materials
Items were constructed using a set of 82 clips taken from performances that were recorded as part of a replication study conducted by Akkermans et al. (Citation2019) based on melodies included in a study by Gabrielsson and Juslin (Citation1996), which investigated the communication of emotions in music performance. Melodies A, B and C from Gabrielsson and Juslin’s (Citation1996) study (hereafter referred to as 1,2 and 3, respectively) were therefore used (see Figures A1, A2 and A3 in Appendix A for notation). In the original study, melodies were chosen on the condition that they represent different genres and “varying emotional characters” (Gabrielsson & Juslin, Citation1996); this refers to structural elements of the music which may contribute to emotional content, such as modality. In accordance with the original study, the recorded melodies were either sung, or played on the flute, piano or violin (Akkermans et al., Citation2019). Recordings where the performer was trying to express anger, fear, happiness, sadness or tenderness were first selected for use in the current study, as these expressions were the most accurately identified by participants according to Akkermans et al. (Citation2019) (“solemn” and “no expression” extracts were excluded). Then, only recordings featuring melodies/instrument/emotion combinations for which participants rated the target emotion expression (i.e. in agreement with the emotional intentions of the performer) of the excerpt most highly, compared with all other emotion options, were included. See Tables B1 and B2 in appendix B for the melody/emotion/instrument combinations that were included, as well as the mean rating of the target emotion for each performance taken from Akkermans et al. (Citation2019).
Recordings were edited into sets of musical phrases that consisted of at least two notes. Melody 1 was split into 7 single-bar phrases, with the up-beat included in the first phrase, melody 2 was split into 8 two-bar phrases and melody 3 was split into 10 single-bar phrases, to include only the first 10 bars. Audacity was used to split audio files and fade in/fade out effects were applied to make the extracts sound natural. This produced 265 clips that were between 1-7s in length (M = 1.96, SD = 1.12); these were combined into all possible pairs with matching melody, instrument and phrase, on the condition that they featured contrasting target emotions. Sound exchange (SoX) softwareFootnote1 was used to combine each pair of clips, with a beep sound placed in-between to ensure a distinct separation. This resulted in 570 audio clips which were to be used as test items.
The items were uploaded to Qualtrics, an online survey platform, along with task instructions and two self-report measures from the Gold-MSI (Müllensiefen et al., Citation2014), a well-established measure of musical sophistication with good psychometric properties. This inventory used 7-point likert scales to assess emotional engagement with music and musical training. The Gold-MSI “Emotions” scale is a short, 5-item measure of sophisticated emotional engagement with music, which asks respondents to evaluate their level of agreement with statements such as “I am able to talk about the emotions that a piece of music evokes for me”. The “Musical Training” scale is a 7-item assessment which measures previous experience of formal musical training, with questions regarding time spent learning an instrument, time spent practicing, number of instruments an individual can play, and agreement with backwards-scored statements such as “I have never been complimented for my talents as a musical performer”. The Gold-MSI measures were included as a preliminary assessment of test validity, as the perception of emotion in music has previously been associated with individual differences in these other musical abilities (MacGregor & Müllensiefen, Citation2019).
Procedure
Undergraduate participants completed the study in a lecture hall with their own headphones and portable devices. They accessed the Qualtrics survey via a weblink and were presented first with an information sheet and consent form before starting the emotion discrimination task. Once they had read the task instructions, they were instructed to “Listen to the following clips and select which one sounds most (angry/happy/fearful/sad/tender) to you. Select one for the clip heard before the beep, or 2 for the clip heard after the beep”. There was no time limit, and they were able to listen to the clips as many times as they wished. They completed 41 2-AFC items, randomly selected from the pool of 570, before moving on to the Gold-MSI emotions and musical training self-report scales. A test length of 41 items was chosen to ensure that the study fit within students’ assigned lecture time, taking around 20 minutes to complete. Following the test and questionnaires, students entered their demographic information and student number, and were presented with a debrief form.
Online participants accessed the test via SoundOut, and followed the same procedure as the undergraduates, except that they were only presented with 24 randomly selected items and completed only the emotions subtest of the Gold-MSI. Fewer items were presented to this sample to ensure the experiment was of a similar duration to other surveys presented on the SoundOut platform (5-10 minutes), thus ensuring potential participants wouldn’t be discouraged from taking part.
Results
Data screening
Prior to analysis, the dataset (N = 742) was screened for participants who gave more than 95% constant responses (n = 0) or responded to <50% of items (n = 118). Data from 624 participants remained after screening and thus were included in the analysis.
Item response accuracy
The first stage of analysis aimed to inform the exclusion of items where performance was close to or below 50% accuracy when averaged across the participant sample. In addition, this stage aimed to identify and remove items for which correct responses were selected 100% of the time (n = 7), on account of their low discriminatory power. This formal item check contributed to the validity of the items included at the next stage of testing, ensuring that participants in the current sample were able to accurately perceive the target emotion in the clip and select the correct response. Importantly, this meant that correct responses to items included at the next stage would be determined not only by the intentions of the performer and their expressive cues, but also by the successful communication of emotion from performer to listener as corroborated by the majority vote of the current sample.
In order to eliminate any items that performed at chance level (close to 50% accuracy) or below, across the full participant sample, a mixed effects model classification tree (see Figure C1 in Appendix C) was constructed using the “glmertree” package (Fokkema et al., Citation2018) from the statistical programming software R. This statistical model allows for the investigation of interactions between variables that contribute to the prediction of a certain outcome. The current model was used to investigate where interactions between item features, specifically, emotional content, instrument and melody, contributed to a low response accuracy.
The classification tree (Figure C1 in Appendix C) outlined specific combinations of features that were making items easier or harder, and highlighted some combinations which resulted in chance level performance in this sample. Five nodes representing combinations of item features associated with chance level performance were identified by visual inspection. Binomial testing was carried out to assess whether performance on items with these identified feature combinations was significantly different from chance. Of these five nodes, three were flagged as contributing to performance that was not significantly greater than chance level (p > .05). The item combinations associated with these three nodes are outlined in . Data for items with combinations at chance level (n = 45) were subsequently removed from the dataset, leaving 523 of the original set (N = 568).
Table 1. Combinations of item variables that contributed to low accuracy.
Next, we produced a model to estimate item difficulty by predicting response accuracy based on emotions, instruments and melodies featured. Item difficulty estimates are necessary for the generation of sequences of items based on participant ability which is central to adaptive testing.
A Bayesian mixed effects model, equivalent to an explanatory item response model (De Boeck et al., Citation2011), was fit to the experimental data via the R package “brms” (Bürkner, Citation2021) to extract item parameters. This was a generalised linear model with a binomial link function. Modelling assessed the contribution of instrument, melody and “emotion combination” (i.e. a new variable combining target and comparison emotion into a single categorical variable) to the binary response variable (0 representing an incorrect response where the clip chosen was not representative of the emotion the performer intended, 1 representing a correct response where the clip with the target emotion was chosen). Bayesian mixed effects modelling was used with priors set for the linear combination of the categorical predictors. These were normally distributed (µ = 0, σ = 1). The prior on the residuals defaulted to a student’s t distribution (df = 3, µ = 0, σ = 2.5). Guessing (beta µ = 1, σ = 1, lower/upper bound = 0.4/0.6) and inattention (beta µ = 1, σ = 1, lower/upper bound = 0/0.1) parameters were also included. The final model indicated that item features of emotion combination, melody and instrument contributed to predicting the correctness of participant responses (Bayesian R2 = .22, 95% CI [.21-.22], accuracy = 76%). Posterior distributions were visually inspected to check model convergence for all parameter levels, which was further confirmed by values of 1.00 across all parameters. The posterior distribution was also checked against predictive samples to ensure reasonable model fit. Sensitivity analyses confirmed that the model wasn’t overly sensitive to set priors (see Figure D1 in Appendix D).
Items featuring the emotion combination of sad/tender were most difficult, while items with the combination of sad/angry were easiest. Piano, violin and voice items all generated more correct responses than flute items, with voice proving easiest and most reliably identified. Melody 3 was modelled as producing more incorrect responses than melodies 1 and 2. See for an outline of parameter estimates, which illustrate how item features contribute to item easiness where positive values are associated with easier items and associated bounds of the credible interval (CI). For an outline of the contribution of different item features to participant response accuracy at each parameter level, refer to and .
Figure 3. Visualisation of the contributions of the item features emotion combination, instrument and melody to response accuracy at each parameter level. Note. For each of the emotion combination parameters in graph A, the former emotion is the target emotion and the latter the comparison emotion. Error bars represent the lower and upper confidence interval.
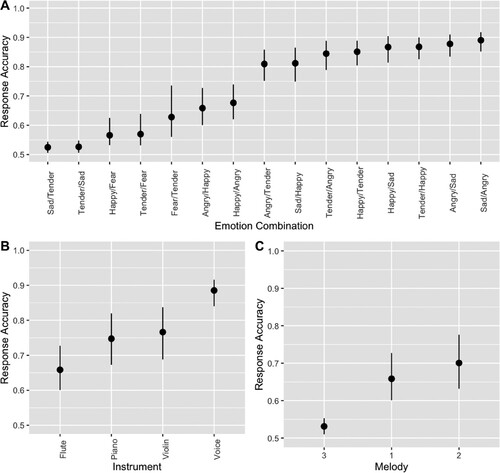
Table 2. Parameter estimates from the Bayesian mixed effects model.
Table 3. Contributions of item features to response accuracy at each parameter level.
Random effects for participants were extracted from the mixed effects model (range = −6.42–4.22, M = −.07, SD = 2.63, N = 624), and Pearson’s correlation coefficients were calculated to assess the relationship between model-based performance on the emotion discrimination task and participants’ self-reported emotional engagement with music (M = 33.5, SD = 4.88, N = 592), measured using the Gold-MSI emotions subscale. This resulted in a correlation with weak to medium effect size (r = .36, p < .001). Musical training was also investigated in the undergraduate sample using the Gold-MSI self-report scale (M = 18.44, SD = 8.82, N = 156), though it was not correlated with predicted performance (r = .02, p = .8).
Item parameters were also extracted. Item difficulty estimates ranged between −1.44 and 1.72 (M = −.32, SD = .75), roughly aligning with the distribution of participant ability estimates reported above, while discrimination was estimated at 3.07. This discrimination value is favourable according to the literature (Hays et al., Citation2000), which states typical values range from 0.5–2 with higher values demonstrating better discrimination. The guessing parameter was at 0.5, and the inattention parameter at 0.06. These parameters were used to construct the new, adaptive version of the MEDT (see Harrison et al., Citation2017 and Harrison & Müllensiefen, Citation2018 for more information on building adaptive tests from explanatory item response models).
Discussion
The goal of study 1 was to establish a model of musical emotion discrimination ability which could be used to create an adaptive test of decoding ability. A suitable model emerged that permitted the estimation of item difficulty and discrimination based on the musical features of an item (i.e. instrument, intended emotions and melody). This model was used as the basis for the new, adaptive test.
Analyses also revealed that vocal excerpts were the most expressive, particularly in comparison to the flute. It is possible that this could reflect participants’ previous listening experience, if they are familiar with the process of to listening to and decoding vocal expression in music, for example, though it could also reflect a greater expressive range of the voice, or perhaps a greater similarity between acoustic cues of expression in singing and vocal prosody as compared with other instruments. It’s important to bear in mind that the limited item pool in the current study means more evidence is required to substantiate this claim, however. As there was only one performer playing each instrument it was not possible to control for the mediating effect of individual performer ability, or their ability to communicate an emotion to a listener by playing their instrument.
Poor discrimination of flute items could also be partially explained by effects on the instrument variable introduced by performer ability. The recordings of the items were borrowed from a study by Akkermans et al. (Citation2019), who also found that performer-intended expression was difficult to identify for flute excerpts. Despite trying to mitigate this issue by including only excerpts where participants in Akkermans et al. (Citation2019) study had rated the target emotion most highly, resulting in very few items featuring flute overall (see Figure E1 in Appendix E), the flute items have still proven most difficult to discriminate in the current study. This example highlights the importance of mitigating the mediating effects of performer ability by including a greater number of performers per instrument in future studies.
The effects of performer-intended emotions, whether presented as a target or comparison, were also difficult to disentangle due to the possible influence of intrinsic structural elements of the three melodies, such as a major tonality, which will have had an influence on perceived expression. Although this impacts ecological validity (for further discussion see MacGregor & Müllensiefen, Citation2019), it should otherwise have had minimal impact on the efficacy of the current test. Though certain extracts would have been more difficult to discriminate, owing to the original melodies having more powerful structural indicators of emotion, the presentation of clips in pairs, with different performances of the same melody, ensured that structural effects of melody were controlled for, and therefore that emotion judgements were guided by performer expression as opposed to melodic structure.
Final stages of the study 1 analysis revealed a correlation between model-based estimates of participant ability and self-reported emotional engagement with music, thus providing a useful indication that the items selected by the model should contribute to a valid measure of emotion decoding ability.
Study 2
A second study was carried out to establish the validity and reliability of the new adaptive test. The same measures as used in the validation study for the first MEDT (MacGregor & Müllensiefen, Citation2019) were employed. These included facial and vocal emotion recognition tests as well as self-report inventories of musical expertise and alexithymia.
Method
Participants
This study was completed by 93 participants (63 female), who were mostly first year Psychology students at Goldsmiths, University of London participating for course credit. The sample ranged from 18 to 79 years of age (M = 23.33, SD = 9.98).
Materials
The new, adaptive version of the aMEDT was employed for this study. There were a total of 537 items which formed the item bank for the adaptive test. For a summary of item characteristics see Figure E1 in Appendix E.
In addition to the aMEDT we administered the same measures used in the validation study of the sMEDT (MacGregor & Müllensiefen, Citation2019), in order to maintain consistency and facilitate the evaluation of the two measures against each other.
Emotion recognition tests
As well as the aMEDT and the sMEDT, participants completed the Emotion Recognition Index (ERI: Scherer & Scherer, Citation2011) that assesses the ability to recognise non-musical auditory (vocal) and visual (facial) expressions of emotion using a test paradigm where participants matched basic emotion labels to pictures and voice recordings. This test was included to assess the extent of overlap within the processes involved in recognising emotions presented in different modalities.
Questionnaires
Participants were also asked to fill in several self-report inventories. All five subscales of the Gold-MSI (Müllensiefen et al., Citation2014) were included. The emotions and the musical training subscale are outlined in study 1. The other subscales follow the same 7-point likert scale structure, but focus on different facets of musical sophistication. The “Active Engagement” scale measures dedication to music in terms of time spent listening, or number of live performances attended, for example. Respondents were also asked to assess the accuracy of their listening skills using the “Perceptual Abilities” scale via agreement scales with statements like “I can tell when people sing or play out of time with the beat”. The “Singing Ability” scale lastly required participants to judge their own singing skills by responding to statements such as “If somebody starts singing a song I don’t know, I can usually join in”.
We also included the Toronto Alexithymia Scale (TAS-20: Bagby et al., Citation1994), a diagnostic measure which assesses alexithymia – an emotional disorder associated with difficulties identifying and describing emotions. Scores were derived both from the full measure, and from individual scores from the “Difficulty Describing Feelings” subscale and the “Difficulty Identifying Feelings” subscale which were deemed most relevant for comparison with the aMEDT scores.
The Patient Health Questionnaire (PHQ-9: Kroenke & Spitzer, Citation2002), a clinical tool used to assess depressive symptoms, was also administered in view of depression having previously been associated with difficulties processing emotions in music (Punkanen et al., Citation2011).
Procedure
A Qualtrics survey link which permitted access to each of the individual tests was distributed to participants remotely. After completing a consent form, participants were instructed to use headphones or speakers to play audio files, and to use a Chrome internet browser to allow the tests to load properly. Tests were then presented in the following order: PHQ-9, aMEDT, Gold-MSI, sMEDT, TAS-20, ERI, followed by a debrief. The entire session took around half an hour to complete.
For this study, a total of 25 aMEDT items were presented to participants. An additional two practice items, which provided feedback, were displayed before the test began. Participants could choose to retake the practice items if they wished. For the remaining 25 items that comprised the main part of the test, participants did not receive any feedback. Items were selected according to Bayes Model estimation, accomplished using the catR package in R (Magis & Raîche, Citation2012), whereby participants’ responses (correct/incorrect) determined the difficulty of the following item based on a dynamic estimate of ability. If a participant produced an incorrect response to an item their estimated level of ability decreased. The next item was selected based on this ability estimate, so that the difficulty of the item was intended to match the ability level of the participant as closely as possible. Final ability estimates were calculated at the end of the test using Weighted Likelihood Estimation (Magis & Raîche, Citation2012).
Results
First, we set out to measure whether the new test was able to capture a wide range of ability levels. To accomplish this, we carried out simulations to investigate sensitivity across the measurement range and then compared these results with the data from the current sample. The purpose of this comparison was to ensure that the ability range in our simulated random sample did not fall above or below the ability range that the adaptive test was sensitive to, and to check that individuals who performed especially well or especially poorly could still be discriminated.
Simulations
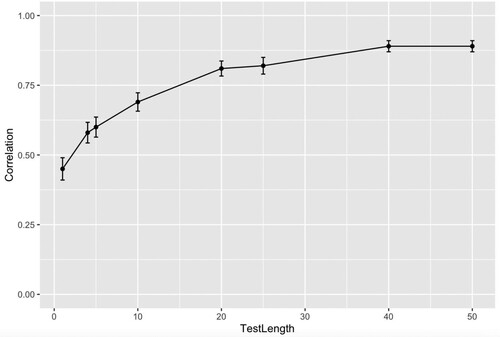
The first simulation (n = 500) indicated that the aMEDT was sensitive to participants within an ability range of −2.5<θ<2.5. This was based on the range of final ability (theta) values at each test length; from around 20 trials onwards the aMEDT became sensitive to this range of true theta values (2.5<θ<2.5, see Figure F1 in Appendix F). A second simulation was then carried out using a simulated sample of n = 500 with this range of assumed “true” ability scores (−2.5<θ<2.5). True scores refer to the hypothetical outcome of a test that directly measures the latent variable of interest, in this case musical emotion discrimination ability. The aim of the second simulation was to ascertain how close model ability estimates came to the “true” scores. A high correlation was found between true and estimated abilities for a test with 25 items (r = .82). Investigation of correlations at different test lengths revealed that they plateau above 20 items (see ), thus indicating that a test with 20 + items will provide a good estimate of participant ability.
Figure 4. Correlations between true scores and final ability estimates in test simulations of different lengths. Note. Test Length is represented by number of items. Correlation represents Pearson’s Correlation Coefficient statistic (r). Error bars represent standard error of the correlation coefficient.
Data from the current sample
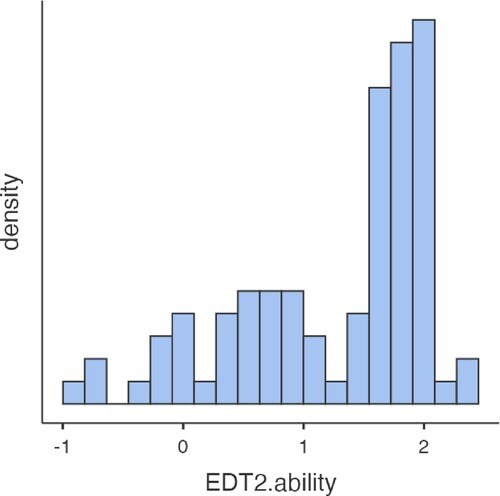
Turning to the data collected in study 2, the sample distribution (see ) indicated that the estimated ability of all participants fell within the −2.5<θ<2.5 ability range demarcated by the simulation study, in fact the majority even in the range of 1.5< θ<2. This confirms that the test did not exhibit ceiling nor floor effects in the current sample, hence demonstrating its suitability for testing a wide ability range.
Figure 5. Empirical distribution of ability estimates in the current sample. Note. N > = 89.
Test reliability
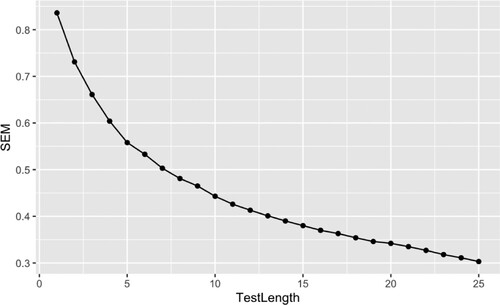
Once we had established the test was sensitive to a wide range of abilities, we investigated how well the test would have performed with fewer items. Weighted likelihood estimation (WLE) and the Bayes Model (BM) scoring methods were employed to produce IRT ability estimates for participants at each stage of the test, such that they updated based on each new response. Estimates ranged from -.89–2.38 (M = 1.26, SD = .8). IRT Standard Error Mean (SEM) was then calculated for BM scores at different test lengths to measure the relationship between test length and measurement error. SEM decreased for longer tests as shown in . This indicates the test is more reliable with a greater number of items, but more importantly demonstrates that reasonable reliability can already be established in tests with 15 or more items.
Figure 6. Standard error mean (SEM) of BM ability estimates by test length.
Test validity
Finally, the validity of the aMEDT was assessed against measures of other traits and abilities which are expected to relate to emotion decoding ability in music. See MacGregor and Müllensiefen (Citation2019) for an in-depth discussion of the hypothesised relationships between the variables included in the current analysis.
Pearsons-product moment correlations were calculated to investigate the relationship between ability estimates from the aMEDT, scores on the previous static, 18-item test, facial and vocal emotion recognition ability (ERI) and self-report measures of musical sophistication (Gold-MSI), alexithymia (TAS-20) and depression (PHQ-9) (see Table G1 in Appendix G for descriptive statistics). Correlations are based on varying sample sizes owing to missing data from participants who failed to complete all the measures included in the online test battery. Alongside the aMEDT, most participants completed the Gold-MSI (n = 89), the sMEDT (n = 86) and the depression scale (n = 81), though fewer completed the vocal (n = 69) and facial (n = 72) recognition test and the alexithymia scale (n = 75).
Final aMEDT ability estimates (calculated at the last [25th] item) displayed moderate correlations (r = .3 and above) with self-reported musical sophistication and perceptual ability, as well as with facial emotion recognition and sMEDT ability. Smaller correlations (r = .1 to r = .3) were found between aMEDT ability, self-reported active and emotional engagement with music and musical training and vocal emotion recognition. Both the full TAS-20 measure of alexithymia and difficulty identifying emotions subscale displayed a weak, negative relationship with aMEDT performance, though the difficulty describing emotions subscale was unrelated. Scores from the PHQ-9 assessment for depression weren’t related to scores on the aMEDT. Refer to Table G2 in Appendix G for a full correlation matrix.
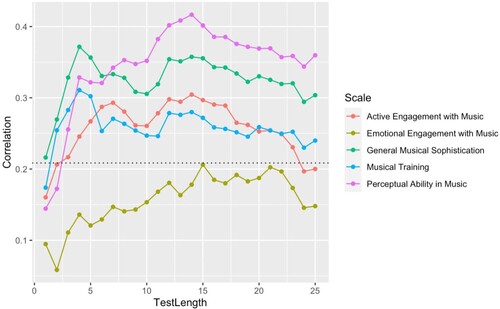
Finally, participants’ ability estimates at different test lengths were correlated with total scores on all measures outlined above to help gauge how many items were needed to establish a valid assessment of emotion discrimination ability. and outline the correlations of aMEDT ability scores at different test lengths with scores on measures of related constructs. Generally, correlations between measures grow with a greater number of items on the aMEDT, up to test lengths of 10–15 items (depending on the measure), after which relationships appear to stabilise.
Figure 7. Correlations between test length and scores on measures of related constructs. Note. Dotted line represents the alpha level of p > = .05, calculated based on the correlation with the lowest sample size (ERI Vocal recognition: n > = 68).
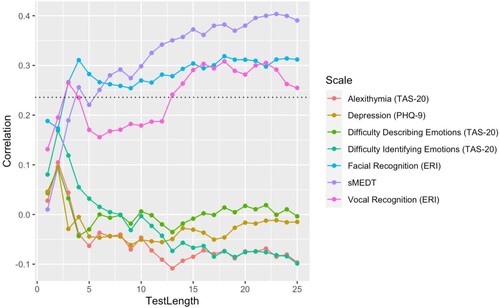
Figure 8. Correlations between test length and scores on the Goldsmiths Musical Sophistication Index. Note. Dotted line represents alpha level (n > = 89).
Discussion
The second study provided some preliminary evidence for the psychometric properties of the aMEDT. Our results indicated that 20 + aMEDT items should permit a stable estimate of musical emotion decoding ability, though tests with 10–15 items might already yield sensible results when used in correlational studies. Ability estimates aligned with scores on other related measures, with the closest relationships demonstrated between aMEDT performance and facial emotion recognition, self-reported musical sophistication, and self-reported music perception abilities.
Importantly, according to the current sample, the refined item bank and adaptive framework of the new aMEDT has helped to overcome the issues with ceiling effects associated with the MEDT. While sMEDT scores were at ceiling for 18% of participants (n = 15 out of 86) in this study, meaning the test items were not difficult enough to distinguish between their emotion decoding abilities, the aMEDT successfully distinguished between participants with above average ability levels. This could explain the moderate correlation between the static and adaptive versions of the test. Scores may have diverged on account of the aMEDT providing a more informative ability estimate for those who displayed high levels of performance.
The elimination of ceiling effects was facilitated by the development of a new item bank which boasts greater diversity in instruments, melodies and emotions, and hence allows for a greater range of item difficulty. Though it is possible that this range of difficulty still isn’t broad enough, and thus despite its promising performance within the current study, the aMEDT should still be validated with more heterogenous participant samples, to include those with exceptional abilities and those who experience difficulties with musical emotion decoding. This will ensure that it is able to pick up the nuances of skill for those at the extremes of the spectrum in terms of musical emotion processing.
A preliminary assessment of test validity established clear links between aMEDT performance and performance on other related measures. As well as providing information on test validity, these relationships also allow insight into the psychological mechanisms underlying musical emotion perception. Out of all Gold-MSI sub-tests measuring musical sophistication, scores on the perceptual abilities in music listening subtest were the most strongly related to emotion discrimination ability, thus implying that perceptual systems involved in the early stages of processing (see ) play a significant role in emotion discrimination ability. Similar findings were reported in a paper by Correia et al. (Citation2022) who collected aggregates of perceptual ability tests of pitch perception and duration discrimination alongside self-report measures and found that emotion recognition of speech, rather than music, was associated with music-related perceptual abilities. Combined, findings support our current model of emotion processing in music by demonstrating the common influence of individual differences in perceptual ability on decoding emotions in speech and music. Investigation using the aMEDT alongside tests of perceptual deficits such as amusia would thus be useful to provide further detail on the specific components of this relationship, to establish, for instance, whether individual differences in pitch perception drive this association, or whether other perceptual factors may also have an impact.
General musical sophistication was also significantly associated with musical emotion discrimination. This link provides tentative evidence for the notion that emotional understanding of music is fundamental to musical ability as proposed in a theory by Kirnarskaya (Citation2009), who suggests that the development of more advanced musical skills is dependent upon this foundation of the ability to decode and perceive emotions in music during early childhood (Kirnarskaya & Winner, Citation1997). Though the correlational nature of our results mean that direction of causality implied by this theory, e.g. that emotion decoding ability precedes the development of advanced musical skill, cannot currently be commented upon. Studies into musical development would be useful to investigate the direction of this relationship. Further study should also investigate the possible effects of mediating factors such as emotional intelligence here.
In contradiction to more general musical sophistication, the emotions subscale of the Gold-MSI only displayed a comparatively weak relationship with aMEDT scores in this study. This could be attributed to the fact that the aMEDT is intended to assess perceived emotions while the Gold-MSI subtest focuses more on felt emotions (see Gabrielsson, Citation2002). However, findings could also be explained by the fact the sample were mostly undergraduate students, contributing to a much smaller variance in emotions scores in this study (SD = 1.04) compared to the first (SD = 4.94). It would thus be beneficial to conduct validation studies with more heterogenous samples in future.
An involvement of general emotion mechanisms in musical emotion processing is implied by the relationship discovered between aMEDT performance and facial emotion recognition. Cross-modality interactions, exemplified by the current results, demonstrate the involvement of general emotion recognition systems in music-specific emotion perception, as proposed in our processing model (see ). Such interactions indicate that the aMEDT could be a useful tool for researchers conducting investigations into the shared processing of emotions across different visual and auditory modalities. Although there is a weaker link between vocal and musical emotion perception, the inclusion of the aMEDT as an alternative auditory presentation mode may be beneficial for such investigations. In fact, the aMEDT could be particularly useful for research into affective mental disorders, such as autism and depression, where modality tends to be a key topic of interest, yet most studies only include vocalisations to represent auditory emotions (e.g. Charbonneau et al., Citation2013; Péron et al., Citation2011; Vederman et al., Citation2012).
Overall, the preliminary validity of the test demonstrated by the relationships outlined above attests to its usefulness for application in wider emotion research. The current paradigm is similar enough in format to other tests of emotion recognition (e.g. facial, vocal and musical) that test results can be easily and meaningfully compared between measures. Despite this advantage, there are some limitations associated with the basic categorical approach to emotion coding that underlies our paradigm; in particular, issues with external validity which have previously been raised by Cespedes-Guevara and Eerola (Citation2018). It is thought that because the frequency with which emotions are represented within different modalities varies, using the same set of basic emotions in tests of vocal, facial and musical recognition is unlikely to provide a fair representation of emotion processing in real life. For example, it is common to see “disgust” featured in tests of facial and vocal recognition, whereas disgust is rarely portrayed in music (Juslin & Laukka, Citation2003). Given this, it is likely that featuring music portraying disgust, or featuring any emotion that is not typically expressed in a particular modality as part of an emotion recognition test will contribute to bias.
Though the categorical approach presents limitations, our study exemplifies how the basic emotion model can be harnessed using a comparison paradigm to permit greater insight into the processes of emotion processing that are recruited during music listening in everyday life. By asking a listener to compare between emotions, we are mimicking the perception of emotional contrasts which would naturally occur as music unfolds over time, as opposed to the labelling and categorising of musical emotions which is unlikely to occur during everyday music listening. We thus believe the current paradigm taps into more typical musical behaviours. Taken alongside our primary goal of imitating the communication of emotions between a performer and a listener, as introduced by Gabrielsson and Juslin (Citation1996), we therefore argue that our test provides a measure of emotion discrimination in music listening that is more ecologically valid than other measures which rely on emotion categorisation.
Conclusion
This paper presents the aMEDT: the first adaptive measure of musical emotion discrimination ability. The test is a new and improved version of the sMEDT (MacGregor & Müllensiefen, Citation2019) with a larger, more diverse stimulus set and an adaptive testing framework, which allows for administrators to adjust the length of the test to suit their requirements. Though further evidence for the psychometric properties of the aMEDT is necessary to fully establish the measure for wider research use, our validation study confirmed that the aMEDT has benefited greatly from employing adaptive testing, demonstrating that it offers greater efficiency and reliability than the previous version and, crucially, that it’s suitable for testing a wide range of ability levels. These advantages indicate the potential value of the aMEDT as a tool for researchers, particularly those interested in the investigation of individual differences in musical emotion decoding ability, the study of shared mechanisms of general emotion processing as well as modality-specific processes or those pursuing a more rounded understanding of affective disorders.
While there are already many useful tools for studying emotion recognition in music (e.g. Belfi & Kacirek, Citation2021; Diconne et al., Citation2021; Eerola & Vuoskoski, Citation2011; Hill & Palmer, Citation2010; Paquette et al., Citation2013 & Vieillard et al., Citation2008), the aMEDT represents a unique contribution to the field of emotion research for two main reasons: firstly, it is the only test of emotion discrimination in music to make use of an adaptive framework that confers several advantages including increased test efficiency and versatility, and secondly, it employs a distinctive paradigm that promotes ecological validity by focusing on differences in affect which are manipulated by the expressive intentions of a performer.
The aMEDT is freely available for research use in English, German and Russian. The MEDT package, which includes both tests, runs in the open-source environment R, and can be accessed via the following link: https://github.com/klausfrieler/EDT.
Acknowledgement
We thank Klaus Frieler for implementation of the aMEDT.
Disclosure statement
No potential conflict of interest was reported by the author(s).
Correction Statement
This article has been republished with minor changes. These changes do not impact the academic content of the article.
Additional information
Funding
Notes
1 The SoX manual can be found via the URL: http://sox.sourceforge.net/sox.html.
References
- Akkermans, J., Schapiro, R., Müllensiefen, D., Jakubowski, K., Shanahan, D., Baker, D., … Frieler, K. (2019). Decoding emotions in expressive music performances: A multi-lab replication and extension study. Cognition and Emotion, 33(6), 1099–1118. https://doi.org/10.1080/02699931.2018.1541312
- Bagby, R. M., Parker, J. D., & Taylor, G. J. (1994). The twenty-item Toronto Alexithymia Scale—I. Item selection and cross-validation of the factor structure. Journal of Psychosomatic Research, 38(1), 23–32. https://doi.org/10.1016/0022-3999(94)90005-1
- Baker, F. B., & Kim, S. H. (2017). The basics of item response theory using R (pp. 17–34). Springer.
- Battcock, A., & Schutz, M. (2022). Emotion and expertise: how listeners with formal music training use cues to perceive emotion. Psychological Research, 86(1), 66–86. https://doi.org/10.1007/s00426-020-01467-1
- Belfi, A. M., & Kacirek, K. (2021). The famous melodies stimulus set. Behavior Research Methods, 53(1), 34–48. https://doi.org/10.3758/s13428-020-01411-6
- Bowman, C. D. (2015). Timbre in musical and vocal sounds: the link to shared emotion processing mechanisms [Doctoral dissertation, Texas A&M University]. https://hdl.handle.net/1969.1/156199.
- Bresin, R., & Friberg, A. (1999, October). Synthesis and decoding of emotionally expressive music performance. In IEEE SMC'99 conference proceedings. 1999 IEEE international conference on systems, Man, and cybernetics (Cat. No. 99CH37028) (Vol. 4, pp. 317-322). IEEE.
- Bürkner, P. C. (2021). Bayesian item response modeling in R with brms and stan. Journal of Statistical Software, 100(5), 1–54. https://doi.org/10.18637/jss.v100.i05
- Castro, S. L., & Lima, C. F. (2014). Age and musical expertise influence emotion recognition in music. Music Perception, 32(2), 125–142. https://doi.org/10.1525/mp.2014.32.2.125
- Cespedes-Guevara, J., & Eerola, T. (2018). Music communicates affects, Not basic emotions – A constructionist account of attribution of emotional meanings to music. Frontiers in Psychology, 9, 215. https://doi.org/10.3389/fpsyg.2018.00215
- Charbonneau, G., Bertone, A., Lepore, F., Nassim, M., Lassonde, M., Mottron, L., & Collignon, O. (2013). Multilevel alterations in the processing of audio–visual emotion expressions in autism spectrum disorders. Neuropsychologia, 51(5), 1002–1010. https://doi.org/10.1016/j.neuropsychologia.2013.02.009
- Correia, A. I., Castro, S. L., MacGregor, C., Müllensiefen, D., Schellenberg, E. G., & Lima, C. F. (2022). Enhanced recognition of vocal emotions in individuals with naturally good musical abilities. Emotion. Advance online publication. https://doi.org/10.1037/emo0000770
- Coutinho, E., & Dibben, N. (2013). Psychoacoustic cues to emotion in speech prosody and music. Cognition & Emotion, 27(4), 658–684. https://doi.org/10.1080/02699931.2012.732559
- De Boeck, P., Bakker, M., Zwitser, R., Nivard, M., Hofman, A., Tuerlinckx, F., & Partchev, I. (2011). The estimation of item response models with the lmer function from the lme4 package in R. Journal of Statistical Software, 39(12), 1–28. https://doi.org/10.18637/jss.v039.i12
- Diconne, K., Paltoglou, A., Kountouriotis, G., Parker, A., & Hostler, T. (2021). KAPODI-The Searchable Database of 364 Available Emotional Stimuli Sets.
- Eerola, T. (2018). Music and emotions. In S. Koelsch (Ed.), Springer handbook of systematic musicology (pp. 539–554).
- Eerola, T., & Vuoskoski, J. K. (2011). A comparison of the discrete and dimensional models of emotion in music. Psychology of Music, 39(1), 18–49. https://doi.org/10.1177/0305735610362821
- Ekman, P. (1984). Expression and the nature of emotion. Approaches to Emotion, 3(19), 320–344.
- Fokkema, M., Smits, N., Zeileis, A., Hothorn, T., & Kelderman, H. (2018). Detecting treatment-subgroup interactions in clustered data with generalized linear mixed-effects model trees. Behavior Research Methods, 50(5), 2016–2034. https://doi.org/10.3758/s13428-017-0971-x
- Foxton, J. M., Dean, J. L., Gee, R., Peretz, I., & Griffiths, T. D. (2004). Characterization of deficits in pitch perception underlying 'tone deafness'. Brain, 127(4), 801–810. https://doi.org/10.1093/brain/awh105
- Gabrielsson, A. (1995). Expressive intention and performance. In Music and the mind machine (pp. 35–47). Springer.
- Gabrielsson, A. (2002). Emotion perceived and emotion felt: same or different? Musicae Scientiae, 5(1_suppl), 123–147.
- Gabrielsson, A., & Juslin, P. N. (1996). Emotional expression in music performance: Between the performer's intention and the listener's experience. Psychology of Music, 24(1), 68–91. https://doi.org/10.1177/0305735696241007
- Gosling, S. D., Rentfrow, P. J., & Swann Jr, W. B. (2003). A very brief measure of the Big-Five personality domains. Journal of Research in Personality, 37(6), 504–528. https://doi.org/10.1016/S0092-6566(03)00046-1
- Gosselin, N., Peretz, I., Johnsen, E., & Adolphs, R. (2007). Amygdala damage impairs emotion recognition from music. Neuropsychologia, 45(2), 236–244. https://doi.org/10.1016/j.neuropsychologia.2006.07.012
- Harrison, P., Collins, T., & Müllensiefen, D. (2017). Ror2 signaling regulates Golgi structure and transport through IFT20 for tumor invasiveness. Scientific Reports, 7(1), 1–18. https://doi.org/10.1038/s41598-016-0028-x
- Harrison, P., & Müllensiefen, D. (2018). Development and validation of the computerised adaptive beat alignment test (CA-BAT). Scientific Reports, 8(1), 1–19.
- Hays, R. D., Morales, L. S., & Reise, S. P. (2000). Item response theory and health outcomes measurement in the 21st century. Medical Care, 38(9 Suppl), 1128–1142.
- Hill, W. T., & Palmer, J. A. (2010). Affective response to a set of new musical stimuli. Psychological Reports, 106(2), 581–588. https://doi.org/10.2466/pr0.106.2.581-588
- Ilie, G., & Thompson, W. F. (2006). A comparison of acoustic cues in music and speech for three dimensions of affect. Music Perception, 23(4), 319–330. https://doi.org/10.1525/mp.2006.23.4.319
- Imbir, K., & Gołąb, M. (2017). Affective reactions to music: Norms for 120 excerpts of modern and classical music. Psychology of Music, 45(3), 432–449. https://doi.org/10.1177/0305735616671587
- Juslin, P. N. (2000). Cue utilization in communication of emotion in music performance: Relating performance to perception. Journal of Experimental Psychology: Human Perception and Performance, 26(6), 1797. https://doi.org/10.1037/0096-1523.26.6.1797
- Juslin, P. N., & Laukka, P. (2003). Communication of emotions in vocal expression and music performance: Different channels, same code? Psychological Bulletin, 129(5), 770. https://doi.org/10.1037/0033-2909.129.5.770
- Juslin, P. N., & Västfjäll, D. (2008). Emotional responses to music: The need to consider underlying mechanisms. Behavioral and Brain Sciences, 31(5), 559–575. https://doi.org/10.1017/S0140525X08005293
- Kirnarskaya, D. (2009). The natural musician: On abilities, giftedness, and talent. Oxford University Press.
- Kirnarskaya, D., & Winner, E. (1997). Musical ability in a new key: Exploring the expressive ear for music. Psychomusicology: A Journal of Research in Music Cognition, 16(1-2), 2–16. https://doi.org/10.1037/h0094071
- Koelsch, S. (2005). Investigating emotion with music: neuroscientific approaches. Annals of the New York Academy of Sciences, 1060(1), 412–418. https://doi.org/10.1196/annals.1360.034
- Kotz, S. A., & Paulmann, S. (2011). Emotion, language, and the brain. Language and Linguistics Compass, 5(3), 108–125. https://doi.org/10.1111/j.1749-818X.2010.00267.x
- Kroenke, K., & Spitzer, R. L. (2002). The PHQ-9: a new depression diagnostic and severity measure. Psychiatric Annals, 32(9), 509–515. https://doi.org/10.3928/0048-5713-20020901-06
- Lepping, R. J., Atchley, R. A., & Savage, C. R. (2016). Development of a validated emotionally provocative musical stimulus set for research. Psychology of Music, 44(5), 1012–1028. https://doi.org/10.1177/0305735615604509
- Leung, F. Y. N., Sin, J., Dawson, C., Ong, J. H., Zhao, C., Veić, A., & Liu, F. (2022). Emotion recognition across visual and auditory modalities in autism spectrum disorder: A systematic review and meta-analysis. Developmental Review, 63, 101000. https://doi.org/10.1016/j.dr.2021.101000
- Lima, C. F., Brancatisano, O., Fancourt, A., Müllensiefen, D., Scott, S. K., Warren, J. D., & Stewart, L. (2016). Ultrastructural characterization of the lower motor system in a mouse model of krabbe disease. Scientific Reports, 6(1), 1–13. https://doi.org/10.1038/s41598-016-0001-8
- MacGregor, C., & Müllensiefen, D. (2019). The Musical Emotion Discrimination Task: A new measure for assessing the ability to discriminate emotions in music. Frontiers in Psychology, 10, 1955. https://doi.org/10.3389/fpsyg.2019.01955
- Magis, D., & Raîche, G. (2012). Random generation of response patterns under computerized adaptive testing with the R package catR. Journal of Statistical Software, 48(8), 1–31. https://doi.org/10.18637/jss.v048.i08
- Müllensiefen, D., Gingras, B., Musil, J., & Stewart, L. (2014). The musicality of non-musicians: An index for assessing musical sophistication in the general population. PloS one, 9(2), e89642. https://doi.org/10.1371/journal.pone.0089642
- Müllensiefen, D., Harrison, P., Caprini, F., & Fancourt, A. (2015). Investigating the importance of self-theories of intelligence and musicality for students' academic and musical achievement. Frontiers in Psychology, 6, 266. http://doi.org/10.3389/fpsyg.2015.01702
- Paquette, S., Peretz, I., & Belin, P. (2013). The “Musical Emotional Bursts”: a validated set of musical affect bursts to investigate auditory affective processing. Frontiers in Psychology, 4(509), 1–7. https://doi.org/10.3389/fpsyg.2013.00509
- Patel, A. D. (2007). Music, language and the brain. Oxford University Press.
- Patel, A. D.. (2012). Language, music and the brain: a resource-sharing framework. In P. Rebuschat, M. Rohrmeier, J. Hawkins, & I. Cross (Eds.), Language and music as cognitive systems (pp. 204–223). Oxford University Press.
- Pausch, V., Müllensiefen, D., & Kopiez, R. (2021). Musikalischer g-Faktor oder multiple Faktoren? Struktur und Leistungskennwerte der musikalischen Hörfähigkeit von Jugendlichen [Musical g-factor or multiple factors? Structure and performance parameters of the musical hearing ability of young people]. Jahrbuch Musikpsychologie, 30(e89), 1–25. https://doi.org/10.5964/jbdgm.89
- Peretz, I., Vuvan, D., Lagrois, MÉ, & Armony, J. L. (2015). Neural overlap in processing music and speech. Philosophical Transactions of the Royal Society B: Biological Sciences, 370(1664), 20140090. https://doi.org/10.1098/rstb.2014.0090
- Péron, J., El Tamer, S., Grandjean, D., Leray, E., Travers, D., Drapier, D., … Millet, B. (2011). Major depressive disorder skews the recognition of emotional prosody. Progress in Neuro-Psychopharmacology and Biological Psychiatry, 35(4), 987–996. https://doi.org/10.1016/j.pnpbp.2011.01.019
- Punkanen, M., Eerola, T., & Erkkilä, J. (2011). Biased emotional recognition in depression: Perception of emotions in music by depressed patients. Journal of Affective Disorders, 130(1-2), 118–126. https://doi.org/10.1016/j.jad.2010.10.034
- Resnicow, J. E., Salovey, P., & Repp, B. H. (2004). Is recognition of emotion in music performance an aspect of emotional intelligence? Music Perception, 22(1), 145–158. https://doi.org/10.1525/mp.2004.22.1.145
- Rödel, A. T. (2021). Listening to background music while studying-emotional drive or cognitive overload? [master's thesis, University of Twente]. https://essay.utwente.nl/86593/.
- Ruth, N., MacGregor, C., & Müllensiefen, D. (2020, May 20–21). Associations between personality and musical emotion discrimination in secondary school students [Poster presentation]. Brain cognition emotion music, Kent, UK.
- Scherer, K. R. (1995). Expression of emotion in voice and music. Journal of Voice, 9(3), 235–248. https://doi.org/10.1016/S0892-1997(05)80231-0
- Scherer, K. R. (2004). Which emotions can be induced by music? What are the underlying mechanisms? And how can we measure them? Journal of New Music Research, 33(3), 239–251. https://doi.org/10.1080/0929821042000317822
- Scherer, K. R., & Scherer, U. (2011). Assessing the ability to recognize facial and vocal expressions of emotion: Construction and validation of the Emotion Recognition Index. Journal of Nonverbal Behavior, 35(4), 305–326. https://doi.org/10.1007/s10919-011-0115-4
- Schirmer, A., & Kotz, S. A. (2006). Beyond the right hemisphere: brain mechanisms mediating vocal emotional processing. Trends in Cognitive Sciences, 10(1), 24–30. https://doi.org/10.1016/j.tics.2005.11.009
- Slevc, L. R. (2008, August 25-29). Language, music and modularity, Evidence for shared processing of linguistic and musical syntax.[Oral presentation]. The 10th international conference on music perception & cognition, Sapporo, Japan. http://jsmpc.org/ICMPC10/index.html.
- Taruffi, L., Allen, R., Downing, J., & Heaton, P. (2017). Individual differences in music-perceived emotions. Music Perception, 34(3), 253–266. https://doi.org/10.1525/mp.2017.34.3.253
- Trimmer, C. G., & Cuddy, L. L. (2008). Emotional intelligence, not music training, predicts recognition of emotional speech prosody. Emotion, 8(6), 838–849. https://doi.org/10.1037/a0014080
- Van't Hooft, J. J., Pijnenburg, Y. A., Sikkes, S. A., Scheltens, P., Spikman, J. M., Jaschke, A. C., … Tijms, B. M. (2021). Frontotemporal dementia, music perception and social cognition share neurobiological circuits: A meta-analysis. Brain and Cognition, 148, 105660. https://doi.org/10.1016/j.bandc.2020.105660
- Vederman, A. C., Weisenbach, S. L., Rapport, L. J., Leon, H. M., Haase, B. D., Franti, L. M., … McInnis, M. G. (2012). Modality-specific alterations in the perception of emotional stimuli in bipolar disorder compared to healthy controls and major depressive disorder. Cortex, 48(8), 1027–1034. https://doi.org/10.1016/j.cortex.2011.03.017
- Vieillard, S., Peretz, I., Gosselin, N., Khalfa, S., Gagnon, L., & Bouchard, B. (2008). Happy, sad, scary and peaceful musical excerpts for research on emotions. Cognition & Emotion, 22(4), 720–752. https://doi.org/10.1080/02699930701503567
- Zhou, L., Liu, F., Jiang, J., & Jiang, C. (2019). Impaired emotional processing of chords in congenital amusia: Electrophysiological and behavioral evidence. Brain and Cognition, 135, 103577. doi:10.1016/j.bandc.2019.06.001