?Mathematical formulae have been encoded as MathML and are displayed in this HTML version using MathJax in order to improve their display. Uncheck the box to turn MathJax off. This feature requires Javascript. Click on a formula to zoom.
ABSTRACT
Rumination is typically defined as the perseverative focus of attention on negative internal thoughts and feelings, which can increase the risk of developing – and severity once developed – of depression. It is thought the perseveration is caused by a deficit in inhibitory control in ruminators. Congruent with this hypothesis, estimates of inhibition in task switching – the n–2 task repetition cost – are negatively associated with estimates of rumination. However, estimates of individual differences of n–2 task repetition costs are hampered by (a) measurement error caused by trial-wise variation in performance, and (b) recent evidence suggesting much of the n–2 task repetition cost measures interference in episodic memory, not inhibition. The aim of the current study was to revisit the question of the association between the n–2 task repetition cost and measures of rumination by (a) statistically accounting for measurement error by estimating n–2 task repetition costs via trial-level Bayesian multilevel modelling, and (b) controlling for episodic interference effects on estimates of n–2 task repetition cost by utilising a paradigm capable of doing so. The results provided no evidence for an association between rumination and n–2 task repetition costs, regardless of episodic interference.
Rumination refers to the process of continuously focussing on one's thoughts and feelings: A process of self-reflection. Although rumination refers to the process of thought rather than the content of thought, it can become maladaptive in people with depression where the content of rumination tends to be negative (Nolen-Hoeksema et al., Citation2008). Such depressive rumination (Nolen-Hoeksema & Morrow, Citation1991) is of interest to clinical researchers because depressed individuals who engage in it tend to have longer periods of depression with more severe symptoms (Lyubomirsky & Nolen-Hoeksema, Citation1993; Nolen-Hoeksema & Morrow, Citation1991), and are more likely to go on to develop major depression (Joormann & Quinn, Citation2014; Nolen-Hoeksema et al., Citation2008). In addition, levels of depressive rumination remain relatively stable even when depressive symptoms change (Bagby et al., Citation2004; Nolen-Hoeksema & Davis, Citation1999), suggesting depressive rumination could pose a risk factor for a recurrence of depressive episodes in recovered individuals (Nolen-Hoeksema et al., Citation2008).
Rumination is associated with a wide range of deficits in cognitive function, and in particular with tasks that tap executive functions (EFs) (Yang et al., Citation2017; Zetsche et al., Citation2018). EFs are a set of higher-order cognitive processes that include – but are not necessarily limited to – task switching, memory updating, and inhibition of pre-potent responses (Miyake et al., Citation2000). They allow for goal directed behaviour, supporting cognitive flexibility in response to changing task demands (Logan & Gordon, Citation2001; Miyake et al., Citation2000; Norman & Shallice, Citation1986). The observed deficits in EFs in individuals with higher levels of rumination has led some authors to suggest that EF deficits play a causal role in establishing and maintaining rumination during onset of negative mood (Koster et al., Citation2011; Whitmer & Gotlib, Citation2013). For example, Koster et al. (Citation2011) suggest that depressive rumination could be caused by an inability to disengage from negative thought and to switch to a more adaptive thought mode. As such, understanding the nature of EF deficits in individuals with trait rumination could help understand the cognitive mechanisms underlying increased vulnerability to depressive rumination (Zetsche et al., Citation2012).
1. Cognitive inhibition
One prominent component of executive functioning is cognitive inhibition (Friedman & Miyake, Citation2004; but see Rey-Mermet et al., Citation2018), which – broadly defined – refers to the ability of the cognitive system to ignore and/or suppress irrelevant stimuli, thoughts, and actions (Gorfein & MacLeod, Citation2007). Indeed, inhibition might be important to avoid depressive rumination as it might allow the cognitive system greater cognitive flexibility to disengage attention from negative thoughts, allowing the system to switch to other thoughts and/or activities (Koster et al., Citation2011).
The role of inhibition in supporting cognitive flexibility has been extensively studied using the task switching paradigm (Grange & Houghton, Citation2014; Kiesel et al., Citation2010; Vandierendonck et al., Citation2010), where participants are required to rapidly switch between simple cognitive tasks (such as judging whether a number stimulus is odd/even, or lower/higher than five, or printed in red/green font), with the currently relevant task being signalled via a task cue (e.g. the word “magnitude”). Inhibition is thought to be important for successful task switching performance to reduce the interference in working memory caused by the persisting activation of the mental representation associated with a recently performed – but no longer relevant – task (see Koch et al., Citation2010 for a review; see Sexton & Cooper, Citation2017 for a computational demonstration).
Evidence for inhibition in task switching comes from the so-called n–2 task repetition cost: When participants switch between three tasks (arbitrarily labelled A, B, & C), response times are slower to ABA sequences than to CBA sequences (Mayr & Keele, Citation2000); this detriment to performance on ABA sequences is thought to reflect the persisting inhibition of task A across the trial triplet which delays reactivation attempts on the current trial (see Koch et al., Citation2010 for a review). Thus in the taxonomy of inhibition proposed by Friedman and Miyake (Citation2004), n–2 task repetition costs reflect inhibition of distracting interference (but see Rey-Mermet et al., Citation2018 for difficulty in establishing a similar taxonomy).
Given the n–2 task repetition cost is thought to reflect inhibition of high-level mental representations (i.e. task / goal representations), it is a potentially important tool to explore inhibitory control in clinical applications, such as depressive rumination. The tendency to perseverate on negative thoughts in ruminators could be caused by an inability to inhibit the processing of irrelevant information (Whitmer & Banich, Citation2007). Congruent with this hypothesis, research has shown a consistent negative association between n–2 task repetition costs and self-report measures of rumination, using standard (Whitmer & Banich, Citation2007; Whitmer & Gotlib, Citation2012) and emotional task switching designs (De Lissnyder et al., Citation2010). This work was furthered by Whitmer and Gotlib (Citation2012) who induced rumination (i.e. state rumination) in individuals with major depressive disorder and individuals in a control group; the results showed that the rumination induction had no impact on n–2 task repetition costs in either group, but trait rumination – measured via self-report questionnaire – was again negatively associated with n–2 task repetition costs (across all participants). This suggests that whilst state and trait rumination may lead to dissociable cognitive deficits, depressive trait rumination appears consistently associated with a reduction in the ability to inhibit irrelevant / interfering mental representations during task switching.
1.1. Issues with measuring individual differences in task inhibition
Despite the impressive progress made on quantifying the association between rumination and inhibition during task switching, there are two issues – one statistical, and the other methodological – which warrant a reexamination of this association.
1.1.1. Statistical issues
The first issue is statistical, and relates to the difficulties of estimating individual participants' true n–2 task repetition costs in the face of measurement error. Measurement error has been known to plague estimates of latent variables, and has been cited as one primary contributor to the low-reliability often reported of tasks that are thought to measure a wide-range of cognitive facets (Hedge et al., Citation2018; Rouder & Haaf, Citation2019), including inhibition (Rouder et al., Citation2019).
A primary source of measurement error in cognitive paradigms is trial-noise: Data collected from participants is obviously limited in the sense that a finite set of trials are presented to each participant. Therefore, the response times for each participant represent only a sample estimate of that participant's true performance, and this sample estimate is compromised by sampling error, which decreases as trial numbers increase (Rouder & Haaf, Citation2019; Rouder et al., Citation2019). However, the application of an appropriate multilevel statistical model can account for trial noise and provide estimates of participant's true performance.
Following Rouder et al. (Citation2019), one potential statistical model is a multilevel linear model, which models an individual's () response time (RT) for trial sequence
on trial
as
(1)
(1) where
represents the participant's true RT baseline performance,
is an effect-coded parameter for the current level of task sequence (e.g.
for CBA trials and
for ABA trials), and
is participant
's true effect of task sequence (i.e, their n–2 task repetition cost). The model is considered multilevel because the variation in α and θ across individuals is constrained to be random draws from a population of α and θ values, representing the whole population of participants. Specifically, these parameters could be distributed as follows:
(2)
(2) where μ is the population mean for each parameter, and
is the variance associated with the population parameters.
One advantage of the multilevel modelling approach is that trial-level noise is accounted for in the analysis because trial-level data are modelled rather than aggregate-level data, and as such superior estimates of true effect sizes can be established (Rouder et al., Citation2019); that is, the model provides estimates of , the true n–2 task repetition cost for each participant. This is in contrast to sample-estimates of effect sizes (as typically used in individual-differences studies of inhibition in task switching) where trial-noise is not accounted for, and therefore adds variability to estimates of inhibition. This has implications for studies estimating the association between rumination and inhibition in task switching because extant studies have utilised sample-estimates of individual's n–2 task repetition costs; by utilising multilevel modelling, superior estimates are possible which could lead to different outcomes.
1.1.2. Methodological issues
The second issue pertains to the measure of the n–2 task repetition cost itself, and the extent to which it is a pure measure of cognitive inhibition. Grange et al. (Citation2017) extended the work by Mayr (Citation2002) and reported that a large proportion of the n–2 task repetition cost can be explained by a non-inhibitory effect, specifically interference caused by automatic episodic retrieval. Within a task switching context, this account proposes that elements of a just-performed task – such as the task cue presented, details of the imperative stimulus, and the response selected – become bound together into a single memory representation in episodic memory, called “event-files” in Hommel's terminology (Hommel, Citation1998, Citation2004) and “instances” in Logan's terminology (Logan, Citation1988, Citation2002). When this task is cued again, the most recent episodic trace of this task is retrieved from memory; if all elements of the retrieved episodic trace (e.g. the cue, the stimulus, and the selected response) are the same as the elements presented on the current trial, repetition priming occurs and response selection is facilitated. However, if elements of the retrieved episodic trace are different to the current task demands (e.g. if a different response is required due to a different stimulus), then a mismatch cost occurs which impairs response selection. From this perspective, n–2 task repetition costs can emerge across an ABA sequence if the task demands differ for task A from trial n–2 to trial n; that is, from this perspective the n–2 task repetition could be a mismatch cost caused by episodic mismatches rather than an active inhibitory mechanism.
Grange et al. (Citation2017) utilised the paradigm introduced by Mayr (Citation2002) to examine the contribution of episodic retrieval effects on estimates of the n–2 task repetition cost (an example of this paradigm is shown in ). In this paradigm, participants are presented with a circular stimulus that can appear in any of the four corners of a centrally presented square frame. The task of the participant is to mentally transform the spatial location of the stimulus according to the currently relevant rule, and make a spatially congruent response to the new location. Participants know which rule is currently relevant based on a task cue. For example, if participants are presented with a which is indicated by a task cue. For example, if the cue is a pentagon, the participant must mentally move the stimulus vertically; for example, if the stimulus is in the bottom-left, the transformation rule would move the stimulus to the top-left, and as such a top-left response is required.
Figure 1. Schematic overview of the switching paradigm used in the current study. The arrows represent the spatial transformation that is required from participants, but these arrows are not presented to participants. (Note images are not to scale). Figure is available at https://www.flickr.com/photos/150716232@N04/shares/5413G0 under CC licence https://creativecommons.org/licenses/by/2.0/.
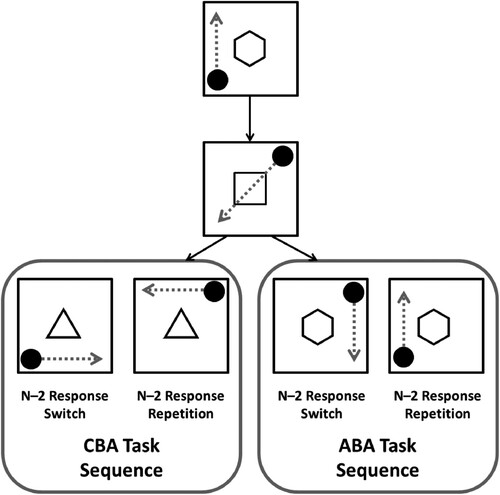
This paradigm is able to control whether n–2 task repetitions include episodic interference because the trial parameters can be either match or mismatch across an ABA sequence. For example, if the stimulus is in the same location for task A across an ABA sequence, then this would constitute an episodic match as the requirements on trial n match the parameters retrieved from trial n–2; this would lead to facilitated response selection, and a reduced n–2 task repetition cost. If, however, the stimulus is in a different location across an ABA sequence there would be a mismatch between trial n and trial n–2; this would lead to a mismatch cost and an increased n–2 task repetition cost. Comparing n–2 task repetition costs for n–2 response repetitions (i.e. episodic match trials) and n–2 response switches (i.e. episodic mismatches) allows quantification of the contribution of episodic interference to measures of n–2 task repetition costs.
Across several studies, Grange and colleagues have consistently found larger n–2 task repetition costs for episodic mismatches (Grange, Citation2018a; Grange et al., Citation2019, Citation2017; Kowalczyk & Grange, Citation2019), suggesting that much of the n–2 task repetition cost can be explained by episodic retrieval effects rather than inhibition. When episodic retrieval effects are removed on n–2 response repetition trials, the n–2 task repetition cost is much smaller.
This has implications for studies estimating the association between rumination and inhibition in task switching because extant studies have not been able to control – and hence remove – the contribution of episodic interference to estimates of the n–2 task repetition cost. The possibility remains, then, that the observed association between rumination and the n–2 task repetition cost is actually an association between rumination and episodic retrieval effects.
1.2. The current study
The purpose of the current study is to revisit the question of the association of rumination and the n–2 task repetition cost whilst addressing both the statistical limitations and methodological limitations of measuring inhibition using the n–2 task repetition cost. Specifically, the current study will utilise the paradigm used by Grange et al. (Citation2017; originally introduced by Mayr, Citation2002) to provide estimates of n–2 task repetition costs uncontaminated by episodic interference. In addition, the study will utilise Bayesian multilevel regression models to provide improved estimates of individual participant's true n–2 task repetition cost by accounting for trial-level noise. These model-estimates of true n–2 task repetition costs will then be used as the outcome measure in a regression model to establish the predictive value of rumination.
Another methodological issue addressed in the current study is that all of the previously mentioned studies that examined the relationship between rumination and n–2 task repetition costs employed task switching paradigms where immediate task repetitions were possible. There is good evidence from the cognitive literature that if immediate task repetitions are possible, estimates of n–2 task repetitions reduce in magnitude (Philipp & Koch, Citation2006; Scheil & Kleinsorge, Citation2019). This reduction has been attributed to a shift in the balance of task inhibition and task activation when the cognitive system detects that immediate task repetitions are possible (which would favour persisting task activation). If this shift of balance occurred in previous studies, this could affect the precision of the estimate of the relationship between task inhibition and rumination. In the current study, immediate task repetitions are therefore not permitted.
2. Method
The study was programmed and delivered online using Gorilla (Anwyl-Irvine et al., Citation2020), and participant recruitment was via Prolific academic https://www.prolific.co/.
2.1. Sample size planning
The target sample size was set at N = 250. Sample size was determined via a series of simulation studies (see Appendix 1). The simulations assessed the ability to detect an association between RRS scores and n–2 task repetition costs within a Bayesian linear regression, where the population-level association between the two variables was expected to be . The effect size selected for the current study is smaller than estimates in the literature to guard against potential over-estimation of effect sizes in published research (see e.g. Gelman & Carlin, Citation2014). For example, Experiments 1 and 2 of Whitmer and Banich (Citation2007) reported effect sizes of r = −0.693 and r = −0.404, respectively; Whitmer and Gotlib (Citation2012) reported the association between n–2 task repetition cost and trait rumination to be r = −0.24Footnote1. Note though that an effect size of r = −0.20 is similar to estimates from meta-analyses on the association between rumination and inhibition [r = −0.23; Yang et al., Citation2017] and the association between rumination and discarding irrelevant information from working memory [r = −0.20; Zetsche et al., Citation2018].
The simulations showed that a sample size of N = 250 provided excellent sensitivity (90% and above) to detect an association between n–2 task repetition costs and RRS scores in a Bayesian linear regression if the true association is or larger. Note that the sensitivity analysis was based on the main research aim of estimating the association between n–2 task repetition cost and RRS scores separately for both levels of n–2 response (response repetition vs. response switch). That is, separate regressions were performed for each level of n–2 response, providing an estimate of the association between n–2 task repetition cost and RRS in both (i.e. estimation of
and
).
The study was therefore not designed to establish whether and
are reliably different from each other. As outlined in Appendix 1, establishing this difference requires estimation of an interaction parameter within a multiple regression with n–2 task repetition cost as the outcome variable, RRS as a continuous predictor variable, and n–2 “Response” as a binary predictor variable (response repetition vs. response switch). With N = 250 the current study is sensitive to detect relatively large differences in these parameters; for example, if the true difference in parameters is 0.20 or larger, the study has 87% sensitivity to detect it. However, sensitivity drops off considerably if the true difference is smaller than this. For example, if the true difference is 0.10, sensitivity analysis suggested 3200 participants are required to detect it. The study will therefore not make any strong claims about the differences in these parameters.
2.2. Participants
The final sample consisted of 255 participants (132 females, 117 males, 6 other) with a mean age of 35.66 (SD = 11.84). Only participants residing in the United Kingdom or the United States of America were able to enter the study on Prolific. Participants were also be required to be aged between 18–60 to exclude potential negative effects of healthy ageing on task switching performance. Participants were removed from final analysis if they failed the attention check embedded within the rumination questionnaire (see “Materials” section) or if they maintained a session-wise accuracy on the task switching paradigm below 85%.
2.3. Materials
2.3.1. Questionnaire measures
Rumination was measured via the Rumination Response Scale [RRS; Nolen-Hoeksema & Morrow, Citation1991], a self-report measure of ruminative tendencies. Participants are asked to read a series of statements (e.g. “Why do I have problems other people don't have?”) and for each to respond whether they almost never, sometimes, often, or almost always think or do each when they feel depressed. Responses for each item are scored from 1 (almost never) to 4 (almost always), and the total score is the sum of all responses. It has been shown that several items on the RRS overlap with items found on depression scales, and as such the current study utilised the 10-item version of the RRS (Treynor et al., Citation2003). The 10-item version has been found to have a two-factor solution, with five items loading onto depressive “brooding”, and five items loading onto reflective “pondering”. Scores on this scale thus range from 10 to 40.
The Beck's Depression Inventory II [BDI-II; (Beck et al., Citation1996)] was used to assess levels of depression. The BDI-II is a 21-item self-report measure of attitudes and symptoms associated with depression (e.g. sadness, anhedonia, fatigue) and has excellent psychometric properties (Dozois et al., Citation1998). The BDI-II presents a series of categories to which participants must select the response that best describes their feelings during the past two weeks (for example, for sadness participants must select either “I do not feel sad”; “I feel sad much of the time”, “I am sad all the time”; or “I am so sad or unhappy that I can't stand it”). The BDI-II is scored out of 63 and scores can be classified as having minimal (0–13), mild (14–19), moderate (20–28) or severe (29–63) levels of repression.
2.3.2. Attention check
An attention check was embedded as an additional item into the RRS questionnaire to aid identification of participants not reading the items carefully. The item read It is important you pay attention to this study; please select “almost never”. Participants who do not select this response were removed from the study (see Participants section).
2.3.3. Task switching paradigm
The task switching paradigm consisted of the presentation of a large black square frame positioned within the centre of the screen. A task cue was presented in the centre of the frame for 150 milliseconds (ms). The cue was either be a hexagon, a square, or a triangle. The cue informed the participant which spatial transformation rule was relevant on the current trial, with each cue uniquely being associated with a single rule (cue – rule pairings were fully counterbalanced across participants). After 150ms, the stimulus appeared in any one of the four corners of the frame (note the cue remained on the screen throughout stimulus presentation); the stimulus consisted of a single filled black circle. The participant was required to mentally make a spatial transformation of the stimulus' position within the frame according to the relevant transformation rule currently being cued, and make a spatially congruent response on their keyboard. For example, if a hexagon cue was presented (and if this cue was associated with the “vertical” response rule), and the stimulus appeared in the top-right corner of the frame, the participant must apply the relevant transformation rule which would move the stimulus from the top-right to the bottom-right. The participant must then respond with a bottom-right keypress. Participants were asked to use the “D”, “C”, “J” and “N” keys on the keyboard for top-left, bottom-left, top-right, and bottom-right responses, respectively. Participants were asked to use their index and middle finger of each hand for the response keys, and were instructed to respond as quickly and as accurately as possible.
Once a response was registered from the participant, the frame went blank for 50 ms, before the cue for the next trial was presented. However, if an error was made the word “Error!” appeared in red font in the centre of the frame for 1000 ms before proceeding. Note that a 50 ms inter-trial interval was shown by Grange (Citation2018a) to produce larger n–2 task repetition costs, which enhanced the sensitivity of the analysis. The cue for the next trial was randomly selected with the constraint that no immediate rule repetitions were allowed. Stimulus position was randomised without constraint.
Participants were presented with 5 blocks of 120 trials in the main experimental block. This was preceded by a 32-trial practice block to familiarise participants with the task and the cue – rule pairings.
2.4. Procedure
Participants were presented a full study information sheet and consent form upon entering the study via Prolific. After providing informed consent, participants were randomly allocated to a particular ordering of the experimental materials: (1) BDI-II – RRS – task switching paradigm; (2) RRS – BDI-II – task switching paradigm; (3) task switching paradigm – BDI-II – RRS; or (4) task switching paradigm – RRS – BDI-IIFootnote2.
Participants were presented with a debrief screen after all materials had been presented. The study took approximately 30 minutes to complete.
3. Results
The results section is structured as follows. First, the task switching data are analysed at the aggregate level to assess the impact of task sequence and response repetition on both response time and accuracy; this serves as a manipulation check to establish that previous results are replicated (e.g. Grange et al., Citation2017 showing smaller n–2 task repetition costs in the case of episodic matches (i.e. n–2 response repetitions). After this, trial-level response time data are modelled with a multilevel Bayesian regression to obtain model-estimates of participants' true n–2 task repetition costs for both episodic matches and episodic mismatches by accounting for trial-level noise (Rouder & Haaf, Citation2019). These model-estimates of n–2 task repetition costs are then used as outcome variables in two separate Bayesian multiple regressions with RRS and BDI-II scores as predictor variables.
3.1. Data preparation
All of the data wrangling, statistical modelling, and visualisation utilised R (R Core Team, Citation2020) and various packagesFootnote3. The first two trials from each block were removed as these cannot be classified into either n–2 task repetitions or n–2 task switches. The two trials following an error were removed; for the response time analysis, error trials were also removed. Total error trimming led to removal of 11.26% of trials. For the response time, RTs faster than 150 milliseconds were removed, as were RTs slower than 2.5 SDs above each participant's mean for each cell of the experimental design. Response time trimming led to removal of a further 2.95% of trials. RTs were log-transformed prior to final analysis.
3.2. Aggregate-Level analysis
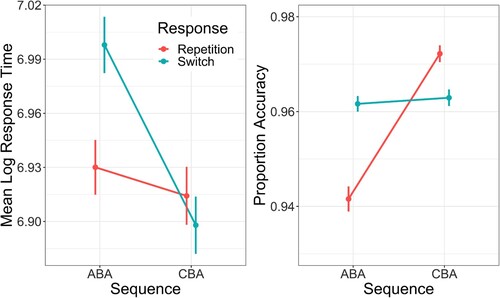
Mean (log) RTFootnote4 and proportion accuracy across both factors of the design are visualised in . Five Bayesian regression models were fitted to each dependent variable at the aggregate level (i.e. the means per participant per cell of the design were used as outcome variables); each model predicted the outcome variable (either RT or proportion accuracy) from one or more predictor variables: (1) an intercept-only model (i.e. a null model with no predictors); (2) just a (binary) predictor of sequence; (3) just a (binary) predictor of response; (4) a main effects model including both predictors sequence and response and (5) an interaction model, which included both predictors plus a term for their interaction. All models had random intercepts per participant. For the RT analysis, the outcome variable was modelled as a Gaussian distribution, and for the proportion accuracy the outcome variable was modelled as a beta distribution. The models were fitted using the R package brms (Bürkner, Citation2017) using four chains; each chain took 5000 samples from the posterior distribution for each parameter, with the first 2000 samples being treated as warmup. Visual inspection of the chains showed good convergence for all models, and all values were close to 1.
Figure 2. Mean log response time (left panel) and mean proportion accuracy (right panel) as a function of task Sequence (ABA vs. CBA) and n–2 Response (repetition vs. switch). Error bars denote one standard error around the mean.
Model comparison was used to assess whether the inclusion of certain predictors led to a superior model fit. For this, the widely applicable information criterion (WAIC) was used, which provides an estimate of model fit quality whilst penalising for additional parameters; the model with the lowest WAIC is to be preferred. Akaike weights for WAIC were also calculated (Wagenmakers & Farrell, Citation2004) which provides an estimate of the probability each model out of the set under consideration will provide a better prediction to new data. Akaike's weight for each model being considered within the set of all models
is given by
(3)
(3) where
is the difference between model
's WAIC value and that of the best-fitting model.
The results of the model fitting can be seen in . For response times, the best model included both main effects of task sequence (ABA vs. CBA) and n–2 response (repetition vs. switch), plus their interaction. The interaction model showed that RTs were generally faster for CBA sequences than for ABA sequences (, 95%CI −0.025, −0.007) and were slower for n–2 response switches than for n–2 response repetitions (
, 95%CI 0.059, 0.077). The interaction parameter was reliably different from zero (
, 95%CI −0.097, −0.071) suggesting the n–2 task repetition cost was reliably smaller for n–2 response repetitions than for n–2 response switches. Follow-up analyses showed that the n–2 repetition cost for n–2 response repetitions (20 ms, un-transformed) was not reliably different from zero (
, 95%CI
), but it was for the n–2 repetition cost for n–2 response switches (104 ms, un-transformed;
, 95%CI
), thus replicating the main finding of Grange et al. (Citation2017).
Table 1. Model comparison results for the aggregate behavioural data.
For the accuracy analysis, the best model was again the interaction model. The interaction model showed that accuracy was better on CBA trials than on ABA trials (, 95%CI 0.824, 1.051), and was better for n–2 response repetitions than for n–2 switches (
, 95%CI 0.254, 0.449). The interaction parameter was reliably different from zero (
, 95%CI −1.047, −0.742). In contrast to the response time analysis, this interaction was driven by larger n–2 repetition costs for n–2 response repetitions (3.0%, reliably different from zero,
, 95%CI 0.710, 0.976) than for n–2 response switches (0.1%, not reliably different from zero,
, 95%CI −0.040, 0.116).
3.3. Individual-level analysis
A Bayesian multilevel regression was performed on the trial-level RT data to obtain model estimates of participants' true n–2 task repetition costs for both n–2 response repetitions and n–2 response switches. Individual trial-level response time was predicted from sequence and response, together with a term for their interaction; random intercepts were included per participant, as well as random slopes for sequence, response, and the interaction per participant. These random effects were used to estimate true n–2 task repetition costs for each participant for n–2 response repetitions and n–2 response switches.
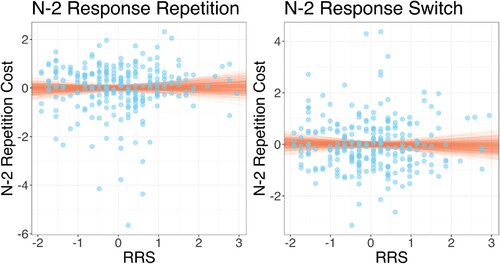
These estimated n–2 task repetition costs were used as outcome variables in separate regression models (one for each level of n–2 response) which predicted n–2 task repetition cost from RRS scores and BDI scores. All variables were standardised before entering the regression analysis. The results are visualised in . The analysis showed that for n–2 response repetitions, there was no evidence for an association between n–2 task repetition cost and RRS (, 95%CI −0.206, 0.122) or BDI (
, 95%CI −0.081, 0.247). For n–2 response switches, the same partern was found: There was no evidence for an association between the n–2 repetition cost and RRS (
, 95%CI −0.179, 0.149) or BDI (
, 95%CI −0.191, 0.142).
Figure 3. Individual participant rumination response scale (RRS) scores plotted against (log) n–2 task repetition costs for n–2 response repetitions (left plot) and n–2 response switches (right plot). Note that all variables are standardised. Points show individual participant data; lines show random draws from the posterior distribution of the association between RRS and n–2 task repetition costs.
3.4. A note on the difference in the RRS predictors
The primary research aim was to establish the association between n–2 task repetition costs and RRS for episodic matches (n–2 response repetitions) and episodic mismatches (n–2 response switches). The previous section has found no evidence for an association for either n–2 response switches (i.e. was −0.041 and not reliably different from zero) or for n–2 response repetitions (i.e.
was −0.013 and not reliably different from zero).
Although the question of whether is different across levels of n–2 response is not pertinent to the main research aim, the difference in
can be estimated by an additional Bayesian regression, predicting n–2 task repetition costs from RRS scores, BDI scores, the binary predictor of n–2 response, and the interaction between RRS and response. Of interest is the β value associated with the interaction term; if it is reliably different from zero, it suggests the β values for the predictor RRS change across levels of n–2 response repetition. This analysis showed that the interaction term was not reliably different from zero (
, 95%CI −0.209, 0.0.130) suggesting n–2 response repetition does not change the predictive ability of RRS scores on the n–2 task repetition cost.
3.5. Exploratory analysis
The analysis in this section was not part of the pre-registration.
3.5.1. Accuracy individual differences
The aggregate analysis reported above showed an n–2 repetition cost in the accuracy data, but only for n–2 response repetitions. Despite there being no evidence for an association between RRS scores and n–2 repetition costs for the response time data, it remains possible that an association exists between n–2 repetition costs and the RRS for accuracy dataFootnote5.
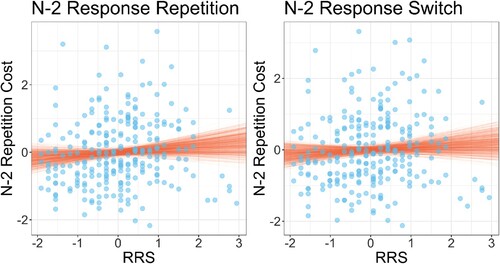
Individual trial-level accuracy was predicted from sequence and response, together with a term for their interaction; random intercepts were included per participant, as well as random slopes for sequence, response, and the interaction per participant. As with the response time individual level analysis, these random effects were used to estimate true n–2 task repetition costs in accuracy for each participant for n–2 response repetitions and n–2 response switches. These estimated n–2 task repetition costs were used as outcome variables in separate regression models (one for each level of n–2 response) which predicted n–2 task repetition cost from RRS scores and BDI scores. All variables were standardised before entering the regression analysis. As individual trail accuracy is either correct or incorrect, the regression modelled the data as a bernoulli distribution. The analysis showed that for n–2 response repetitions, there was no evidence for an association between n–2 task repetition cost and RRS (, 95%CI −0.072, 0.248) or BDI (
, 95%CI −0.124, 0.196). For n–2 response switches, the same pattern was found: There was no evidence for an association between the n–2 repetition cost and RRS (
, 95%CI −0.093, 0.224) or BDI (
, 95%CI −0.116, 0.204).
Additional analysis was conducted to assess whether the predictive ability of rumination on the n–2 task repetition cost (i.e. ) is different across levels of n–2 response. As before, this consisted of an additional Bayesian regression, predicting n–2 task repetition costs from RRS scores, BDI scores, the binary predictor of n–2 response, and the interaction between RRS and response. This analysis showed that the interaction term was not reliably different from zero (
, 95%CI −0.209, 0.0.130) suggesting n–2 response repetition does not change the predictive ability of RRS scores on the n–2 task repetition cost for accuracy.
3.5.2. Average n–2 task repetition cost
This analysis wished to explore whether the average n–2 task repetition cost – that is, ignoring the factor of response – was associated with RRS scores. This analysis therefore provides a replication attempt of the original finding of Whitmer and Banich (Citation2007). A Bayesian regression was conducted predicting average n–2 task repetition costs from RRS and BDI scores (all standardised). The analysis showed that there was no evidence for an association between n–2 task repetition cost and RRS (, 95%CI
, 0.122) or BDI (
, 95%CI
, 0.229).
3.5.3. Questionnaire scores
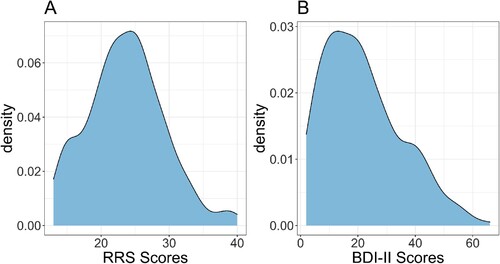
The density distributions of RRS and BDI-II scores can be seen in . Both the RRS (Range = 13–40; Mean = 23.63; Median = 24; SD = 5.56) and the BDI-II (Range = 2–63; Mean = 21.65; Median = 20; SD = 13.56) showed a good spread of scores. Whilst there are no criteria for different levels of rumination using the RRS, for the BDI-II the responses showed 33.33% of respondents had minimal depression, 15.29% had mild depression, 23.53% had moderate depression, and 27.84% had severe depression. A Bayesian regression of standardised RRS and BDI-II scores showed that RRS scores could be predicted from BDI scores (, 95%CI 0.546, 0.737). These analyses provide a sense check on the questionnaire data (i.e. that RRS and BDI-II are associated, as expected) and shows the sample captured a wide range of rumination and depression scores.
Figure 4. Density plots of the rumination response scale (RRS) scores (Panel A) and Beck-Depression Inventory-II (BDI-II) scores (Panel B).
3.5.4. Separation of the RRS into components
The RRS is thought to consist of two distinct components: One measuring brooding, and one measuring reflection (Treynor et al., Citation2003; but see Whitmer & Gotlib, Citation2011 for a potential exception to this in currently depressed individuals). To examine whether n–2 task repetition costs were differentially associated with the brooding and reflection components of the RRS, separate analyses for each component were conductedFootnote6.
Specifically, participants' RRS scores were recalculated to quantify levels of brooding and reflection. These separate scores were then used as predictors in a Bayesian regression predcting n–2 task repetition costs (separately for n–2 response repetitions and n–2 response switches) from the RRS component and BDI scoresFootnote7 (all variables were again standardised). The results are shown in .
Figure 5. Individual participant scores for the Brooding and Reflection components of the rumination response scale (RRS) scores plotted against (log) n–2 task repetition costs for n–2 response repetitions (left plots) and n–2 response switches (right plots). Note that all variables are standardised. Points show individual participant data; lines show random draws from the posterior distribution of the association between RRS-component score and n–2 task repetition costs.
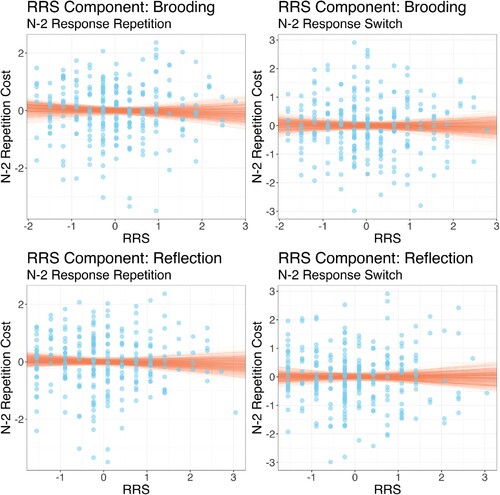
The analysis showed that there was no evidence for an association either component and n–2 task repetition costs for n–2 response repetitions (, 95%CI
, 0.131;
, 95%CI
, 0.124) or n–2 task repetition costs for n–2 response switches (
, 95%CI
, 0.148;
, 95%CI
, 0.133).
4. General discussion
The present study sought to re-examine the question of the association between rumination and the n–2 task repetition cost, though to measure cognitive inhibition during task switching (Koch et al., Citation2010; Mayr & Keele, Citation2000; Sexton & Cooper, Citation2017). The study offers an improvement over previous studies in several ways. First, the analysis reduced the potential impact of trial-level noise on estimates of n–2 task repetition costs at the individual participant level via use of Bayesian multilevel regression models (Rouder & Haaf, Citation2019; Rouder et al., Citation2019). Second, the present study controlled for the impact of episodic retrieval effects on estimates of the n–2 task repetition cost (Grange et al., Citation2017). An additional methodological improvement is that immediate task repetitions were not allowed. This scenario has been shown to increase measures of the n–2 task repetition cost, thought to be due to the cognitive system shifting the balance between task activation and task inhibition in favour of inhibition when immediate repetitions are not detected by the system (Philipp & Koch, Citation2006).
The results showed robust n–2 task repetition costs that were strongly influenced by episodic retrieval effects, replicating previous work (Grange, Citation2018a; Grange et al., Citation2019, Citation2017; Kowalczyk & Grange, Citation2019). For the response time analysis, the results showed a large n–2 task repetition for cost episodic mismatches (i.e. n–2 response switches) and a small, non-reliable n–2 task repetition cost for episodic matches (i.e. n–2 response repetitions). For the accuracy data, the opposite was true: There was no evidence for an n–2 task repetition cost for episodic mismatches, but there was an n–2 task repetition cost for episodic matches. This latter finding is not typical based on previous work, and could potentially reflect a speed – accuracy trade off in the interaction between episodic retrieval and inhibitory effects in task switching. At the individual-difference level, there was no evidence for an association between n–2 task repetition costs and self-report measures of rumination (not for episodic matches, not for episodic mismatches, and not for n–2 repetition costs ignoring episodic match). Therefore the current study has not been able to replicate previous work which reported a negative association between measures of task inhibition and rumination (De Lissnyder et al., Citation2010; Whitmer & Banich, Citation2007; Whitmer & Gotlib, Citation2012).
There could be several plausible explanations for why the current study did not find an association between self-report measures of rumination and measures of task inhibition. One straightforward possibility is that there is no true association between rumination and n–2 task repetition costs, which was then reflected in the results of the current study. There have been many reports of failures to replicate findings in psychology and other disciplines (e.g. Open Science Collaboration, Citation2015), so this possibility requires serious consideration. The current study utilised a large sample size that was sensitive to finding a true association smaller than that reported in previous research (see Appendix 1), so it is unlikely – but of course possible – that the current results represent a type-2 error. Future replications might be warranted to address this question.
There were also paradigm differences which could potentially lead to the different outcomes across studies. The current study utilised a “rule-switching” paradigm introduced by Mayr (Citation2002). This paradigm has been shown to produce standard task switching effects, such as the switch cost, preparation effects, and response-repetition effects (Mayr & Bryck, Citation2005) as well as n–2 task repetition costs (Grange, Citation2018a; Grange et al., Citation2019, Citation2017; Kowalczyk & Grange, Citation2019; Mayr, Citation2002). Previous work examining the association between rumination and the n–2 task repetition cost have used different paradigms; for example, Whitmer and Banich (Citation2007; see also Whitmer & Gotlib, Citation2012) used a target localisation paradigm introduced by Mayr and Keele (Citation2000), and De Lissnyder et al. (Citation2010) adapted this target localisation paradigm to include emotionally valenced targets. There is no clear theoretical reason why these paradigm differences would lead to different outcomes regarding the association between rumination and the n–2 task repetition cost, but it remains a possibility.
4.1. Limitations
There exist several limitations of the current study which should be considered. First, in contrast to previous research on this question, the current study recruited an online sample of participants which could lead to concerns about data quality. However, there is evidence that online data tends to be of high quality when utilising various cognitive experimental paradigms (Anwyl-Irvine et al., Citation2020; Crump et al., Citation2013). In addition, the behavioural data in the current study was of a high quality suggesting this was not likely an issue. For example, overall error rates were low, response time variance was typical, and the study revealed reliable n–2 task repetition costs together with replication of the interaction with episodic retrieval effects. The current sample also demonstrated a wide range of rumination and depression self assessment scores, so the lack of an association between rumination and n–2 task repetition cost cannot be explained by insufficient variability and range in rumination scores.
The current study addressed a limitation of attempting to measure individual differences in inhibition by using multilevel linear modelling (Rouder & Haaf, Citation2019; Rouder et al., Citation2019). This statistical approach reduces the impact of trial-level measurement error in estimating each participant's true n–2 task repetition costs. But utilising this improved estimate of n–2 task repetition costs at the individual level does not help if the n–2 task repetition itself does not actually measure cognitive inhibition. That is, if there is a true association between rumination and cognitive inhibition, but the n–2 task repetition cost does not actually measure cognitive inhibition, then one would not expect an association between the two. In previous work (and in the current study) it has been shown that a proportion of the n–2 task repetition cost can be explained by non-inhibitory processes (Grange, Citation2018a; Grange et al., Citation2019, Citation2017; Kowalczyk & Grange, Citation2019); it could be that other non-inhibitory processes contribute (either partially or fully) to the n–2 task repetition cost too.
Therefore it remains plausible that a true association might exist between rumination and cognitive inhibition, but that the n–2 task repetition cost does not measure cognitive inhibition effectively. Indeed, many studies have examined the association between rumination and inhibition using other experimental paradigms thought to measure cognitive inhibition (see e.g. Daches & Mor, Citation2014; Ganor et al., Citation2023; Grant et al., Citation2021; Joormann, Citation2005, Citation2006; Joormann & Tran, Citation2009; Koster et al., Citation2011), but establishing a causal relationship between cognitive inhibition and rumination has proved challenging (see Roberts et al., Citation2016).
An alternative approach that could be taken by future studies is to expose participants to a battery of tasks thought to tap cognitive inhibition and to explore at the latent variable level the association between inhibition and ruminationFootnote8. However, it should be noted that the concept of cognitive inhibition more broadly has recently been called into question using a similar latent variable approach. For example, Rey-Mermet et al. (Citation2018) presented participants with a battery of eleven tasks thought to measure cognitive inhibition (including the n–2 task repetition paradigm) and used structural equation modelling in an attempt to establish a latent factor for inhibition. However, the authors reported an inability to establish a clear reliable latent factor for inhibition, leading to the conclusion that inhibition as a psychometric construct is questionable.
Given that a deficit in cognitive inhibition has been proposed as a key cognitive mechanism contributing to rumination (Whitmer & Gotlib, Citation2012, Citation2013), this might require serious reconsideration if cognitive inhibition itself is not a reliable psychometric construct.
Disclosure statement
No potential conflict of interest was reported by the author(s).
Data availability statement
All data and analysis scripts can be downloaded from https://osf.io/fs964/.
Additional information
Funding
Notes
1 Whitmer and Gotlib (Citation2012) reported an regression coefficient of , but it was not clear whether this is standardised. The t-value of this association was
with 67 degrees of freedom. I therefore calculated the correlation coefficient via
and then took the sign of t.
2 This allowed full counterbalancing of the order of presentation of study materials to control for potential ordering effects.
3 Specifically, I used R (Version 4.2.1; R Core Team, Citation2020) and the R-packages afex (Version 1.2.0; Singmann et al., Citation2020), brms (Version 2.18.0; Bürkner, Citation2017, Citation2018), dplyr (Version 1.0.10; Wickham et al., Citation2021), faux (Version 1.1.0; DeBruine, Citation2021), forcats (Version 0.5.2; Wickham, Citation2020), ggplot2 (Version 3.3.6; Wickham, Citation2016), lme4 (Version 1.1.31; Bates et al., Citation2015), MASS (Version 7.3.57; Venables & Ripley, Citation2002), Matrix (Version 1.5.1; Bates & Maechler, Citation2019), papaja (Version 0.1.1; Aust & Barth, Citation2020), patchwork (Version 1.1.2; Pedersen, Citation2020), purrr (Version 0.3.5; Henry & Wickham, Citation2020), Rcpp (Eddelbuettel & Balamuta, Citation2018; Version 1.0.9; Eddelbuettel & François, Citation2011), readr (Version 2.1.3; Wickham et al., Citation2018), stringr (Version 1.4.1; Wickham, Citation2019), tibble (Version 3.1.8; Mller and Wickham (Citation2021)), tidybayes (Version 3.0.2; Kay, Citation2020), tidyr (Version 1.2.1; Wickham, Citation2021), tidyverse (Version 1.3.2; Wickham et al., Citation2019), tinylabels (Version 0.2.3; Barth, Citation2020), and trimr (Version 1.1.1; Grange, Citation2018b).
4 Response times were log-transformed for several reasons. As the main analysis centres on analysis of trial-level data, log-transformation to some extent deals with the positive skew typically found in response time distributions. In addition, the main outcome of this task switching design is a comparison of the magnitude of n–2 task repetition costs for n–2 response repetitions and n–2 response switches (i.e. an interaction). Log-transformation of RTs is one recommended strategy to deal with so-called “removable interactions” (Wagenmakers et al., Citation2012). Note that in Appendix 2, I report a repetition of the main response time analysis without log-transformation and find qualitatively identical results.
5 Individual difference analysis of the accuracy data was not included in the pre-registration as n–2 task repetition costs are more consistently found for response time data, and less so in accuracy data. Indeed, the studies discussed in the introduction examining the association between rumination and inhibition in task switching (De Lissnyder et al., Citation2010; Whitmer & Banich, Citation2007; Whitmer & Gotlib, Citation2012) focussed their analysis exclusively on response time data. To address this question, a Bayesian multilevel regression was performed on the trial-level accuracy data to obtain model estimates of participants' true n–2 task repetition costs for both n–2 response repetitions and n–2 response switches.
6 Thank you to an anonymous reviewer for suggesting this analysis.
7 Note that removing BDI as a covariate led to qualitatively identical results.
8 Note that when variables are standardised in a regression model (i.e. transformed to have a mean of zero and a standard deviation of one), β in a linear regression is equal to the correlation coefficient r. We can therefore use r to estimate likely values for .
References
- Anwyl-Irvine, A. L., Massonnié, J., Flitton, A., Kirkham, N., & Evershed, J. K. (2020). Gorilla in our midst: An online behavioral experiment builder. Behavior Research Methods, 52(1), 388–407. https://doi.org/10.3758/s13428-019-01237-x
- Aust, F., & Barth, M. (2020). Papaja: Prepare reproducible APA journal articles with R Markdown. https://github.com/crsh/papaja
- Bagby, R. M., Rector, N. A., Bacchiochi, J. R., & McBride, C. (2004). The stability of the response styles questionnaire rumination scale in a sample of patients with major depression. Cognitive Therapy and Research, 28(4), 527–538. https://doi.org/10.1023/B:COTR.0000045562.17228.29
- Barth, M. (2020). Tinylabels: Lightweight variable labels. https://CRAN.R-project.org/package=tinylabels
- Bates, D., Mächler, M., Bolker, B., & Walker, S. (2015). Fitting linear mixed-effects models using lme4. Journal of Statistical Software, 67(1), 1–48. https://doi.org/10.18637/jss.v067.i01
- Bates, D., & Maechler, M. (2019). Matrix: Sparse and dense matrix classes and methods. https://CRAN.R-project.org/package=Matrix
- Beck, A. T., Steer, R. A., & Brown, G. K. (1996). Beck depression inventory manual (2nd ed.). Psychological Corportation.
- Bürkner, P.-C. (2017). Brms: An R package for Bayesian multilevel models using Stan. Journal of Statistical Software, 80(1), 1–28. https://doi.org/10.18637/jss.v080.i01
- Bürkner, P.-C. (2018). Advanced Bayesian multilevel modeling with the R package brms. The R Journal, 10(1), 395–411. https://doi.org/10.32614/RJ-2018-017
- Crump, M. J. C., McDonnell, J. V., & Gureckis, T. M. (2013). Evaluating Amazon's mechanical turk as a tool for experimental behavioral research. PloS One, 8(3), e57410. https://doi.org/10.1371/journal.pone.0057410
- Daches, S., & Mor, N. (2014). Training ruminators to inhibit negative information: A preliminary report. Cognitive Therapy and Research, 38(2), 160–171. https://doi.org/10.1007/s10608-013-9585-5
- DeBruine, L. (2021). Faux: Simulation for factorial designs. Zenodo. https://doi.org/10.5281/zenodo.2669586
- De Lissnyder, E., Koster, E. H. W., Derakshan, N., & De Raedt, R. (2010). The association between depressive symptoms and executive control impairments in response to emotional and non-emotional information. Cognition and Emotion, 24(2), 264–280. https://doi.org/10.1080/02699930903378354
- Dozois, D. J. A., Dobson, K. S., & Ahnberg, J. L. (1998). A psychometric evaluation of the beck depression inventory–II. Psychological Assessment, 10(2), 83–89. https://doi.org/10.1037/1040-3590.10.2.83
- Eddelbuettel, D., & Balamuta, J. J. (2018). Extending R with C++: A brief introduction to Rcpp. The American Statistician, 72(1), 28–36. https://doi.org/10.1080/00031305.2017.1375990
- Eddelbuettel, D., & François, R. (2011). Rcpp: seamless R and C++ integration. Journal of Statistical Software, 40(8), 1–18. https://doi.org/10.18637/jss.v040.i08
- Faul, F., Erdfelder, E., Buchner, A., & Lang, A.-G. (2009). Statistical power analyses using G*Power 3.1: Tests for correlation and regression analyses. Behavior Research Methods, 41(4), 1149–1160. https://doi.org/10.3758/BRM.41.4.1149
- Friedman, N. P., & Miyake, A. (2004). The relations among inhibition and interference control functions: A latent-variable analysis. Journal of Experimental Psychology General, 133(1), 101–135. https://doi.org/10.1037/0096-3445.133.1.101
- Ganor, T., Mor, N., & Huppert, J. D. (2023). Effects of rumination and distraction on inhibition. Journal of Behavior Therapy and Experimental Psychiatry, 78, 101780. https://doi.org/10.1016/j.jbtep.2022.101780
- Gelman, A., & Carlin, J. (2014). Beyond power calculations: Assessing type s (sign) and type m (magnitude) errors. Perspectives on Psychological Science, 9(6), 641–651. https://doi.org/10.1177/1745691614551642
- Gorfein, D. S., & MacLeod, C. M. (2007). Inhibition in cognition. American Psychological Association.
- Grange, J. A. (2018a). Does task activation in task switching influence inhibition or episodic interference? Experimental Psychology, 65(6), 393–404. https://doi.org/10.1027/1618-3169/a000423
- Grange, J. A. (2018b). Trimr: An implementation of common response time trimming methods. https://cran.r-project.org/web/packages/trimr/index.html
- Grange, J. A., & Houghton, G. (2014). Task switching and cognitive control. Oxford University Press.
- Grange, J. A., Kedra, P., & Walker, A. (2019). The effect of practice on inhibition in task switching: Controlling for episodic retrieval. Acta Psychologica, 192, 59–72. https://doi.org/10.1016/j.actpsy.2018.10.006
- Grange, J. A., Kowalczyk, A. W., & O'Loughlin, R. (2017). The effect of episodic retrieval on inhibition in task switching. Journal of Experimental Psychology Human Perception and Performance, 43(8), 1568–1583. https://doi.org/10.1037/xhp0000411
- Grant, D. M., Mills, A. C., Judah, M. R., & White, E. J. (2021). State and trait effects of rumination on inhibitory processes in memory. Current Psychology, 40(10), 4875–4883. https://doi.org/10.1007/s12144-019-00432-5
- Hedge, C., Powell, G., & Sumner, P. (2018). The reliability paradox: Why robust cognitive tasks do not produce reliable individual differences. Behavior Research Methods, 50(3), 1166–1186. https://doi.org/10.3758/s13428-017-0935-1
- Henry, L., & Wickham, H. (2020). Purrr: Functional programming tools. https://CRAN.R-project.org/package=purrr
- Hommel, B. (1998). Event files: Evidence for automatic integration of stimulus-response episodes. Visual Cognition, 5(1-2), 183–216. https://doi.org/10.1080/713756773
- Hommel, B. (2004). Event files: Feature binding in and across perception and action. Trends in Cognitive Sciences, 8(11), 494–500. https://doi.org/10.1016/j.tics.2004.08.007
- Joormann, J. (2005). Inhibition, rumination, and mood regulation in depression. In D. N. McIntosh, G. Sedek, R. W. Engle, & U. von Hecker (Eds.), Cognitive limitations in aging and psychopathology (pp. 275–312). Cambridge University Press.
- Joormann, J. (2006). Differential effects of rumination and dysphoria on the inhibition of irrelevant emotional material: Evidence from a negative priming task. Cognitive Therapy and Research, 30(2), 149–160. https://doi.org/10.1007/s10608-006-9035-8
- Joormann, J., & Quinn, M. E. (2014). Cognitive processes and emotion regulation in depression. Depression and Anxiety, 31(4), 308–315. https://doi.org/10.1002/da.2014.31.issue-4
- Joormann, J., & Tran, T. B. (2009). Rumination and intentional forgetting of emotional material. Cognition and Emotion, 23(6), 1233–1246. https://doi.org/10.1080/02699930802416735
- Kay, M. (2020). tidybayes: Tidy data and geoms for Bayesian models. https://doi.org/10.5281/zenodo.1308151
- Kiesel, A., Steinhauser, M., Wendt, M., Falkenstein, M., Jost, K., Philipp, A. M., & Koch, I. (2010). Control and interference in task switching – a review. Psychological Bulletin, 136(5), 849–874. https://doi.org/10.1037/a0019842
- Koch, I., Gade, M., Schuch, S., & Philipp, A. M. (2010). The role of inhibition in task switching: A review. Psychonomic Bulletin & Review, 17(1), 1–14. https://doi.org/10.3758/PBR.17.1.1
- Koster, E. H. W., De Lissnyder, E., Derakshan, N., & De Raedt, R. (2011). Understanding depressive rumination from a cognitive science perspective: The impaired disengagement hypothesis. Clinical Psychology Review, 31(1), 138–145. https://doi.org/10.1016/j.cpr.2010.08.005
- Kowalczyk, A. W., & Grange, J. A. (2019). The effect of episodic retrieval on inhibition in task switching: A diffusion model analysis. Psychological Research, 84(7), 1965–1999. https://doi.org/10.1007/s00426-019-01206-1
- Kruschke, J. K., & Liddell, T. M. (2018). The bayesian new statistics: Hypothesis testing, estimation, meta-analysis, and power analysis from a bayesian perspective. Psychonomic Bulletin & Review, 25(1), 178–206. https://doi.org/10.3758/s13423-016-1221-4
- Logan, G. D. (1988). Toward an instance theory of automatization. Psychological Review, 95(4), 492–527. https://doi.org/10.1037/0033-295X.95.4.492
- Logan, G. D. (2002). An instance theory of attention and memory. Psychological Review, 109(2), 376–400. https://doi.org/10.1037/0033-295X.109.2.376
- Logan, G. D., & Gordon, R. D. (2001). Executive control of visual attention in dual-task situations. Psychological Review, 108(2), 393–434. https://doi.org/10.1037/0033-295X.108.2.393
- Lyubomirsky, S., & Nolen-Hoeksema, S. (1993). Self-perpetuating properties of dysphoric rumination. Journal of Personality and Social Psychology, 65(2), 339–349. https://doi.org/10.1037/0022-3514.65.2.339
- Mayr, U. (2002). Inhibition of action rules. Psychonomic Bulletin & Review, 9(1), 93–99. https://doi.org/10.3758/BF03196261
- Mayr, U., & Bryck, R. L. (2005). Sticky rules: Integration between abstract rules and specific actions. Journal of Experimental Psychology Learning, Memory, and Cognition, 31(2), 337–350. https://doi.org/10.1037/0278-7393.31.2.337
- Mayr, U., & Keele, S. W. (2000). Changing internal constraints on action: The role of backward inhibition. Journal of Experimental Psychology: General, 129(1), 4–26. https://doi.org/10.1037/0096-3445.129.1.4
- Miyake, A., Friedman, N. P., Emerson, M. J., Witzki, A. H., Howerter, A., & Wager, T. D. (2000). The unity and diversity of executive functions and their contributions to complex ‘frontal lobe’ tasks: A latent variable analysis. Cognitive Psychology, 41(1), 49–100. https://doi.org/10.1006/cogp.1999.0734
- Müller, K., & Wickham, H. (2021). Tibble: Simple data frames. https://CRAN.R-project.org/package=tibble
- Nieuwenhuis, S., Forstmann, B. U., & Wagenmakers, E.-J. (2011). Erroneous analyses of interactions in neuroscience: A problem of significance. Nature Neuroscience, 14(9), 1105–1107. https://doi.org/10.1038/nn.2886
- Nolen-Hoeksema, S., & Davis, C. G. (1999). ‘Thanks for sharing that’: Ruminators and their social support networks. Journal of Personality and Social Psychology, 77(4), 801–814. https://doi.org/10.1037/0022-3514.77.4.801
- Nolen-Hoeksema, S., & Morrow, J. (1991). A prospective study of depression and posttraumatic stress symptoms after a natural disaster: The 1989 Loma Prieta Earthquake. Journal of Personality and Social Psychology, 61(1), 115–121. https://doi.org/10.1037/0022-3514.61.1.115
- Nolen-Hoeksema, S., Wisco, B. E., & Lyubomirsky, S. (2008). Rethinking rumination. Perspectives on Psychological Science, 3(5), 400–424. https://doi.org/10.1111/j.1745-6924.2008.00088.x
- Norman, D. A., & Shallice, T. (1986). Attention to action: Willed and automatic control of behavior. In R. J. Davidson, G. E. Schwartz, & D. Shapiro (Eds.), Consciousness and self-regulation: Advances in research and theory (pp. 1–18). Plenum.
- Open Science Collaboration (2015). Estimating the reproducibility of psychological science. Science (New York, N.Y.), 349(6251), aac4716. https://doi.org/10.1126/science.aac4716
- Pedersen, T. L. (2020). Patchwork: The composer of plots. https://CRAN.R-project.org/package=patchwork
- Philipp, A. M., & Koch, I. (2006). Task inhibition and task repetition in task switching. European Journal of Cognitive Psychology, 18(4), 624–639. https://doi.org/10.1080/09541440500423269
- R Core Team (2020). R: A language and environment for statistical computing. R Foundation for Statistical Computing. https://www.R-project.org/
- Rey-Mermet, A., Gade, M., & Oberauer, K. (2018). Should we stop thinking about inhibition? Searching for individual and age differences in inhibition ability. Journal of Experimental Psychology: Learning, Memory, and Cognition, 44(4), 501–526. https://doi.org/10.1037/xlm0000450
- Roberts, H., Watkins, E. R., & Wills, A. J. (2016). Does rumination cause ‘inhibitory’ deficits? Psychopathology Review, 4(3), 341–376. https://doi.org/10.5127/pr.036914
- Rouder, J. N., & Haaf, J. M. (2019). A psychometrics of individual differences in experimental tasks. Psychonomic Bulletin & Review, 26(2), 452–467. https://doi.org/10.3758/s13423-018-1558-y
- Rouder, J. N., Kumar, A., & Haaf, J. M. (2019). Why most studies of individual differences with inhibition tasks are bound to fail. Preprint. https://doi.org/10.31234/osf.io/3cjr5
- Scheil, J., & Kleinsorge, T. (2019). Effects of global and local task repetition proportion on n–2 repetition costs. Quarterly Journal of Experimental Psychology, 72(3), 579–588. https://doi.org/10.1177/1747021818762087
- Sexton, N. J., & Cooper, R. P. (2017). Task inhibition, conflict, and the n–2 repetition cost: A combined computational and empirical approach. Cognitive Psychology, 94, 1–25. https://doi.org/10.1016/j.cogpsych.2017.01.003
- Singmann, H., Bolker, B., Westfall, J., Aust, F., & Ben-Shachar, M. S. (2020). Afex: Analysis of factorial experiments. https://CRAN.R-project.org/package=afex
- Treynor, W., Gonzalez, R., & Nolen-Hoeksema, S. (2003). Rumination reconsidered: A psychometric analysis. Cognitive Therapy and Research, 27(3), 247–259. https://doi.org/10.1023/A:1023910315561
- Vandierendonck, A., Liefooghe, B., & Verbruggen, F. (2010). Task switching: Interplay of reconfiguration and interference control. Psychological Bulletin, 136(4), 601–626. https://doi.org/10.1037/a0019791
- Venables, W. N., & Ripley, B. D. (2002). Modern applied statistics with S-PLUS (4th ed.). Springer.
- Wagenmakers, E.-J., & Farrell, S. (2004). AIC model selection using Akaike weights. Psychonomic Bulletin & Review, 11(1), 192–196. https://doi.org/10.3758/BF03206482
- Wagenmakers, E.-J., Krypotos, A.-M., Criss, A. H., & Iverson, G. (2012). On the interpretation of removable interactions: A survey of the field 33 years after Loftus. Memory & Cognition, 40(2), 145–160. https://doi.org/10.3758/s13421-011-0158-0
- Whitmer, A., & Gotlib, I. H. (2011). Brooding and reflection reconsidered: A factor analytic examination of rumination in currently depressed, formerly depressed, and never depressed individuals. Cognitive Therapy and Research, 35(2), 99–107. https://doi.org/10.1007/s10608-011-9361-3
- Whitmer, A. J., & Banich, M. T. (2007). Inhibition versus switching deficits in different forms of rumination. Psychological Science, 18(6), 546–553. https://doi.org/10.1111/j.1467-9280.2007.01936.x
- Whitmer, A. J., & Gotlib, I. H. (2012). Switching and backward inhibition in major depressive disorder: The role of rumination. Journal of Abnormal Psychology, 121(3), 570��578. https://doi.org/10.1037/a0027474
- Whitmer, A. J., & Gotlib, I. H. (2013). An attentional scope model of rumination. Psychological Bulletin, 139(5), 1036–1061. https://doi.org/10.1037/a0030923
- Wickham, H. (2016). ggplot2: Elegant graphics for data analysis. Springer-Verlag.
- Wickham, H. (2019). Stringr: Simple, consistent wrappers for common string operations. https://CRAN.R-project.org/package=stringr
- Wickham, H. (2020). Forcats: Tools for working with categorical variables (factors). https://CRAN.R-project.org/package=forcats
- Wickham, H. (2021). Tidyr: Tidy messy data. https://CRAN.R-project.org/package=tidyr
- Wickham, H., Averick, M., Bryan, J., Chang, W., McGowan, L. D., François, R., Grolemund, G., Hayes, A., Henry, L., Hester, J., & Kuhn, M. (2019). Welcome to the tidyverse. Journal of Open Source Software, 4(43), 1686. https://doi.org/10.21105/joss
- Wickham, H., François, R., Henry, L., & Müller, K. (2021). Dplyr: A grammar of data manipulation. https://CRAN.R-project.org/package=dplyr
- Wickham, H., Hester, J., & Francois, R. (2018). Readr: Read rectangular text data. https://CRAN.R-project.org/package=readr
- Yang, Y., Cao, S., Shields, G. S., Teng, Z., & Liu, Y. (2017). The relationships between rumination and core executive functions: A meta-analysis. Depression and Anxiety, 34(1), 37–50. https://doi.org/10.1002/da.2017.34.issue-1
- Zetsche, U., Bürkner, P.-C., & Schulze, L. (2018). Shedding light on the association between repetitive negative thinking and deficits in cognitive control – a meta-analysis. Clinical Psychology Review, 63, 56–65. https://doi.org/10.1016/j.cpr.2018.06.001
- Zetsche, U., D'Avanzato, C., & Joormann, J. (2012). Depression and rumination: Relation to components of inhibition. Cognition and Emotion, 26(4), 758–767. https://doi.org/10.1080/02699931.2011.613919
Appendices
Appendix 1.
Sample size planning
Sample size was determined via a series of exploratory simulations within a Bayesian framework assessing the adequacy of a planned sample size of N = 250. The purpose of these simulations was to assess whether the planned sample size could reliably detect the expected effect size of interest.
The main research aim centres around estimating the association between the n–2 task repetition cost and measures of rumination via the rumination response scale (RRS) for both n–2 response repetitions (episodic match trials) and n–2 response switch trials (episodic mismatch trials). Within a regression framework, we are therefore interested in estimating the population-level parameter for n–2 response repetitions and for n–2 response switches, which represents the true slope of the linear relationship between RRS and n–2 task repetition cost. The current study will estimate plausible values for
by taking a sample from the population (e.g. N = 250) and measuring the strength of association within that sample (via the regression model parameter β). The posterior distribution of β provides plausible values for
.
In order to establish whether is different from zero – that is, to establish whether there is indeed a true association between n–2 task repetition costs and RRS – we can assess whether zero is included within the 95% credible interval of the posterior distribution of β. If zero is contained within the credible interval, we cannot exclude this as a possible value for
(and hence, we cannot exclude the possibility that there is no association in the population). Note that this is equivalent to two-tailed power analysis within the frequentist framework. However, given that extant studies have found a negative association between inhibition and RRS (Whitmer & Banich, Citation2007; Whitmer & Gotlib, Citation2012), an alternative approach is to assess the proportion of the posterior distribution that is below zero (i.e. in the expected direction); this is equivalent to a one-tailed power analysis.
The challenge for the sample size simulations is therefore to determine whether the planned sample size of N = 250 is sufficient to reliably detect a true effect size of interest in the population (i.e. ). In order to address this, we first need to establish what the expected size of
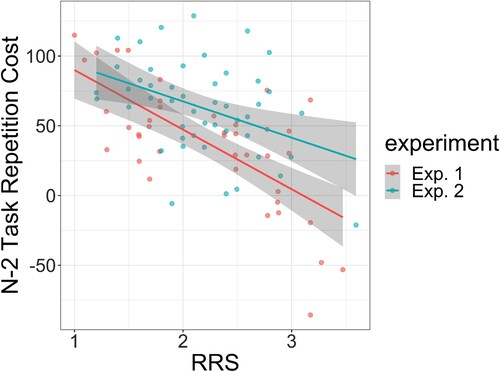
is likely to be. In Experiment 1 of Whitmer and Banich (Citation2007), the authors reported the correlation between n–2 task repetition cost and RRS to be r = −0.6938; in Experiment 2, the correlation coefficient for this relationship was not reported. However, their shows scatter plots for both experiments with data points for each participant; using the open source software WebPlotDigitizer (https://github.com/ankitrohatgi/WebPlotDigitizer) the raw data for both experiments can be recovered and reanalysed. The correlations are plotted in ; the analysis showed that r = −0.693 in Experiment 1 and r = −0.404 in Experiment 2.
Figure A1. Reanalysis of Experiments 1 and 2 from Whitmer and Banich (Citation2007). Individual points show participant scores for the rumination response scale (RRS) and their n–2 task repetition cost (in milliseconds). Lines show linear models fitted to the data, and the shading represents 95% confidence intervals around each model.
To remain conservative, I assumed that this estimate for is actually an over-estimate (e.g. Gelman & Carlin, Citation2014); this approach ensures the study is designed with enough sensitivity to reliably detect smaller effects than reported in the literature. I therefore set the effect size of interest for the sample size planning equal to
.
I now discuss the approaches we explored to assess whether N = 250 participants is sufficient to detect this effect size of interest. Although the analysis is from a Bayesian perspective, note that standard frequentist power analysis provides converging evidence as the to the adequacy of the sample size. A power analysis using G*Power (Faul et al., Citation2009) showed that N = 250 provides 94% power to detect the expected effect size of (with
). A sensitivity analysis showed that the sample size provides 95% power to detect effect sizes stronger than
, 90% to detect effects stronger than
, and 80% power to detect effects stronger than
.
A.1. Approach 1: drawing multiple random samples from the population
The first approach estimates the adequacy of the design by simulating many individual “studies”. Within each study, n–2 task repetition costs and RRS scores are simulated for N = 250 participants, with a population-level association between variables set to . Then, a Bayesian linear regression is fitted to the data, and the posterior distribution of the β parameter is explored. I recorded (a) the proportion of the posterior distribution that is below zero (i.e. one-tailed), and (b) whether zero is included in the 95% credible interval (two-tailed). This process is repeated multiple times, and the sensitivity of the sample size is estimated from evaluating (a) the average proportion of the posterior distribution found to be below zero, and (b) the proportion of studies with zero not included in the 95% credible interval.
Specifically, N = 250 n–2 task repetition costs and RRS scores were sampled from a multivariate normal distribution with means equal to zero and standard deviation equal to one (i.e. the data were simulated as standardised), with a population-level association between variables set to . (Note that as it is the population-level association that is set to
, due to sampling error the sample association β will not necessarily equal this value.) Then the Bayesian linear regression predicting n–2 task repetition costs from RRS values was conducted (using the R package brms using its default regularising priors), and the posterior distribution of β was explored as described above. This process was then repeated for a total of 1000 simulated studies.
The results showed that across simulations, an average of 98.8% of the posterior distribution for β was below zero. In addition, 89.5% of the simulated studies had 95% credible intervals that did not include zero.
A.2. Approach 2: Kruschke and Liddell's (Citation2018) method
The next approach utilised the methods recommended by Kruschke and Liddell (Citation2018), which proceeds via several steps visualised in . In Step 0 (not visualised), a population-level effect size is selected as the effect size of interest, which has been set to
. Then in Step 1, idealised data are simulated reflecting the statistical properties of this effect size of interest: data from N = 250 participants were simulated for two standardised variables from a multivariate normal distribution with an empirical association between variables set to
. A Bayesian regression was then fitted to this data, which provides a posterior distribution of estimates of
in the slope parameter β. These are shown as blue lines in Step 1 of , and reflect plausible regression slopes of the true association between the variables.
Figure A2. Schematic example of the steps applied to conduct sample size planning for Bayesian linear regression. See text for details.
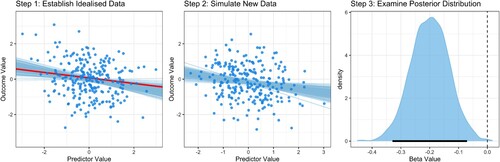
In Step 2, new sample data is simulated using these plausible regression parameter values. Specifically, one of the regression lines from Step 1 is randomly selected (shown as the red line in Step 1 of ), and the slope of this regression line (β) is used as the association value between variables when generating data from the multivariate normal distribution. The new sample data is generated to have N = 250 data points, which is the sample size under investigation. Once the new sample data is generated, again the Bayesian regression is fit to this data.
Once fit, in Step 3 the posterior distribution of β is explored to assess whether the research aims have been met. Specifically, I recorded the proportion of the posterior distribution which is below zero (i.e. one-tailed) and whether the 95% credible interval of the distribution includes zero (two-tailed; shown in ). Once recorded, a new randomly selected regression line from Step 1 is used to generate new data in Step 2, and again fitted with the Bayesian model. This process is repeated for a total of 1000 times.
The analysis showed that across the 1000 simulations, on average 96.7% of the posterior distributions for β were below zero, and 81.5% of the 95% credible intervals did not include zero.
A.3. Summary
In sum, both approaches have provided converging evidence that an intended sample size of N = 250 is adequate to be able to detect true effect sizes of as small as
with good reliability.
A.4. A note on assessing differences in model parameters
Note that the sample size is determined based on my primary research aim, which is to estimate the association between n–2 task repetition costs and RRS (i.e. β in the Bayesian regression) separately for both n–2 response repetitions and n–2 response switches. The simulations have shown that a sample size of N = 250 is sufficient to detect true associations as small as with good sensitivity.
However, being able to detect individual non-zero associations with good sensitivity does not mean we have good sensitivity to detect differences in associations. That is, if the association between n–2 task repetition cost for response repetitions and RRS is given by and the association between n–2 task repetition cost for n–2 switches and RRS is given by
, the analysis so far has suggested the study has good sensitivity to detect whether either
or
are non-zero (i.e. whether there is an association present). Our analysis so far does not tell us how sensitive our design is to detect whether
is reliably different from
. More concretely, if the analysis shows that
is reliably different from zero, but
is not reliably different from zero, this tells us nothing about whether
is reliably different from
(see e.g. Nieuwenhuis et al., Citation2011).
In regression approaches, establishing whether there is a reliable difference in predictor variables can be addressed by conducting a multiple regression analysis with n–2 task repetition cost as the outcome variable, RRS as a continuous predictor variable, and “Response Repetition” as a binary predictor variable (response repetition vs. response switch); the key parameter is the interaction term between RRS and Response Repetition: if it is non-zero, the association between RRS and n–2 task repetition cost is different for response repetitions and response switches.
Sensitivity to detect interaction terms tends to be low as they are often subtler than the main effects of predictors. However, I wanted to establish whether the planned sample size of N = 250 had good sensitivity to detect an interaction in the design between RRS and response repetition.
To address this question, I simulated 1000 data sets with sample size N = 250 from the following regression model:
(A1)
(A1) where α is the intercept (ignored here due to the standardisation of variables),
is the parameter for the RRS predictor,
is the parameter for response repetition (repetition vs. switch), and
is the parameter for the interaction. In the simulation, population parameter values were
,
, and
; that is, I simulated data where there was a “true” association between n–2 task repetition cost and RRS of
for response switches, and
for response repetitions.
For each simulated data set, a Bayesian regression was fitted to the data predicting cost from the continuous predictor RRS and the binary predictor Response Repetition. I was interested in the posterior distribution of the interaction term () and the proportion of the posterior distribution that is above zero (in the expected direction). The results showed that on average, 86.63% of the posterior distribution was above zero.
Table A1. Model comparison results for the aggregate behavioural data on non-transformed response time data.
These results converge well with a similar power analysis from a frequentist perspective. Specifically, I used the R package InteractionPoweR to establish the power to detect an interaction effect size of ; the results showed that with N = 250, the study has 90.3% power.
The results of this section suggest there is good sensitivity to detect a true difference in and
if the true difference is around 0.20. However, note that if the true difference is smaller than this, sensitivity to detect it drops off considerably. For example, if the true interaction parameter is 0.15, simulations via InteractionPoweR showed that with N = 250 power drops to 66.7%, and it drops to 35.4% if the true interaction parameter is 0.10. In order to detect such a small effect size, InteractionPoweR suggests 3200 participants are required.
Appendix 2.
Analysing standard response times
In this Appendix, I report the repetition of the aggregate- and individual-level analysis on non-transformed response time data.
A.5. Aggregate-level analysis
The results of the model fitting can be seen in . For response times, the best model included both main effects of task sequence (ABA vs. CBA) and n–2 response (repetition vs. switch), plus their interaction. The interaction model (, 95%CI 1087.78, 1173.61) showed that RTs were generally faster for CBA sequences than for ABA sequences (
, 95%CI −27.98, 0.482) and were slower for n–2 response switches than for n–2 response repetitions (
, 95%CI 69.18, 97.77). The interaction parameter was reliably different from zero (
, 95%CI −124.46, −84.19) suggesting the n–2 task repetition cost was reliably smaller for n–2 response repetitions than for n–2 response switches. Follow-up analyses showed that the n–2 repetition cost for n–2 response repetitions (14ms) was not reliably different from zero (
95%CI
, 43.87), but it was for the n–2 repetition cost for n–2 response switches (118ms;
, 95%CI
,
), thus replicating the main finding of Grange et al. (Citation2017).
A.6. Individual-level analysis
A Bayesian multilevel regression was performed on the trial-level RT data to obtain model estimates of participants' true n–2 task repetition costs for both n–2 response repetitions and n–2 response switches. Individual trial-level response time was predicted from sequence and response, together with a term for their interaction; random intercepts were included per participant, as well as random slopes for sequence, response, and the interaction per participant. These random effects were used to estimate true n–2 task repetition costs for each participant for n–2 response repetitions and n–2 response switches.
These estimated n–2 task repetition costs were used as outcome variables in separate regression models (one for each level of n–2 response) which predicted n–2 task repetition cost from RRS scores and BDI scores. All variables were standardised before entering the regression analysis. The results are visualised in . The analysis showed that for n–2 response repetitions, there was no evidence for an association between n–2 task repetition cost and RRS (, 95%CI
, 0.176) or BDI (
, 95%CI
, 0.163). For n–2 response switches, the same partern was found: There was no evidence for an association between the n–2 repetition cost and RRS (
, 95%CI
, 0.137) or BDI (
, 95%CI
, 0.165).
Figure A3. Individual participant rumination response scale (RRS) scores plotted against (log) n–2 task repetition costs for n–2 response repetitions (left plot) and n–2 response switches (right plot). Note that all variables are standardised. Points show individual participant data; lines show random draws from the posterior distribution of the association between RRS and n–2 task repetition costs.