
ABSTRACT
In the past years, psychologists have been increasingly interested in feelings of “being moved” (or “touched”) and their impact on cognition and behaviour. However, to better understand their long-term impact, we need a validated measure of participants’ disposition to feel “moved”. In this paper, we introduce the Geneva Sentimentality Scale (GSS), a measure of participants’ disposition to feel moved. After describing its construction (Study 1) and confirming its structure and internal coherence (Study 2), we compare it to two other measures of participants’ disposition to feel moved: the Kama Muta Frequency scale (KAMF) and a single-item measure (“I often feel moved”). We show that all three measures reliably predict participants’ response to moving stimuli (Study 2) and their feelings of being moved in the past week (Study 3) and next week (Study 5). Moreover, we show that the GSS and KAMF have good test–retest reliability (Studies 4 & 5). Overall, we conclude that all three measures provide experimenters with useful tools to investigate the role feelings of being moved play in our lives.
In the past decade, philosophers and psychologists working on emotions have been increasingly interested in what it means for people to be “moved” or “touched”. According to a growing consensus, the way people use these terms captures a specific emotion, worth investigating for itself (Cova & Deonna, Citation2014; Menninghaus et al., Citation2015; Zickfeld et al., Citation2019a). Moreover, equivalents for these expressions can be found in many languages (Zickfeld et al., Citation2019b).
Recent theoretical and empirical work has suggested that feelings of being moved play an important role in our lives. First, it seems that feelings of being moved play a crucial role in our aesthetic lives, and in our aesthetic appreciation of sad fictions and music (Cova et al., Citation2018; Hanich et al., Citation2014; Vuoskoski & Eerola, Citation2017). Second, it has been hypothesised that feelings of being moved foster altruistic behaviour and engagement in social bonding (Menninghaus et al., Citation2015; Blomster Lyshol et al., Citation2020), as well as collective action (Landmann & Rohmann, Citation2020; Lizarazo Pereira et al., Citation2022). Finally, feelings of being moved have been shown to constitute a powerful tool of persuasion when it comes to moral and political behaviour (Seibt et al., Citation2019).
Most of these studies have focused on short-term effects of feelings of being moved on behaviours and attitudes, to the detriment of long-term effects. There are obvious reasons for this focus, as long-term effects are generally more difficult and more costly to assess. However, one practical and convenient way to investigate the long-term impact of feelings of being moved on behaviours and attitudes, and the way they shape our lives would be to have a reliable measure of participants’ disposition to experience feelings of being moved. Such measures have been used with success to investigate the impact of other positive emotions, such as awe (e.g. Gottlieb et al., Citation2018). Thus, our primary goal in this paper was to design and validate a measure of participants’ dispositions to feel moved that could be employed to investigate the impact of feelings of being moved on behaviours and attitudes.
Doing so required us to make certain theoretical choices. First, early research in participants’ feelings of being moved, which asked participants to describe situations in which they felt moved, found out that most participants described being moved in reaction to positive or mixed events, but that a minority described being moved in reaction to negative events (Cova & Deonna, Citation2014; Kuehnast et al., Citation2014). One way to react to these results is to consider that both cases are different instances of the same emotion: there would be ways of being “joyfully moved” and ways of being “sadly moved”, but both phenomena would be different ways of experiencing the same emotion (Menninghaus et al., Citation2015). Another way to react would be to consider that ordinary language does not carve psychology at its joint (Fiske, Citation2020), and that the instances of being “joyfully” and “sadly” moved should be considered as different emotions (Cova et al., Citation2018; Cova & Deonna, Citation2014). Here, we do not want to commit ourselves to a particular view of how emotions should be individuated. However, we would like to point out that past studies have suggested that people experience being “joyfully” and “sadly” moved differently: while being moved in reaction to positive or mixed events elicited warm feelings in the chest, being moved in reaction to purely negative events did not (and was even experienced as “cold”; see Cova et al., Citation2023). Thus, even if we count instances of being “joyfully” and “sadly” moved as instances of the same emotion, it seems that both have different effects on participants’ bodily feelings, and might well have different effects on attitudes and behaviours. Thus, even in this case, it might be better to create separate scales for being “joyfully” and “sadly” moved, as it has been done for awe, an emotion for which scales measuring typical (i.e. positive) awe cohabit with a “negative awe scale”, which predicts different outcomes (Nakayama et al., Citation2020).
Thus, in constructing our scale, we decided to focus on being moved in reaction to positive and mixed events (that is: the most typical case). In this domain, there is a certain agreement on how feelings of being moved are experienced: feelings of being moved are typically pleasant and accompanied by a warm feeling in the chest. However, they also have a tearful phenomenology, including tears coming to one’s eyes, and a lump in the throat (Zickfeld et al., Citation2019a). This is why feelings of being moved have been associated with “tears of joy”. It has also been proposed that the experience of being moved is typically accompanied by chills or goosebumps, though there is also some contradictory evidence (Mori & Iwanaga, Citation2021).
However, this consensus stands in contrast with the lack of agreement about the elicitors and appraisals of being moved (see Cova et al., Citation2018; Cullhed, Citation2020; Zickfeld et al., Citation2019a for reviews of these debates). On one hand of the spectrum, certain accounts are very specific and claim that feelings of being moved are elicited mainly by the “sudden intensification of communal sharing” (Fiske et al., Citation2019) or by “scenarios that have a particularly strong bearing on attachment-related issues” (Menninghaus et al., Citation2015). However, such accounts force us to consider that people who claim to be moved by people succeeding against all odds (Landmann et al., Citation2019; Strick & Van Soolingen, Citation2018) or by the beauty of nature or art (Cova & Deonna, Citation2014) are speaking of another kind of emotion. On the other end of the spectrum, certain accounts are very broad and claim that feelings of being moved can be elicited by any situation that exemplifies a positive core value (Cova & Deonna, Citation2014) or any entity we are attached to, including values and ideas (Cullhed, Citation2020). Because we did not want to commit ourselves to any particular account of the elicitors of being moved, we decided that our scale would focus mainly on the idea that feelings of being moved are reactions to something (partly or entirely) positive.
This means that, for the purpose of our study, we construed feelings of being moved as a reaction to (partly or entirely) positive events that includes both a warm feeling in the chest and wanting to cry. Of course, this might not seem specific enough as other emotions (such as gratitude) might sometimes fit this description. However, the label used to describe feelings of being moved (“moved” or “touched”) tend to differ from those used to describe these other emotions and to load on separate dimensions (Abatista & Cova, Citation2023). Thus, our scale did not rely only on descriptions of bodily reactions and valence of the eliciting situation, but also included labels specific to feelings of being moved.
As we began working on constructing our scale, we became aware that there already existed a scale that might be used to assess participants’ disposition to feel moved: the Kama Muta Frequency Scale (KAMF). In their cross-cultural study on the experience of being moved, Zickfeld et al. (Citation2019b) used a trait scale containing seven items intended to measure the frequency with which participants tend to experience what they call kama muta and take to be the distinct emotional state people sometimes (but not always) express using labels such as “moved” and “touched”. However, this measure has not been validated yet, and it is not clear to which extent it actually predicts participants’ disposition to feel moved. Thus, in addition to designing and validating our own scale, a second aim of this paper was to compare its properties to the ones of the KAMF, and assess the validity of the KAMF.
Finally, as one reviewer on this paper aptly pointed out, it is not clear that a full scale is needed, as sometimes a single item might be enough. Thus, we also compared the merits of our scale and KAMF to the ones of a single-item measure of feelings of being moved: “I often feel moved”.
1. Transparency and openness
Except for Study 1, all studies were pre-registered on OSF. All preregistrations, materials, data and analysis scripts can be found at https://osf.io/7gepq/. For all studies, we report how we determined our sample size, all data exclusions, all manipulations, and all measures in the study. As preregistered, we used an alpha level of 0.05 for all analyses.
The studies reported in the manuscript have received the approval of University of Geneva’s CUREG (project name: “Being moved as a predictor of feelings of profundity”).
2. Study 1 – Construction of the Geneva sentimentality scale
In this study, our goal was to construct a measure of people’s tendency to be moved (or touched) – the Geneva Sentimentality Scale (GSS) – and to investigate its relationship with participants’ tendencies to experience other positive emotions.
2.1. Materials and methods
The study took the form of an online survey.
Items for the GSS (General). Participants were presented with 18 statements designed to measure participants’ tendency to feel moved (e.g. “I often feel moved”, “I often shed tears of joy”). For each statement, they were asked to rate the extent to which it applied to them (on a 5-point scale: 1 = “Not at all”, 5 = “Totally”). Two additional statements were attention checks.
Items were created based both on previous conceptual and theoretical work on feelings of being moved (that we reviewed in Introduction) and on the results of previous published and unpublished studies in which we asked participants to describe the experience of being moved in their own words, to make sure that our statements would mirror the way participants would talk about their own experiences (Cova et al., Citation2023; Cova & Deonna, Citation2014).
In line with the theoretical choices highlighted in introduction, we focused on the aspects of being moved for which there is some consensus: the label used to report the experience (“moved”, “touched”, “overwhelmed”) and the physiological reactions and bodily feelings typically reported by participants (“tears’, “lump in the throat”, “warm feeling in the chest”, “goosebumps”), particularly the paradoxical experience of feeling like crying while feeling positive (“tears of joy”). In accordance with our decision to focus on cases of being joyfully moved while not committing ourselves to a particular account of the elicitors of being moved, these items also made reference to the potential elicitors of being moved in a very broad and abstract way: depending on items, elicitors were described either as “positive events”, “positive stories” or “something beautiful”. The only exception was one item that focused particularly on mixed situations in which “the good in this world is stronger than the bad”, in reference to early conceptualisation of what moves us (Deonna, Citation2011).
Some of our items focused on a dimension of feelings of being moved that has rarely been studied: feelings of being part of a greater whole, or of connecting with something larger than themselves. In the emotion literature, the experience of being in the presence of something greater has mainly been studied in connection with the emotion of Awe (Piff et al., Citation2015). However, even before Piff and colleagues published their seminal study on awe and the small self, Cova and colleagues had observed that inducing feelings of being moved through moving videos led them to report higher feelings of “being part of a whole” (Cova et al., Citation2023). More recently, Abatista and Cova (Citation2023) used principal component analysis on self-transcendent emotions elicited by recall task and videos and found that, though being moved and feelings of awe loaded on separate dimensions, both dimensions were significantly correlated with the experience of being in presence of something greater.
Finally, we did not include references to action tendencies in our items. This is because our goal was precisely to create a scale that would enable researchers to investigate the relationship between participants’ disposition to feel moved and various outcomes, including behaviour.
Items for the GSS (Specific subscales). In addition to a measure of people’s tendency to feel moved in general, we also aimed to create smaller subscales to measure participants’ tendency to feel moved by specific items and values (social bonds, moral virtue, success after a struggle, nature, art). Participants were thus presented with 30 additional items and 2 additional attention checks. This part of our study did not yield interesting results or any usable scale (see Appendix F in Supplementary Materials).
Kama Muta Frequency Scale. Participants were then presented with the Kama Muta Frequency Scale (KAMF) (Zickfeld et al., Citation2019b) which includes seven items asking participants about the last time participants felt moved/touched (0 = “Cannot remember being moved or touched” to 4 = “Within the last 24 hours”), the frequency with which they feel moved or touched (0 = “Never” to 7 = “Two or more times per day”), the frequency with which they get (i) choked-up, (ii) tears, (iii) shivers, and (iv) a warm chest from a moving or touching experience (0 = “Never” to 7 = “Two or more times per day”), and whether they would describe themselves as someone who is easily moved or touched (1 = “Not at all” to 7 = “Extremely”).
Empathic concern scale. As a test of convergent validity, participants were presented with the Empathic concern subscale of the Interpersonal Reactivity Index (Davis, Citation1980) which includes seven items (e.g. “When I see someone being taken advantage of, I feel kind of protective toward them”, from 1 = “does not describe me well” to 5 = “describes me very well”) (α = .93). Indeed, previous research found that people high in empathic concern were more likely to experience feelings of being moved (Zickfeld et al., Citation2017). Thus, we should expect our scale to correlate positively with the empathic concern subscale.
Dispositional Positive Emotions Scale (DPES). Then, participants were presented with the 38 items of Shiota and colleagues (Citation2006)’s Dispositional Positive Emotions Scale (DPES). The DPES is composed of seven subscales supposed to measure participants’ tendencies to experience seven different positive emotions: Joy, Contentment, Pride, Love, Compassion, Amusement, Awe (e.g. “On a typical day, many events make me happy” from 1 = “strongly disagree” to 7 = “strongly agree”). Based on previous literature showing that social and personal relationships are prime elicitors of feelings of being moved, we expected the Love subscale to correlate with our scale. Also, because the Compassion subscale measures a construct very similar to the Empathic Concern subscale (correlation between Empathic Concern and Compassion; r = .82), we expected our scale to show higher correlations with the Compassion subscale.
Other measures. At the end of the survey, participants were asked to provide information about themselves (age, gender, country of residence, number of children, job, study level, religion, frequency of religious practice, political orientation). We also asked participants six questions about their philanthropic behaviour. This was part of another research project and won’t be discussed here.
2.2. Results
Participants and sample size. Because correlations typically stabilise towards N = 250 participants (Schönbrodt & Perugini, Citation2013), we aimed for a total 250 participants. Foreseeing the need to exclude participants based on compliance checks, we decided to recruit a total of 300 participants through Amazon Mechanical Turk (participants had to be United States residents, and were required to have taken at least 50 HITs with a success rate >95%). Participants who failed at least one of four comprehension checks were excluded, leaving us two identified as “others”. Mean age was 34.86 (SD = 9.38). After applying exclusion criteria, there were 236 participants left in the final sample (163 men and 73 women).
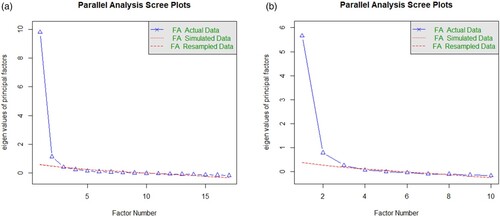
Building the GSS (Exploratory Factor Analysis). First, we performed an exploratory factor analysis on the 18 items supposed to measure our general tendency to feel moved using a Promax rotation in R Studio 1.4.1106. We first analysed commonalities between 18 items that were already preselected in the first stage of the study. Exploring correlation plot, only one item (item 10) did not correlate significantly with other items and we excluded this item for the factorial analysis. Scree plot of eigenvalues of parallel analysis on the remaining 17 items indicated a three-factor model (see (a)).
Figure 1. (a) Scree plot graphing of eigenvalues of parallel analysis for the 17 final components of Study 1; (given minimum residual solution for 500 simulated analyses, .50 for added observation per cell and with eigenvalues compared against the matching 95% quantile of the simulated data). (b) Scree plot graphing of eigenvalues of parallel analysis for the 10 final components of Study 1 (given minimum residual solution for 500 simulated analyses, .50 for added observation per cell and with eigenvalues compared against the matching 95% quantile of the simulated data).
We used an exploratory analysis with maximum likelihood estimator and 1000 bootstrap simulations using Promax rotation because we suspected factors may be correlated (Abdi, Citation2003). Three- and four-factor analysis revealed the existence of a Heywood case (factor load greater than 1) for one item (item 12). This may be due to close item wordings and we thus removed this item from the final analysis. The loading matrix revealed that the four-factor model had a dimension with only one item loading superior to .50 (item 7). A one-item factor being inconceivable, we favoured the three-factor model (). Factor 1 did correlate with Factor 2 (r = .72) and Factor 3 (r = .78) and those two also correlated with each other (r = .75). The three-factor analysis indicated an acceptable fit, χ2(236) = 140.94, p < .001, TLI = .96, RMSEA = .06, 95% CI [.04, .08] and BIC = −268.84.
Table 1. Results from an exploratory factor analysis of the Geneva Sentimentality Scale (Study 1)
As our goal was to design a short, easily usable scale, we decided to exclude items to shorten the scale. First, we excluded items that loaded on several factors (such as statements 3 and 8). Then, for each identified factor, we kept the three or four items with the best loadings on this factor. The resulting factors were judged conceptually satisfying as they lent themselves to straightforward theoretical interpretations and corresponded to different component of the experience of being moved: (i) the emotional labels, (ii) the disposition to shed tears, and (iii) the warm and pleasant feelings in the chest.
The final 10-items Geneva Sentimentality Scale (GSS) and its structure in three factors can be found in Appendix A. It showed high internal consistency (Cronbach’s α = 0.93) and parallel analysis scree plot indicated a three-factor solution as well ((b)).
Convergent validity of the GSS. As expected, the GSS correlated strongly with the KAMF (r = 0.78, p < .001) and with the “Empathic Concern” subscale of the Interpersonal Reactivity Index (EC): r = 0.63, p < .001.
Discriminant validity. To investigate the relationship between the GSS and other measures of participants’ tendencies to experience various positive emotions, we computed correlations between the GSS and the DPES’ subscales. Results are presented in . The GSS showed weak correlations with amusement, contentment and pride, and moderate correlations with awe, compassion, joy, and love. The strongest correlations were with awe (r = .50) and compassion (r = .56). Given that the correlations with compassion and love were theoretically expected, only the correlation with awe was problematic. However, the awe subscale tended to correlate moderately or strongly with all positive emotions subscales, suggesting that the lack of discriminant validity comes from the awe subscale rather than the GSS.
Table 2. Correlations between GSS scores and participants’ scores to the various subscales of the DPES.
2.3. Discussion
Study 1 allowed us to construct the GSS, a measure of participants’ disposition to feel moved/touched with good convergent and discriminant validity. In Study 2, we now turn to its criterion validity, by investigating its ability to predict how easily participants can be moved by paradigmatic moving stimuli.
3. Study 2 – The GSS as a predictor of participants’ predisposition to feel moved
In Study 1, we used Exploratory Factor Analysis (EFA) to design the Geneva Sentimentality Scale (GSS). In the present study, our aim was threefold:
Confirm the structure of the GSS using Confirmatory Factor Analysis.
Evaluate the criterion validity of the GSS by having participants rate their emotional reactions to three videos selected for their potential to elicit feelings of being moved, and see whether the GSS actually predicts participants’ feelings of being moved when watching these videos.
Compare the criterion validity of the GSS to the criterion validity of two alternate measures of participants’ dispositions to feel moved: the KAMF and a single-item measure composed uniquely of the “I often feel moved” statement.
3.1. Materials and methods
The study took the form of an online survey.
Video clips. After filling an online consent form, participants were presented with three video clips previously used in the psychological literature (two from Zickfeld et al., one from 2019; Landmann et al., Citation2019) that have been shown to efficiently elicit feelings of being moved (two lovers kissing and ageing together; a man displaying altruistic behaviour towards people, animals and even plants; a person with disability displaying a stunning performance at a singing contest). For each video clip, participants had to indicate to which they felt the following emotions while watching the video (on a 5-point scale: 1 = Not at all, 5 = Very strongly): amusement, anger, awe, compassion, contentment, gratitude, fear, joy, moved, pride, sadness, touched, and wonder.
After that, they had to write an open-ended description of what the video clip was about. This was made to ensure they really watched the video. Participants who did not provide a sensical or relevant answer were rejected and excluded from analysis.
Geneva Sentimentality Scale (GSS). Then, participants were asked to rate their agreement with the 10 statements of the GSS (on a 5-point scale: 1 = “Not at all”, 5 = “Totally”). The last two items were attention checks: we excluded participants who failed to give the right answer to at least one of the two items.
Emotional disposition scales. Participants were then presented with the KAMF (Zickfeld et al., Citation2019b) and the DPES (Shiota et al., Citation2006).
Predictive power. Additionally, we wanted to explore whether using the GSS would allow us to replicate past findings about feelings of being moved. As mentioned earlier, feelings of being moved are sometimes associated with feelings of “being part of something larger”. Thus, we included the Universality (α = .94) and Connectedness (α = .85) subscales of Piedmont’s Spiritual Transcendence Scale (Piedmont, Citation1999). The Universality subscale contains items such as “I feel that on a higher level all of us share a common bond” and “All life is interconnected”. Thus, we hypothesised that participants’ disposition to feel moved will be associated with higher scores on the Universality subscale.
Past research has also found a link between being moved by pseudo-profound statements and rating these statements as “profound” (Cova et al., Citation2018). We thus asked participants to rate the “profundity” of 20 statements drawn from Pennycook and colleagues (Citation2015)’s “Bullshit receptivity scale” (α = .94).
Other measures. Participants were asked the same demographic questions and questions about philanthropic behaviour as in Study 1. For exploratory purposes, we also included two measures of attachment style: the Adult Attachment Questionnaire (Simpson et al., Citation1996) and the Relationship Questionnaire (Bartholomew & Horowitz, Citation1991).
Hypotheses. We preregistered the following predictions. The Geneva Sentimentality Scale (GSS) will have a multidimensional factor structure consisting of at least “Emotional labels”, “Tears of joy” and “Warm feelings in the chest” (H1). Participants’ scores on the GSS will be positively correlated to participants’ feelings of “being moved” and “being touched” when rating three different videos (H2a). The correlation between GSS scores and participants’ feelings of “being moved” and “being touched” will be higher than the correlation between GSS scores and other emotional reactions (H2b). Participants’ tendency to be more easily moved (as measured by the GSS and participants’ reactions to videos) will be positively correlated with their tendency to rate “pseudo-profound” items as “deep” or “profound” (H3). Participants’ scores on the GSS and ratings of “being moved” and “touched” to the video clips will be (H4): (a) higher for people who have at least one child than for people who have none; (b) positively correlated with participants’ number of children; (c) positively correlated with participants’ frequency of religious practice and (d) positively correlated with participants’ spirituality. Hypotheses (a)–(c) are based on explanatory analyses performed in a previous study. Hypothesis (d) is completely original.
3.2. Results
Participants and sample size. Using a Monte-Carlo CFA simulation through Mplus (following Muthén & Muthén, Citation2002) with 10 items, 3 factors, 150 observations, 10,000 replications, 80% of statistical power, 58% of residual variance and .72, .78, and .75 of inter-factors correlations (for F1–F2, F1–F3, and F2–F3 respectively, based on Study 1), we found negligible bias between factor loading estimates of the replication and population value (<−0.003). We obtained almost the same results when using a robust estimator (MLR). We thus needed to reach 200 participants to anticipate experimental mortality, missing data and control check questions. Foreseeing for exclusions and possible duplicates, we decided to recruit a total of 300 participants through Amazon Mechanical Turk (participants had to be United States residents, and were required to have taken at least 50 HITs with a success rate >95%).
In total, 353 participants were recruited and completed our survey. Participants who failed at least one of two comprehension checks and/or provided low-effort answers to open-ended questions (i.e. answers that said nothing specific about the content of the video, such as “very nice”, “good things”, “good video”, “GOOD KNOWLGE”) were excluded, leaving us with 209 participants after exclusion. Of these 209 participants, 128 were men, 79 were women, 2 identified as “others”. Mean age was 38.56 (SD = 11.44).
Confirmatory factor analysis. First, we performed a confirmatory factor analysis on the 10 items supposed to compose the GSS. Using a pre-registered CFA to avoid researchers’ degrees of freedom on modification indexes or residual hacking, we estimated items loading onto our specific factor and the relationship between those factors. We also examined mean variances and established reliability and validity (e.g. McDonald’s coefficient Omega).
Participants reported their sentimentality level using their degree of agreement to the three items assessing Emotions labels (e.g. “I often feel moved”, α/ω = .91/.90), the four items assessing Tears of Joy (e.g. “I often shed tears of joy”, α/ω = .92) and the three items assessing Warms feeling in the chest (e.g. “It often warms my heart when people tell me touching stories”, α/ω = .92). There was no missing data and we could thus include the initial sample (N = 209).
Using the lavaan package in R for structural equation modelling (Rosseel, Citation2012), we fitted three- and two-factor solutions (based on our original EFA and as predicted in our preregistration) fixing the factors’ variance to 1 in both models and using robust linear estimator. The overall three-factor model fit was excellent: χ2(32) = 61.40, p < .001, CFI = .98, TLI = .98, SRMR = .03, RMSEA = .07, 95% CI [.04; .09]. According to McNeish and colleagues (Citation2018), those criteria are not sufficient alone as they are highly susceptible to measurement quality. Our data indicated very high measurement quality for our three factors (all items had factor loadings > .70) and very good internal consistency (α/ω ≥ .90) ().
Table 3. Results from a confirmatory factor analysis of the Geneva Sentimentality Scale (GSS).
Exploratory descriptive and correlational statistics () indicated that all items correlated significantly, with similar variance and no hyper-skewness or kurtosis (Kline, Citation2005). The factors exhibited a simple and easy-to-read structure, positively correlated with each other for factors 1 and 2 (r = .71, p < .001), factors 1 and 3 (r = .81, p < .001) and factors 2 and 3 (r = .66, p < .001). Discriminant validity analysis based on the average variance extracted (AVE) still raised concerns about the discriminant validity of the factors (i.e. the square root of the AVE was sometimes lower than inter-factor correlations, see Henseler et al., Citation2015; Voorhees et al., Citation2016). Modification indices did not display any problematic values.
Table 4. Means, standards deviations, skewness, kurtosis and bivariate correlations for the GSS (Study 2).
Convergent validity of the GSS. As in Study 1, we found a strong positive correlation between the KAMF and the GSS: r = .80, p < .001.
Discriminant validity. Intercorrelations between the GSS and the different DPES subscales are shown in . As can be seen, correlations with the GSS were above r = .50 for the Awe, Compassion, Joy and Love subscales.
GSS’ ability to predict emotional states induced by video. If the GSS adequately measures participants’ tendencies to be moved, it should predict the intensity of participants’ feelings of being moved and touched in reaction to videos. displays the zero-order correlation between participants’ emotional reactions to all three videos (aggregated) and participants’ different emotional dispositions (GSS, KAMF and DPES).
Table 5. Zero-order correlations between participants’ emotional reactions towards the three video clips (Y-axis) and their emotional dispositions (X-axis) as measured through the GSS, the KAMF, the single-item measure, and the seven subscales of the DPES (Study 2).
Participants’ feelings of being “moved” and “touched” were strongly correlated (r = .96). So, we decided (as planned in our pre-registration) to combine them in a single score “moved/touched”. As expected, correlations between participants’ feelings of being “moved/touched” and their emotional dispositions were at their highest for the GSS (r = .70 [.62, .76]) and the single-item measure (r = .65 [.56, .72]), but not the KAMF (r = .54 [.44, .63]). Correlation between feelings of “being moved/touched” and GSS was significantly higher than their correlation with the KAMF (t = 4.90, p < .001) and than their correlation with the single-item measure (t = 2.01, p = .046).
The second best predictors were the Compassion and Awe subscales of the DPES (r = .60 [.51, .58] and 61 [.51, .69] respectively). Two William’s tests for dependent correlations sharing one variable showed that the correlation between “being moved/touched” and the GSS was significantly stronger than the correlation between “being moved/touched” and the Compassion (t = 2.28, p = .023) and Awe subscales (t = 2.14, p = .034). Moreover, we conducted a multiple regression analysis with aggregate “being moved/touched” scores as dependent variable and the GSS and seven DPES subscales as predictors (see Appendix J). The results indicated that the GSS remained the strongest predictor of aggregated scores (β = 0.45, p < .001), and the only significant predictor with Compassion. Thus, compared to the seven subscales of the DPES, the GSS was the best predictor of participants’ feelings of being moved/touched while watching the three video clips.
Conversely, we looked at which emotional states experienced during the videos were best correlated with the GSS. As desired, the strongest correlation was with feelings of being moved/touched. The second and third best correlations were with joy (r = .65 [.57, .72]) and gratitude (r = .63 [.55, .71]). Two William’s tests showed no significant difference between the GSS-moved/touched and the GSS-joy correlation (t = 1.63, p = .11), and a significant difference between the GSS-moved/touched and the GSS-gratitude correlations (t = 1.99, p = .047). Thus, the GSS did not predict exclusively feelings of being moved, but also other positive states such as joy. This might be due to the fact that, in the context of emotions elicited by videos, there are strong inter-correlations between the different positive emotional states. A linear regression with GSS scores as dependant variable and all 12 emotional states as predictors found that only states of “being moved/touched” were a significant predictor of GSS scores (B = 0.42, SE = 0.10, t = 4.30, p < .001).
Overall, compared to the DPES subscales, the GSS was the best predictor of participants’ feelings of being moved, which indicates good criterion validity.
Predictive power. As displayed in , participants’ scores on the GSS were significantly correlated with their score on the Universality (r = .47 [.36, .57], p < .001) and Connectedness (r = .53 [.42, .62], p < .001) subscales of the Piedmont’s Spiritual Transcendence Scale. Participants’ scores on the GSS were also significantly correlated with the extent to which they rated the 20 pseudo-profound statements as “profound” (r = .51 [.40, .60], p < .001). Thus, the GSS allowed us to replicate previous findings about feelings of being moved, but this was also the case for the KAMF and the single-item measure.
Table 6. Correlations between participants’ attitudes and behaviours and various emotional disposition scales (GSS, KAMF, Awe, and Amusement).
4. Study 3 – The GSS as a predictor of the frequency of participants’ emotional experiences
In Study 2, we saw that the GSS reliably predicted how easily participants were moved by a given stimulus. In Study 3, we investigate to which extent the GSS allows us to predict the frequency with which participants felt “moved” or “touched” during the past week.
4.1. Materials and methods
The study took the form of an online survey.
Emotional disposition scales. As in Studies 1 and 2, participants were presented with the GSS, the KAMF and the seven subscales of the DPES. Because expressions such as “I am touched” are often used in gratitude contexts (for example, when one is offered a gift), participants were also presented with the Gratitude Questionnaire-Six Item Form (McCullough et al., Citation2002), a measure of participants’ disposition to experience gratitude. We wanted to know whether our scale would be able to predict states of being moved better than the Gratitude scale.
Emotional states during the past week. Participants were then presented with a modified version of the PANAS-SF (Watson et al., Citation1988). In this scale, participants are presented with 10 positive and 10 negative emotional states and asked to indicate, for each of them, to which extent they felt this way over the past week (on a 5-points scale from “Very slightly or not at all” to “Extremely”). We modified the scale by adding eight additional emotional states: moved, touched, awe, joyful, content, love, compassionate, amused. For the “moved” and “awe” items, participants were presented with a definition corresponding to the way these emotions have been theorised by psychologists. For “moved”, it was:
many people use this expression to describe emotional episodes in which they felt like crying and/or have a lump in the throat, not because of something negative, but because something positive and beautiful happened. As such, feeling ‘moved’ is often a pleasant and heart-warming experience.
For “awe”, it was:
awe is the kind of feeling you experience when you encounter something so vast that your mind struggles to fully comprehend it. Objects that can elicit awe include (but are not limited to) physical objects (such as the Great Canyon or the Eiffel Tower) or incredibly complex theories and works of art.
This block (containing states experienced during the past week) and the previous one (containing disposition scales) were presented in a randomised order.
Behaviour. As in Study 2, we investigated whether the GSS would allow us to replicate past findings about being moved. Past research has suggested that feelings of being moved play an important role in the appreciation of sad movies or sad music (Vuoskoski & Eerola, Citation2017). Thus, we asked participants how often they watched sad movies and listened to sad music (on a 5-points scale from “never” to “always”). We also asked them how many times they got moist eyes or shed a tear because of a positive feeling in the past week (on a 4-points scale from “never” to “more than four times”). As a comparison point, we used activities that are more traditionally connected to Awe (McPhetres, Citation2019), and asked participants how often they went to science museums or art museums in the past six months (on a 5-points scale from “never” to “more than four times”).
Other measures. Finally, participants were asked the same demographic questions and the same questions about their philanthropic behaviour as in Studies 1 and 2.
4.2. Results
Because our main hypotheses were correlational in nature, we aimed for a total of 250 participants, as it has been suggested that correlations stabilise around N = 250 (Schönbrodt & Perugini, Citation2013). In total, 248 participants completed our survey. Participants who failed at least one of two comprehension checks and/or provided nonsensical answers to open-ended questions were excluded, leaving us with 235 participants after exclusion. One hundred eighteen were men, 110 were women, 7 identified as “others”. Mean age was 30.15 (SD = 12.00).
Comparison between the GSS and the KAMF. For the results of CFA on the GSS, see Appendix H in Supplementary Materials. Both the GSS (α = 0.93) and the KAMF (α = 0.90) show high internal consistency. Participants’ scores on both scales were significantly correlated: r = .78, p < .001. Participants’ confidence ratings to both scales did not differ significantly (GSS: M = 88.16, SD = 13.34; KAMF: M = 89.21, SD = 11.93). After excluding outliers (more than 2 SDs), participants took longer to fill the GSS, compared to the KAMF (GSS: M = 54.50s, SD = 30.87; KAMF: M = 42.67s, SD = 25.93), t(225) = 5.31, p < .001.
GSS and KAMF as predictors of feelings experienced during last week. Intercorrelations between the different emotion scales are presented in . Correlations between each emotional disposition scales and each positive items in the modified PANAS-SF scale are presented in . As predicted, correlations with the aggregated “moved” and “touched” states was stronger for the GSS (r = .62 [.53, .69]), the KAMF (r = .69 [.61, .75]), and the single-item measure (r = .59 [.50, .67]). Correlation with the KAMF was significantly higher than the one with the GSS (t = 2.08, p = .039), but there was no significant difference between the GSS and the single-item measure (t = 1.00, p = .320). The second-best predictor was the Compassion subscale (r = .46 [.36, .56]). A William’s test showed that correlation between aggregate scores and the Awe subscale was significantly lower than the correlation between aggregate scores and the GSS (t = 2.80, p = .006). We also conducted a multiple regression analysis with aggregate “being moved/touched” scores as dependent variable and the GSS, seven DPES subscales and Gratitude scale as predictors (see Appendix J). The results indicated that the GSS remained the strongest predictor of aggregated scores (β = 0.54, p < .001), and the only significant predictor with Awe (β = 0.19, p = .006).
Table 7. Correlations between GSS scores and participants’ scores to the other emotion scales (Studies 3 and 5). Correlations for Study 3 are displayed above the diagonal in bold and correlations for Study 5 below. The diagonal (in italics) displays Cronbach’s alphas for Studies 3 and 5.
Table 8. Zero-order correlations between participants’ emotional states during the past week (rows) and their emotional dispositions (columns) as measured through the GSS, the KAMF, the Gratitude Questionnaire and the seven subscales of the DPES.
Conversely, the “moved” and “touched” states were the ones that showed the highest correlations with the GSS, the KAMF, and the single-item measure. Just after came the “compassionate” state (with GSS: r = .40 [.29, .51]; with KAMF: r = .36 [.25, .47]; with single-item measure: r = .39 [.28, .49]). A William’s tests showed that correlation between GSS and the “moved/touched” state was significantly higher than the correlation with GSS and the “compassionate” state (t = 4.1, p < .001). Also, we ran a multiple regression analysis with GSS scores as dependent variable and all PANAS items presented in as predictors (“moved” and “touched” were aggregated). The only significant predictor was “being moved/touched” states (β = 0.48, p < .001).
Predictive power. In line with previous research, participants’ scores on the GSS predicted their engagement with sad movies and sad music, as well as the frequency with which they shed tears of joy (see ). However, the GSS did not predict any behaviour: for example, and in line with previous research, frequency of visits to the science museum was predicted by the Awe subscale, but not by the GSS. We found the same pattern of result for the KAMF and the single-item measure.
5. Study 4 – Assessing the Geneva Sentimentality Scale’s test–retest reliability
To assess the GSS’ test–retest reliability, we had a sample of psychology students fill the scale at several months of interval.
5.1. Materials and methods
At the start of October 2019, 242 participants at University of Geneva completed a long questionnaire containing numerous scales and measures, including a French version of the GSS (see in Supplementary Materials Appendix C for items, Appendix I for CFA on the structure of the scale). Ninety-three of these students (74 women, 19 men; Mage = 21.7, SDage = 3.36) subsequently participated in a lab experiment between February and March 2020 (see Study 4 in Cova & Boudesseul, Citation2023). At the end of the experiment, they were asked to fill the French version of the GSS a second time.
5.2. Results
The French version of the GSS showed good internal coherence in the first round (N = 242, M = 3.13, SD = 0.88, α = .90) and in the second round (N = 93, M = 3.28, SD = 0.82, α = .87). We found a strong correlation between GSS scores at the first and second round (r = .75, p < .001). Given that four to five months separated the two sessions, we take that as evidence of a good test–retest reliability. We also assessed test–retest reliability for the single-item measure, but the test–retest reliability was poor (r = .40, p < .001).
6. Study 5 – further validation of the Geneva Sentimentality Scale
In this last study, our aim was to validate the Geneva Sentimentality Scale as a measure of participants’ tendency to feel moved by: (i) assessing its ability to predict participants’ feelings of being moved in the upcoming week, (ii) assessing its ability to predict several outcomes (attitudes and behaviour) typically connected to feelings of being moved, (iii) confirming its test–retest capability over a week, and (iv) comparing those to the ones of the KAMF and one-item measure. Thus, the study was split in two parts separated by a delay of one week.
6.1. Materials and methods
The study took the form of two online surveys, separated by a one-week delay. In the first survey, participants filled the same emotion scales as in Study 3: the GSS, the KAMF, the seven subscales of the DPES, and the Gratitude Questionnaire-Six Item Form. Because one reviewer pointed out that one item of our second factor (“I often cry while having a warm feeling in the heart because I find something beautiful”) was actually referring to the core theme of our third factor (warm feelings in the heart), we modified it to focus only on tears (“I often cry because I find something beautiful”).
Participants who completed the first part and did not fail any attention check were invited one week later to complete the second part of the experiment. In this second part, participants first completed the same modified PANAS-SF scale as in Study 3 (the only difference is that we added “sentimental” as an additional item for exploratory purposes). After that, to assess test–retest reliability, participants were presented with the same emotion scales as in the first part of the study: the GSS, the KAMF, the seven subscales of the DPES, and the Gratitude Questionnaire-Six Item Form. One item (“I am a sentimental person”) was added for exploratory purposes. Finally, participants were asked to answer the four following questions about their activities in the past week on a 5-point scale (from 0 = “Never” to 4 = “On six or seven days”):
In the past week, how often (out of seven days) did you watch sad movies/TV shows?
In the past week, how often (out of seven days) did you listen to sad music?
In the past week, how often (out of seven days) did you engage in science-related activities (e.g. going to the science museum, watching a documentary, reading science articles)?
In the past week, how often (out of seven days) did you engage in art-related activities (e.g. going to the art museum, practicing some form of art, reading something about art)?
Participants were also asked “In the past week, how often did you get moist eyes (or even shed a tear) because of a positive feeling?” and had to answer on a 4-point scale (0 = “Never”, 3 = “More than four times”).
6.2. Results
Participants and sample size. In line with previous studies, a Monte-Carlo CFA simulation through Mplus (Muthén & Muthén, Citation2002) indicated that 150 participants would yield negligible bias between factor loading estimates of the replication and population value. To anticipate experimental mortality, missing data and control check questions and possible duplicates, we chose to recruit a total of 300 participants through Prolific Academic.
In total, 297 participants completed the first part of the study. Participants who failed at least one control check were excluded, leaving us with 286 participants. 140 were men, 141 were women and 5 identified as “others”. Mean age was 37.59 (SD = 13.22).
One week later, these 286 participants were invited to take part in the second part of the study. Two hundred fifty-six completed the second part, of which 9 failed at least one attention check, leaving us with 247 participants. Two additional participants were lost for not providing identical ID to both parts of the study, making comparison impossible, and leaving us with a total of 245 participants.
Confirmatory factor analysis. We used participants’ answers to the first part of the study to perform a pre-registered confirmatory factor analysis on the 10 items that constituted the GSS. Reliability analysis indicated good internal consistency for the Emotions labels (α/ω = .87/.88), Tears of Joy (α/ω = .87/.89) and the Warms feeling dimension (α/ω = .87/.88). There was no missing data and we could thus include the total sample (N = 286).
Using the lavaan package in R for structural equation modelling (Rosseel, Citation2012), we fitted a pre-registered three-factor solution setting the factors’ variance to 1 in both models and using a robust linear estimator. The overall three-factor model fit was excellent: χ2(32) = 66.24, p < .001, CFI = .98, TLI = .98, SRMR = .02, RMSEA = .06, 95% CI [.04; .08]. Again, these dataset indicated high measurement quality for our three factors (all items had factor loadings > .70) and good internal consistency (α/ω ≥ .80; see McNeish et al., Citation2018).
Exploratory descriptive and correlational statistics indicated that all items correlated significantly, with similar variance and no hyper-skewness or kurtosis (Kline, Citation2005). The factors exhibited a simple and easy-to-read structure, positively correlated with each other for factors 1 and 2 (r = .73, p < .001), factors 1 and 3 (r = .75, p < .001) and factors 2 and 3 (r = .62, p < .001). Compared with a two-factor solution (AIC/BIC = 7407.4/7520.8, χ2(34) = 277.99), our three-factor model significantly improved model fit (AIC/BIC = 7199.7/7320.3, χ2(32) = 66.24), Δχ2(1) = 211.76, p < .001. Discriminant validity analysis based on the average variance extracted (AVE) indicated good values for the three factors (F1 = 0.70, F2 = 0.65 and F3 = 0.69).
Measurement Invariance Analysis. Weak and strong measurement invariance analysis indicated that estimates did not vary much between gender for Study 5. Since Study 4 also included French-native speakers, we ran a measurement invariance analysis comparing Studies 4 and 5. A comparison between configural, weak (i.e. metric, factor loading) and strong models (i.e. scalar, intercepts) was assessed. Although factorial loadings did not vary much between the different models, an analysis of variance indicated that both weak (Δχ2(7) = 36.94, p < .001) and strong invariance were supported (Δχ2(7) = 96.29, p < .001). However, the χ2 difference test is an overly sensitive test of measurement invariance and routinely suggest measurement variance when little or none is present or because of large sample size (Brannick, Citation1995; Kelloway, Citation1995). Examining alternative fit indices did not corroborate such results with AIC being smallest for the configural model (13,984) when compared to the weak (14,006) and strong invariant model (14,089). Bayesian criteria indicated that the weak invariance model was the most parsimonious (14,258) compared to the configural (14,265) and strong ones (14,311).
Comparison between the GSS and the KAMF. Both the GSS (α = 0.93) and the KAMF (α = 0.93) show high internal consistency. Participants’ scores on both scales were significantly correlated: r = .79, p < .001. Participants’ confidence ratings to both scales did not differ significantly (GSS: M = 88.93, SD = 14.32; KAMF: M = 88.95, SD = 13.31). After excluding outliers (more than 2 SDs), participants took longer to fill the GSS, compared to the KAMF (GSS: M = 46.76s, SD = 24.17; KAMF: M = 38.59s, SD = 19.85), t(267) = 5.46, p < .001.
Test–retest reliability. To assess the test–retest reliability over one week of our scales, we computed a Pearson correlation between participants’ scores in the first part of the study and their scores in the second part of the study. Correlation coefficients (r) were .85 for the GSS, .82 for the KAMF, .64 for the single-item measure, .85 for the Joy scale, .89 for the Contentment scale, .89 for the Pride scale, .85 for the Love scale, .83 for the Compassion scale, .83 for the Amusement scale, .82 for the Awe scale, and .85 for the Gratitude scale. Thus, both the GSS and the KAMF showed good test–retest reliability (>.70), but not the single-item measure.
GSS and KAMF as predictors of feelings experienced during last week. Intercorrelations between the different emotion scales (first part of the study) are presented in . Correlations between each emotional disposition scale and each positive item in the modified PANAS-SF scale are presented in . As predicted, correlations with the aggregated “moved + touched” states were at their highest for the GSS (r = .56 [.46, .64]), the KAMF (r = .52 [.43, .61]) and the single-item measure (r = .51 [.41, .60]). The predictive power of the GSS did not differ significantly from the predictive power of the KAMF (t = 1.00, p = .320), nor from the predictive power of the one-item measure (t = 1.87, p = .062).
Table 9. Results from a confirmatory factor analysis of the Geneva Sentimentality Scale (Study 5).
The second-best predictor of aggregated scores was the Awe subscale (r = .47 [.36, .56]). A William’s test showed that correlation between aggregated scores and Awe was not significantly lower than the correlation between aggregated scores and the GSS (t = 1.75, p = .081). The third-best predictor of aggregated scores was the Joy subscale (r = .42 [.31, .52]). A William’s test showed that correlation between aggregated scores and Joy was significantly lower than the correlation between aggregated scores and the GSS (t = 2.53, p = .012). A multiple regression analysis with aggregated scores as dependent variable and the GSS, seven DPES subscales and Gratitude scale as predictors found that GSS stayed the best predictor (β = 0.40, p < .001). The only other significant predictor was the Awe subscale (β = 0.20, p = .019)
Conversely, the “moved” and “touched” states (and their aggregated scores) were the states that showed the highest correlations with the GSS and the KAMF. Just after came the “compassionate” state (with GSS: r = .39 [.27, .49]; with KAMF: r = .33 [.22, .44]). A William’s tests showed that the correlation between aggregate scores and GSS scores was significantly higher than the correlation between “compassionate” scores and GSS scores (t = 3.44, p < .001).
Predictive power. In line with the results of Study 3, participants’ scores on the GSS and the KAMF (as reported in the first part of the study) predicted their engagement with sad movies and sad music, as well as the frequency with which they shed joyful tears (as reported one week later in the second part of the study; see ). Frequency of science- and art-related activities was predicted by the Awe subscale, but not by the GSS. The same pattern of results could be observed for the KAMF and single-item measure.
Table 10. Zero-order correlations between participants’ emotional states during the past week (rows) and their emotional dispositions (columns) as measured through the GSS, the KAMF, the single-item measure, the Gratitude Questionnaire and the seven subscales of the DPES (Study 5).
7. General discussion
In this paper, our goal was to create and validate a practical measure of participants’ disposition to feel moved. Study 1 allowed us to design the Geneva Sentimentality Scale (GSS), a short (10-items) measure which participants took on average less than one minute to complete, while still being quite confident in their answer. The GSS was able to predict participants’ feelings of being moved in reaction to video stimuli (Study 2), in the past week (Study 3), and in the upcoming week (Study 5) more reliably than other positive emotion scales (the DPES subscales and the Gratitude scale), and it did not indifferently predict positive affect but predicted feelings of being moved or touched over other positive affective states. Moreover, its test–retest reliability over a period of one week or several months was high (Studies 4 and 5). Finally, using the GSS, we were able to reach the same conclusions than studies that investigated feelings of being moved using other methods: scores on the GSS predicted connectedness, ratings of profundity, tears of joy and participants’ appreciations of sad fictions and music, suggesting that the GSS might help investigating the impact of feelings of being moved on cognition and behaviour.
The GSS showed medium intercorrelations with other emotional disposition scales, such as the Joy, Love, Compassion, and Awe subscales of the DPES. Correlations with the Love and Compassion are not problematic as they were theoretically expected, based on past research emphasising the importance of personal relationships (including love) for feelings of being moved, or the possibility that empathic concern and compassion could be a particular kind of feelings of being moved. Correlations with the Joy and Awe subscales are more unexpected and thus more problematic, but seems to be due to the fact that these two subscales measure some kind of positive affect in general, as they tend to show moderate correlations with most of the positive emotions scale we used, and not only with the GSS (see Tables and ). At any rate, these correlations do not seem to be due to the specific wording of certain items of the GSS (such as items mentioning the experience of being in presence of something greater), as the KAMF and single-item measure displayed the same kind of correlations with the Joy and Awe subscales.
Turning to the KAMF, the result of our studies suggests that it shares most of the advantages of the GSS (except maybe good test–retest reliability over a period of several months, which we did not test for the KAMF). Thus, the results of the KAMF also provide evidence for the validity of the KAMF and its usability in psychological research. Additionally, participants took a bit less time to fill the KAMF, compared to the GSS. Still, some reasons to prefer the GSS includes the fact that the various items of the KAMF do not share a common scale (some items are on a 4-point scale, some on a 5-point scale, others on a 8-point scale), making it more complicated to compute the total score, or the fact that the GSS has a clear factorial structure, which allows interested researchers to study the role of the various components of feelings of being moved (e.g. tears vs. warm feeling in the chest).
However, it might not be necessary to choose between the GSS and the KAMF. Based on the suggestion of an astute reviewer, we compared both scales to a single-item measure of participants’ disposition to feel moved, composed only of the first item of the GSS (“I often feel moved”). As it turned out, this single-item measure shared most of the advantages of the GSS and the KAMF: it was consistently one of the best predictors of participants’ feelings of being moved and touched, over other positive emotional states, and also predicted certain attitudes and behaviours associated to feelings of being moved. The only setback was that its test–retest reliability was low, both over a one-week and several-months period.
When conducting scale validation, it is important to consider the consistency of results across groups or timepoints (i.e. measurement invariance). An analysis comparing French and English-speaking participants (respectively study 4 and 5) did not establish whether there was weak or strong measurement invariance between those groups, possibly limiting the comparison of GSS’s scores between different populations. However, model fit index cut-off criteria are limited because developed for specific simulations models (e.g. Maximum Likelihood, see Cheung & Rensvold, Citation2002) and thus further studies should use permutations tests instead (Jorgensen et al., Citation2018). Another possible limitation is the extent to which bodily reactions described in the GSS’s dimensions (e.g, “tears’, “lump in the throat”, “warm feeling in the chest”) actually correlate with real-time physiological measures. Future experiments should include measures such as heart rate, skin conductance or other proxies reflecting GSS’s physical changes.
Thus, our paper concludes that all three measures (the GSS, the KAMF, and the single-item measure) can be used by researchers to investigate the impact of feelings of being moved on behaviour and attitudes.
GSS_R2_SupplementaryMaterials.docx
Download MS Word (340 KB)Disclosure statement
No potential conflict of interest was reported by the author(s).
Data availability statement
All materials, data and analysis scripts are publicly available on OSF at https://osf.io/7gepq/ (DOI 10.17605/OSF.IO/7GEPQ)
Additional information
Funding
References
- Abatista, A., & Cova, F. (2023). Are self-transcendent emotions one big family? An empirical taxonomy of positive self-transcendent emotion labels. Manuscript under revision. University of Geneva.
- Abdi, H. (2003). Factor rotations in factor analyses. Encyclopedia for research methods for the social sciences. Sage Publications. https://doi.org/10.4135/9781412950589
- Bartholomew, K., & Horowitz, L. M. (1991). Attachment styles among young adults: A test of a four-category model. Journal of Personality and Social Psychology, 61(2), 226–244. https://doi.org/10.1037/0022-3514.61.2.226
- Blomster Lyshol, J. K., Thomsen, L., & Seibt, B. (2020). Moved by observing the love of others: Kama muta evoked through media fosters humanization of out-groups. Frontiers in Psychology, 11, 1240. https://doi.org/10.3389/fpsyg.2020.01240
- Brannick, M. T. (1995). Critical comments on applying covariance structure modeling. Journal of Organizational Behavior, 16(3), 201–213. https://doi.org/10.1002/job.4030160303
- Cheung, G. W., & Rensvold, R. B. (2002). Evaluating goodness-of-fit indexes for testing measurement invariance. Structural Equation Modeling: A Multidisciplinary Journal, 9(2), 233–255. https://doi.org/10.1207/S15328007SEM0902_5
- Cova, F., & Boudesseul, J. (2023). “That feels deep!”: Feelings of being moved play a role in perceptions of depth and profundity. [Manuscript submitted for publication]. Department of Philosophy, University of Geneva.
- Cova, F., & Deonna, J. (2014). Being moved. Philosophical Studies, 169(3), 447–466. https://doi.org/10.1007/s11098-013-0192-9
- Cova, F., Deonna, J., & Sander, D. (2018). “That’s deep!”: The role of being moved and feelings of profundity in the appreciation of serious narratives. In D. R. Wehrs & T. Blake (Eds.), The Palgrave handbook of affect studies and textual criticism (pp. 347–369). Palgrave Macmillan.
- Cova, F., Deonna, J., & Sander, D. (2023). Is elevation a way of being moved? Unpublished manuscript. University of Geneva.
- Cullhed, E. (2020). What evokes being moved? Emotion Review, 12(2), 111–117. https://doi.org/10.1177/1754073919875216
- Davis, M. (1980). A multidimensional approach to individual differences in empathy. JSAS Catalogue of Selected Documents in Psychology, 10, 85.
- Deonna, J. (2011). Etre ému. In C. Tappolet, F. Teroni, & A. Konzelmann Ziv (Eds.), Les Ombres de l’Âme: Penser les émotions négatives. Genève: Markus Haller.
- Fiske, A. P. (2020). The lexical fallacy in emotion research: Mistaking vernacular words for psychological entities. Psychological Review, 127(1), 95–113. https://doi.org/10.1037/rev0000174
- Fiske, A. P., Seibt, B., & Schubert, T. (2019). The sudden devotion emotion: Kama muta and the cultural practices whose function is to evoke it. Emotion Review, 11(1), 74–86. https://doi.org/10.1177/1754073917723167
- Gottlieb, S., Keltner, D., & Lombrozo, T. (2018). Awe as a scientific emotion. Cognitive Science, 42(6), 2081–2094. https://doi.org/10.1111/cogs.12648
- Hanich, J., Wagner, V., Shah, M., Jacobsen, T., & Menninghaus, W. (2014). Why we like to watch sad films. The pleasure of being moved in aesthetic experiences. Psychology of Aesthetics, Creativity, and the Arts, 8(2), 130–143. https://doi.org/10.1037/a0035690
- Henseler, J., Ringle, C. M., & Sarstedt, M. (2015). A new criterion for assessing discriminant validity in variance-based structural equation modeling. Journal of the Academy of Marketing Science, 43(1), 115–135. https://doi.org/10.1007/s11747-014-0403-8
- Jorgensen, T. D., Kite, B. A., Chen, P.-Y., & Short, S. D. (2018). Permutation randomization methods for testing measurement equivalence and detecting differential item functioning in multiple-group confirmatory factor analysis. Psychological Methods, 23(4), 708–728. https://doi.org/10.1037/met0000152
- Kelloway, E. K. (1995). Structural equation modelling in perspective. Journal of Organizational Behavior, 16(3), 215–224. https://doi.org/10.1002/job.4030160304
- Kline, R. B. (2005). Principles and practice of structural equation modeling (2nd ed.). Guilford Press.
- Kuehnast, M., Wagner, V., Wassiliwizky, E., Jacobsen, T., & Menninghaus, W. (2014). Being moved: Linguistic representation and conceptual structure. Frontiers in Psychology, 5, 1242. https://doi.org/10.3389/fpsyg.2014.01242
- Landmann, H., Cova, F., & Hess, U. (2019). Being moved by meaningfulness: Appraisals of surpassing internal standards elicit being moved by relationships and achievements. Cognition and Emotion, 33(7), 1387–1409. https://doi.org/10.1080/02699931.2019.1567463
- Landmann, H., & Rohmann, A. (2020). Being moved by protest: Collective efficacy beliefs and injustice appraisals enhance collective action intentions for forest protection via positive and negative emotions. Journal of Environmental Psychology, 71, Article 101491. https://doi.org/10.1016/j.jenvp.2020.101491
- Lizarazo Pereira, D. M., Schubert, T. W., & Roth, J. (2022). Moved by social justice: The role of Kama Muta in collective action toward racial equality. Frontiers in Psychology, 13, Article 780615. https://doi.org/10.3389/fpsyg.2022.780615
- McCullough, M. E., Emmons, R. A., & Tsang, J. (2002). The grateful disposition: A conceptual and empirical topography. Journal of Personality and Social Psychology, 82(1), 112–127. https://doi.org/10.1037/0022-3514.82.1.112
- McNeish, D., An, J., & Hancock, G. R. (2018). The thorny relation between measurement quality and fit index cutoffs in latent variable models. Journal of Personality Assessment, 100(1), 43–52. https://doi.org/10.1080/00223891.2017.1281286
- McPhetres, J. (2019). Oh, the things you don’t know: awe promotes awareness of knowledge gaps and science interest. Cognition and Emotion, 33(8), 1599–1615. https://doi.org/10.1080/02699931.2019.1585331
- Menninghaus, W., Wagner, V., Hanich, J., Wassiliwizky, E., Kuehnast, M., & Jacobsen, T. (2015). Towards a psychological construct of being moved. PLoS One, 10(6), e0128451. https://doi.org/10.1371/journal.pone.0128451
- Mori, K., & Iwanaga, M. (2021). Being emotionally moved is associated with phasic physiological calming during tonic physiological arousal from pleasant tears. International Journal of Psychophysiology, 159, 47–59. https://doi.org/10.1016/j.ijpsycho.2020.11.006
- Muthén, L. K., & Muthén, B. O. (2002). How to use a Monte Carlo study to decide on sample size and determine power. Structural Equation Modeling: A Multidisciplinary Journal, 9(4), 599–620. https://doi.org/10.1207/S15328007SEM0904_8
- Nakayama, M., Nozaki, Y., Taylor, P. M., Keltner, D., & Uchida, Y. (2020). Individual and cultural differences in predispositions to feel positive and negative aspects of awe. Journal of Cross-Cultural Psychology, 51(10), 771–793. https://doi.org/10.1177/0022022120959821
- Pennycook, G., Cheyne, J. A., Barr, N., Koehler, D. J., & Fugelsang, J. A. (2015). On the reception and detection of pseudo-profound bullshit. Judgment and Decision Making, 10(6), 549–563.
- Piedmont, R. L. (1999). Does spirituality represent the sixth factor of personality? Spiritual transcendence and the five-factor model. Journal of Personality, 67(6), 985–1013. https://doi.org/10.1111/1467-6494.00080
- Piff, P. K., Dietze, P., Feinberg, M., Stancato, D. M., & Keltner, D. (2015). Awe, the small self, and prosocial behavior. Journal of Personality and Social Psychology, 108(6), 883–899. https://doi.org/10.1037/pspi0000018
- Rosseel, Y. (2012). Lavaan: An R package for structural equation modelling and more. Version 0.5–12 (BETA). Journal of Statistical Software, 48(2), 1–36. https://doi.org/10.18637/jss.v048.i02
- Schönbrodt, F. D., & Perugini, M. (2013). At what sample size do correlations stabilize? Journal of Research in Personality, 47(5), 609–612. https://doi.org/10.1016/j.jrp.2013.05.009
- Seibt, B., Schubert, T. W., Zickfeld, J. H., & Fiske, A. P. (2019). Touching the base: Heart-warming ads from the 2016 U.S. election moved viewers to partisan tears. Cognition and Emotion, 33(2), 197–212. https://doi.org/10.1080/02699931.2018.1441128
- Shiota, M. N., Keltner, D., & John, O. P. (2006). Positive emotion dispositions differentially associated with Big Five personality and attachment style. The Journal of Positive Psychology, 1(2), 61–71. https://doi.org/10.1080/17439760500510833
- Simpson, J. A., Rholes, W. S., & Phillips, D. (1996). Conflict in close relationships: An attachment perspective. Journal of Personality and Social Psychology, 71(5), 899–914. https://doi.org/10.1037/0022-3514.71.5.899
- Strick, M., & Van Soolingen, J. (2018). Against the odds: Human values arising in unfavourable circumstances elicit the feeling of being moved. Cognition and Emotion, 32(6), 1231–1246. https://doi.org/10.1080/02699931.2017.1395729
- Voorhees, C. M., Brady, M. K., Calantone, R., & Ramirez, E. (2016). Discriminant validity testing in marketing: An analysis, causes for concern, and proposed remedies. Journal of the Academy of Marketing Science, 44(1), 119–134. https://doi.org/10.1007/s11747-015-0455-4
- Vuoskoski, J. K., & Eerola, T. (2017). The pleasure evoked by sad music is mediated by feelings of being moved. Frontiers in Psychology, 8, 439. https://doi.org/10.3389/fpsyg.2017.00439
- Watson, D., Clark, L. A., & Tellegen, A. (1988). Development and validation of brief measures of positive and negative affect: the PANAS scales. Journal of Personality and Social Psychology, 54(6), 1063–1070. https://doi.org/10.1037/0022-3514.54.6.1063
- Zickfeld, J. H., Schubert, T. W., Seibt, B., Blomster, J. K., Arriaga, P., Basabe, N., Blaut, A., Caballero, A., Carrera, P., Dalgar, I., Ding, Y., Dumont, K., Gaulhofer, V., Gračanin, A., Gyenis, R., Hu, C.-P., Kardum, I., Lazarević, L. B., Mathew, L., … Fiske, A. P. (2019b). Kama muta: Conceptualizing and measuring the experience often labelled being moved across 19 nations and 15 languages. Emotion, 19(3), 402–424. doi:10.1037/emo0000450
- Zickfeld, J. H., Schubert, T. W., Seibt, B., & Fiske, A. P. (2017). Empathic concern is part of a more general communal emotion. Frontiers in Psychology, 8, 723. https://doi.org/10.3389/fpsyg.2017.00723
- Zickfeld, J. H., Schubert, T. W., Seibt, B., & Fiske, A. P. (2019a). Moving through the literature: what is the emotion often denoted being moved? Emotion Review, 11(2), 123–139. https://doi.org/10.1177/1754073918820126