
ABSTRACT
For human interaction, it is important to understand what emotional state others are in. Especially the observation of faces aids us in putting behaviours into context and gives insight into emotions and mental states of others. Detecting whether someone is nervous, a form of state anxiety, is such an example as it reveals a person’s familiarity and contentment with the circumstances. With recent developments in computer vision we developed behavioural nervousness models to show which time-varying facial cues reveal whether someone is nervous in an interview setting. The facial changes, reflecting a state of anxiety, led to more visual exposure and less chemosensory (taste and olfaction) exposure. However, experienced observers had difficulty picking up these changes and failed to detect nervousness levels accurately therewith. This study highlights humans’ limited capacity in determining complex emotional states but at the same time provides an automated model that can assist us in achieving fair assessments of so far unexplored emotional states.
1. Introduction
The human ability to infer the mental state of another person in order to adapt one’s own behaviour is fundamental to effective social communication (Morris & Keltner, Citation2000). Even in the absence of salient emotional cues, having to make do with subtle facial changes (e.g. blushing), humans remain remarkably adept at creating mental models to infer the other person’s thoughts and feelings (Benitez-Quiroz et al., Citation2018). It is often assumed that a small set of core emotions is expressed through prototypical facial muscle configurations (Ekman & Friesen, Citation2003), allowing the observer to decode a myriad of social and emotional information through specific diagnostic face regions. However, in an extensive and influential review, prominent emotion researchers criticise previous efforts to study facial expressions, mainly because the facial expressions of emotional (and other) states vary substantially across individuals, cultures and situations (Barrett et al., Citation2019). Fuelled by substantial evidence for these shortcomings, the authors recommended to systematically study context-specific (and culture-specific) spatiotemporal dynamics of facial expressions. This would mean that each facial muscle change over time per situation needs to be labelled, which would be a time-consuming and challenging task. The process of deciphering facial cues indicative of someone else’s thoughts and feelings requires complex scanning of facial features (Eisenbarth & Alpers, Citation2011). This imposes heavy demands on the allocation of visual attention to spatial locations on the face as demonstrated by far-from-perfect recognition performances (Naber et al., Citation2013), especially when emotional expressions are subtle (Hoffmann et al., Citation2010). Even though extensive efforts have been made to examine the facial cues of discrete emotions (e.g. Wegrzyn et al., Citation2017), the labelling challenge described above likely explains why much less research has been devoted to dynamic and situation-specific facial markers of emotional states.
One such non-primary, well-known and context-dependent emotion is nervousness. Nervousness is a form of state anxiety (Spielberger, Citation1972; Spielberger & Rickman, Citation1990), which is typically described as a temporary increase of feeling tension, apprehension and arousal when faced with threats. Studying and reducing state anxiety is relevant as, for example, elevated levels can hamper recovery after hospital treatments (Gillen et al., Citation2008; Welsh, Citation2000). However, to our knowledge, no scientific literature exists that has investigated the spatiotemporal behavioural (and physiological) patterns that correlate with being in a nervous or anxious state. Here we are specifically interested in the state of nervousness caused by a situation in which a person is judged by others (i.e. psychosocial stressor) rather than by a fear of failure or unknown physical outcome. One can be nervous while familiar with what is to come and without anxiety for an event. In this context, nervousness and the associated facial expressions have not been studied. This is remarkable when considering how often people talk about this feeling in the context of exams, job interviews and other situations in which one is judged. It is important to note though that judgment-evoked nervousness obviously taps into state anxiety and stress that is evoked during tasks such as the Trier Social Stress Test (Kudielka et al., Citation2007). However, the exact “affective program” underlying the subjective feeling of nervousness and the related behavioural and physiological markers of this psychological state remain unknown. Here, we take the first step in filling this gap in the scientific literature by implementing a more objective approach to measuring this emotional state.
In research settings, mental state information is typically inferred from self-report (e.g. validated questionnaires), physiological measures (e.g. facial electromyography, photoplethysmography, electrodermal activity), or observational measures (e.g. labelling of the frequency of emotional expressions). While there are merits to using more objective physiological instruments (e.g. high accuracy, precision and no biases), these measures typically rely on a costly, time-consuming and uncomfortable setup (e.g. wires, placement of electrodes), potentially disrupting participant comfort and natural activity (e.g. restricting bodily movements). Observational techniques also have their limitations, including biases, observer expectancy effects (Greenberg & Folger, Citation2012; Klein et al., Citation2012), bystander effects on participants (e.g. Hawthorne effect; Landsberger, Citation1958), as well as difficulty making causal inferences (Sackett, Citation2015). However, in recent years, computer vision (CV) research has gained tremendous attention, allowing for the development of algorithms that automatically detect and analyse dynamic facial and cardiac activity from video footage (Baltrušaitis et al., Citation2016); remote photoplethysmography: (van der Kooij & Naber, Citation2019). We posit that the implementation of modern CV technology on video footage allows for tracking the spatiotemporal nuances of facial activity, while simultaneously overcoming the limitations of more established physiological measures. Indeed, the findings of several studies suggest that dynamic information facilitates facial processing in humans (Cunningham & Wallraven, Citation2009; Fiorentini & Viviani, Citation2011; Kamachi et al., Citation2013; Krumhuber et al., Citation2013), implying the importance of considering gradients of facial muscle responses for inferring mental states too fleeting, subtle, or complex to detect during normal conditions of social communication.
Few studies used CV to detect dynamic facial information, and aimed to determine states of delight or frustration (Hoque et al., Citation2012), the regulation of emotions (Hoegen et al., Citation2019), or stable trait characteristics (Junior et al., Citation2018; Mehta et al., Citation2019). Also, such models are often trained exclusively on image or video datasets labelled and rated by observers (e.g. (Sutherland et al., Citation2015); but see (Guntuku et al., Citation2015; Liu et al., Citation2016), for introspection-based models), potentially yielding biased or ungrounded models. The present work leveraged the advancements in CV for the development of a novel video-based approach for inferring a complex mental state that evokes subtle changes in facial muscle activity related to emotional distress. Specifically, we demonstrate the feasibility of our unobtrusive method for the automated analysis of spontaneous facial cues using consumer-level webcams for measuring an individual’s state anxiety, that is, more specifically, nervousness. For the first time, we will compare the accuracy and weights of CV features set by machine learning models that predict observer-based nervousness ratings and introspective participant-based nervousness ratings.
2. Methods
2.1. Participants
This study invited two groups of participants, each for two separate purposes. The first group participated as candidates in job interviews to create videos that served as input and stimulus material for non-verbal behaviour assessments by a model and human observers. The second group participated as human observers that rated the candidates on nervousness by inspecting non-verbal behaviour in the videos.
The first group consisted of a total of 154 Dutch students (age: M = 21.8, SD = 2.0, range = 18–26; 70 men, 84 women) recruited through flyers on the campus and social media advertisements. Note that they participated in a larger cohort study on facial behaviour and several mental states during job applications.
The second group consisted of 6 observers (age: M = 29.2, SD = 4.7, range = 23–36), recruited by contacting people on LinkedIn and in our own personal network. All observers were recruiters with ample experience in judging behaviour during interviews. All observers had a bachelor’s degree in higher education and five out of the six observers were female, which is in line with the gender ratio in human resources. The observers had to watch and rate the participants on how nervous they appeared by assessing the nonverbal behaviour of soundless versions of the interview videos of participants. To minimise fatigue, each observer rated 104 rather than all 154 videos and the rating experiment was split up into two sessions separated by at least one day. The observers could rate each video at a self-paced tempo, they received all the time they needed to do so, and they could take breaks as often as preferred. Before starting to rate, the observers were made aware of the three interview questions and self-assessed nervousness question asked to the participants. Videos were shown in random order and observers could indicate nervousness levels on the same scale as the self-report question (Labels: 1 = not nervous at all; 10 = very nervous) after each video. The rating sessions lasted approximately 2 h in total (104 videos of approximately 1 min duration each) and observers received €20 for participation.
All participants provided written informed consent and the study was approved by the local ethics committee of Utrecht University’s Faculty of Social and Behavioural Sciences (#19-079). The participants of the first group either received financial compensation (€6) or study credits for participations. The participants of the second group also received a financial compensation (€24).
2.2. Procedure
This study explored the results of a specific component of a cohort study. In this study participants from the first group practiced performing an online assessment for a mock job position. The assessment included several tasks and questionnaires. We here only report details concerning the interview (active speaking) part of the cohort study. Participants were instructed to perform as well as they can during the interview and to behave as if they were really applying for a job. The interview consisted of three blocks, and per block the participants watched a video of a person asking a question which they answered verbally. The three questions consisted of typical interview inquiries: (1) "What motivates you to work for this company?", (2) "Give an example of a goal you achieved and how you achieved this goal" and (3) "Describe a moment in which you did not agree with fellow group members, and how you went about this". The participants replied after each question and could not see the webcam video footage of themselves during speaking. The total duration of the three answers was on average 115 s (SD = 57). At the end of the cohort study, participants answered several questions with regard to their behaviour during the interview. One of these questions and relevant for the current study was “How nervous did you feel during the interview?” with a 10-point Likert scale for the answer (Only the labels at the extremes were shown; 1 = not at all; 10 = very much). The goal of this question was to see whether the participants’ answers could be predicted by their facial behaviour during the interview. In other words, we aimed to investigate how nervous participants behaved, that is how self-assessed nervousness is expressed in facial muscle movements. Note that we were forced to use a single question because (1) no questionnaires exist on interview nervousness, (2) we had to limit the psychometric questionnaires due to a shortage of time in the already quite extensive cohort study.
2.3. Apparatus
Participants and raters partook in the online study using a Chrome web browser (Google LLC, California, U.S.) on a 17-inch screen laptop that was placed on a table in a lab space with standard lighting conditions. The assessment experiment was programmed in JavaScript and allowed to collect webcam videos using a Logitech (Lausanne, Switzerland) BRIO camera at 1080p with 60 frames per second. The video rating experiment was programmed in Python (Van Rossum & Drake, Citation1995).
2.4. Video analysis
The analysis of the video footage consisted of several processing steps programmed in Python. First, the program called the computer vision toolkit OpenFace (Baltrušaitis et al., Citation2016) determined the activity levels (0: not active; 5: highly active) of 17 action units (AU; for details, see OpenFace Github page; for facial landmark detection, see (a)). In addition to the AU traces, we created activity traces of basic emotional expressions through the combination of AUs using EMFACS categorisation guidelines (Ekman & Friesen, Citation2003). We then removed the time dimension from the data by converting the time traces into several signal features. These facial features included the average activity before (ave.) and after baseline-corrected (base; a low-pass fit is subtracted) traces, the overall trend (decrease or increase) in activity, the frequency of activity crossing a threshold of 1 SD above the median, and the average duration, area and amplitude of these peaks per AU and emotion during the interview.
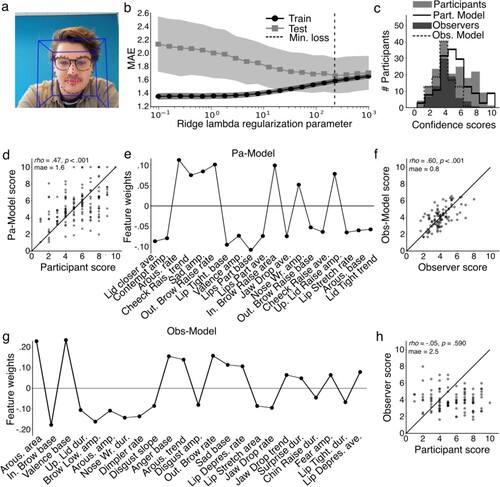
Figure 1. Procedure, analysis and results. a, Example image of a video frame of author M.K. recorded with a webcam and processed by OpenFace. b, Mean absolute error as a function of lambda hyper-parameter (small lambdas typically result in overfits with bad test as compared to train results; large lambdas result in underfit). The optimum lambda is the point where test results are best (lowest MAE) and do not differ much from training results. c, Histogram of nervousness scores determined per party (Pa = participants; Obs = observers). d, Scatter plot showing correlation of nervousness scores by participants themselves versus the participant model that determines participant scores. e, Weights (coefficients; betas; relevance to model) of features of the participant model (dur. = duration, amp. = amplitude, ave. = average, out. = outer, in. = inner, up = upper, wr = wrinkler, rais. = raiser, arous. = arousal, depres. = depressor, tight = tightener). f, Same as panel d but now for scores by observers versus observer model. g, same as panel e but now for observer model. h, same as panel d and f but now for observers versus participant scores.
2.5. Modelling nervousness levels
The removal of the time dimension from the data traces was a necessary pre-processing step for the application of linear regression models to predict nervousness levels from facial features. However, because the feature-to-sample number ratio was biased towards features (>300 features) in numbers, additional dimension reduction needed to be applied. As a next step, we selected 30% of the features that correlated best with the self-assessed confidence scores and had low multicollinearity with the other selected features (i.e. VIF < 10). After feature selection, we used a repeated grid-search cross-validation algorithm for configuration and parameter tuning (Krstajic et al., Citation2014) and tested a final model on all the data. This is a typical machine learning rather than statistical approach and reaches more appropriate and reliable results for models that should be deployed operationally (Tsamardinos et al., Citation2018) (for potential applications, see Discussion). More specifically, we first trained a linear Ridge regression model to predict the introspective, participant-assessed nervousness scores with the facial features as input. Ridge models were chosen as, in contrast to more sophisticated machine learning models (e.g. random forests), these provide (1) insight into the importance of each predicting feature and (2) more reliable estimates while taking into account multicollinearity. We created a total of 20 models, each with a different Ridge regularisation parameter (i.e. hyper-parameter; lambda range: log of −3 to the log of −1) to find the best model fit and prevent model under- or over-fit. Because of the relatively low number of samples, we applied a repeated hold-out protocol, choosing a computationally-demanding rather than standard cross-validation approach that exploits only k-fold versions of training and test sample divisions. For each regularisation parameter we randomly divided the samples in train (90%; n = 138) and test (10%; n = 16) in 1000 iterations. Per iteration, we trained a new model and calculated the mean absolute error (MAE) between the modelled nervousness scores and participant-assessed nervousness scores. We took the median MAE across all iterations per regularisation parameter and then selected the lambda with the lowest MAE (see vertical line in (b)). The selected lambda of 233 formed the basis for the final participant-based model for training on the full dataset (in practice this may incorporate a 5–10% overfit bias). To simplify the final model, we stepwise removed features with p-values above 0.75. The above steps were repeated for a second model trained to predict observer-based nervousness scores (lambda of observer-based-model = 34).
3. Results
The following result sections focus on the comparison of nervousness scores produced by the questionnaires and models. Four different score types were collected: (1) participant scores (i.e. introspectively assessed scores by the participants after the interview); (2) participant-assessed score model predictions (i.e. scores by a cross-validated Ridge regression model, trained to link facial features to the participant-assessed scores; train fit as a function of model regularisation was assessed on MAE as shown in (b)); (3) observer scores (i.e. scores by observers that viewed the videos of participants); and (4) observer-assessed score model predictions (i.e. scores by a model, trained to link facial features of participants to scores assessed by observers).
3.1. Score range comparisons
The range of participant-assessed nervousness scores fell between 1 and 10 (M = 5.3, SD = 2.1), indicating that the scores varied substantially (see solid black line in (c)). The participant-assessed score model predicted a similar distribution of scores based on the facial behaviour of participants (range: 1–10; M = 5.4, SD = 2.0; see dotted black line in (c)). The scores of observers, however, fell within a biased distribution (range: 2–8; M = 4.0; SD = 1.2; see solid grey line in (c)), had low inter-rater reliability (Krippendorff’s alpha = 0.14), which the observers-assessed score model reproduced (range: 2-7; M = 4.0; SD = 1.2; see dotted grey line in (c)).
3.2. Model and participant comparisons for participant-assessed nervousness
The overlapping rather than random score distributions of the participant-assessed model served as the first confirmation that the model captures introspective nervousness levels. To further demonstrate the model’s above-chance performance in determining nervousness levels, we calculated a Spearman correlation between participant- and model-scores. These scores were comparable, as indicated by a positive and significant correlation (rho = .47, p < .001), and a mean score deviation of 1.6 across all participants ((d)). Setting a signal detection threshold at a nervousness score of 5.0 (i.e. 80% percentile; for other threshold selections, see Supplemental online material), the model dissociates between the least (20% percentile) and most nervous (>80%) participants reasonably well (Hit rate: 0.7; False alarm rate: 0.1). If the goal is to select the 20% most nervous participants, then the probability to select a participant with a much lower nervousness score (percentile <20%) is 0% (vs. 20% chance level).
The facial features that the model used to determine scores were scattered across the face, including effects for the lips, cheeks, nose, eyebrows and lids, and for the emotional expressions of contempt and sadness (for all feature weights, see (e)). After inspection of the feature weights and signs, we concluded that participants expressed nervousness mostly through opening of the eyes, closing and deactivation of the lips, many episodes of eyebrow raises, cheek raises, and nose wrinkles, and weak negative valence, strong sadness, and weak contempt expressions (see amplitudes). These results add support to the initial conclusion that the computer vision model could successfully determine a person’s introspectively-assessed nervousness levels through facial behaviour analysis.
3.3. Model and observer comparisons for observer-assessed nervousness
The question now remains how observers interpret facial behaviour to detect nervousness. The scores of observers and the observer-assessed model correlated significantly and positively ((f); rho = .60, p < .001), and the model scores deviated on average only weakly from the observer scores (MAE = 0.8). The relevant features for the model included mostly features around the brows and chin, and a variety of negative expressions. According to the observers, a participant mostly expressed nervousness by a continuous (weak amplitudes and thus few changes) downward position of the inner part of eyebrows and upward position of the outer parts, overall presence of an angry and sad expression, many long and/or strong (area) arousal expressions, short nose wrinkling and chin raising episodes, and the gradual dropping of the jaw during the interview ((g)). These results suggest that, in order to determine nervousness through subjective observation, observers pay attention to different facial features than those that reflect introspective, participant-assessed nervousness levels.
3.4. Participant and observer comparisons
The latter results raised the question of to what degree introspective nervousness scores overlap with observed nervousness scores. To further inspect whether observers agree with the participants on their nervousness scores, we calculated a correlation between the scores of these two parties. This correlation was weak and not significant ((h); rho = −0.05, p = .590; MAE = 2.5), indicating that observers rate something totally different than participants themselves.
4. Discussion
This study examined a methodological computer vision implementation as an objective measurement of spontaneous, dynamic facial behaviour to determine state anxiety – more specifically, nervousness levels – of participants during interviews. It provides evidence that this behaviour can indeed be linked to the introspectively-determined mental state nervousness. As such, this is the first implementation of an automated approach to classify a so far unexplored, non-primary emotion through the analysis of nonverbal, time-varying facial behaviour. Some studies took objective clustering approaches to classify primary emotions from videos with posed or natural dynamical expressions (Hoque et al., Citation2012), static pictures of faces (Sutherland et al., Citation2013), or short videos in which posed emotional expressions dynamically appear and then immediately disappear (Alves, Citation2013; Jack et al., Citation2014; Krumhuber et al., Citation2013). Here we report on analyses of nervous behaviour using much longer video recordings and analyses of a full spectrum of facial action units that spontaneously changed during an interview task. Such extended measurements of spontaneous facial, emotional behaviour have received almost no scientific attention (but for facial measurements during non-emotional mental states, eye-brow action unit analysis, or emotion regulation, see (Hoegen et al., Citation2019; Kappen & Naber, Citation2021; Valstar et al., Citation2006)). The applied paradigm enables us to identify and model how a mental state, like nervousness, expresses itself in time-varying patterns of facial action units. With the successful implementation of computer vision and machine learning models to determine mental states, the results point at a more accurate assessment of fleeting mental states than stable personality traits (for reviews, see (Agastya et al., Citation2019; Ilmini & Fernando, Citation2017; Mehta et al., Citation2019)).
A second result of the current study is that nervousness ratings by experienced recruiters do not match the introspective ratings of the individuals themselves. In fact, the observing recruiters were pretty bad at determining nervousness levels of the target individuals. It is known that observers have difficulty detecting and associating non-verbal behaviours to lying or deception (DePaulo & Morris, Citation2004; Vrij et al., Citation2019), but we find it rather surprising that observers also lack this skill in the context of states of anxiety. The fact that observers could not correctly identify non-verbal behaviour to determine nervousness, does not necessarily mean that this behaviour has no functional relevance. The non-verbal expression of nervousness may primarily have a self-serving biological rather than an other-serving social (warning) function.
Evidence for the latter was found in the analysis of the changes to action units in very nervous individuals. When considering introspective nervousness scores as ground truth, nervousness shows itself as a combination of activation and deactivation of individual action units and emotional expressions. A holistic interpretation of the pattern of facial changes associated with a state of nervousness can best be described as a facilitation of visual input (eyes opened, raised eyebrows) and the prevention of physical and chemical input, mediated by a form of disgust (closing of lips and nose). Such behaviour makes sense in an uncertain (and perhaps unsafe) environment that requires the monitoring of the surroundings (Susskind et al., Citation2008) while minimising physical interaction with the environment through for example taste and smell (Chapman et al., Citation2009). Nervousness thus reflects a combination of sensory exposure and disclosure, suggesting a bimodal distribution on the approach/avoidance (appetitive/aversive) axis of a recognised emotional model (Lang et al., Citation1990).
While the facial behaviour measurements were of objective nature, it is worth mentioning that the models that linked behaviour to the state of nervousness were trained with subjective (introspective, self-report) labels. The utility of self-report measures, even those with adequate validity and reliability, is impeded by the participant’s conscious and unconscious response distortion, such as social desirability (Mezulis et al., Citation2004; Van de Mortel, Citation2008; Viswesvaran & Ones, Citation1999), and various forms of bias (for an overview, see Dunning et al., Citation2004). These aspects may have distorted or, at least, invoked noise in the video annotations. Nonetheless, the signal-to-noise ratio of the introspective labels was high enough to create a model that can make significantly accurate predictions as to what degree a person is nervous during interviews.
One particularly remarkable finding was that the model was able to determine the self-reported nervousness levels better than human observers. The results suggest that observers pay attention to other facial changes than those that actually occur when a person is (or thinks being) in a nervous state. Observers apparently look for continuous expressions related to frustration, mostly reflected in the typical V-like positioning of the eyebrows. It makes sense that observers pick up on more salient expressions more easily, especially when these are expressed all the time. Observers experience many challenges – mostly caused by attentional capacity limits during multi-object tracking – when only subtle and dynamic facial properties, such as the frequency and amplitudes of expressive episodes, give away a person’s mental state (Naber et al., Citation2013). Nonetheless, the mismatch between and outperformance of computer vision (objective, though trained on introspective and subjective labels) observations over human (subjective) observations raises the question of whether human judgments should be considered as ground truth.
Another hallmark question is whether the observation of someone’s behaviour without access to priors (e.g. based on feedback from participants) leads to more reliable judgments than when relying on introspective observation of one’s own feelings. This has been an ongoing debate since centuries, as reflected in fluctuations in their popularity associated with the dominance of psychological schools such as behaviourism and gestaltism (Lieberman, Citation1979). Although both study approaches incorporate a subjective aspect, we here lean towards favouring introspective above observational assessments because individuals themselves have direct access to how nervous they feel and observer ratings tend to be inconsistent. While both observation (what did I see?) and introspection (how did I feel?) are subject to internal noise and perhaps memory biases (Coles & Heimberg, Citation2002; Herrera et al., Citation2017), observers lack direct access to another person’s central and peripheral nervous system, which are both likely subject to change when entering a heightened state of nervousness.
The current study assessed the observational judgments of only 6 recruiters, which means that the low inter-rater reliability needs to be interpreted with some caution. Nevertheless, our results are in line with previous studies showing both low reliabilities (Huffcutt et al., Citation2013) and biases in judgments (James et al., Citation1984; Lippens et al., Citation2023; Moss-Racusin et al., Citation2012; Riach & Rich, Citation2002). The low reliabilities can be due to either (i) a lacking validity in the measurement (i.e. nervousness would be a concept without ground truth) or (ii) the limited to no access to ground truth by the raters. As nervousness could be successfully determined by a computer vision model, this convincingly suggests that nervousness is a valid and existential concept, but that raters had no access to the ground truth.
One potential reason for why recruiters cannot rate a candidate’s nervousness level is that they never received training to observe and interpret non-verbal behaviour to determine states of anxiety. Nervousness may not always be a relevant state to assess. Nevertheless, if nervousness is a factor of interest during job interviews, for example when a job requires a confident employee, it is unlikely that recruiters discuss and receive (honest) feedback from candidates about their nervousness judgment. It may not always be appropriate to express a nervousness judgment to a candidate. Such conditions prevent recruiters to learn, creating a general problem in recruitment. Even when a certain mental state is intrinsically relevant, such as a candidate’s motivation to work for a company, non-verbal-behaviour-based judgments by observers remain inaccurate (Kappen & Naber, Citation2021). Another reason for why nonverbal behaviour is not correctly interpreted by recruiters, is that they may focus mostly on verbal aspects (i.e. the content of what is said). To test this possibility, future research would have to elucidate what non-verbal and verbal expressions together tell about a candidates mental states and on which aspects observers rely most. Another line of research that requires exploring relates to the generalisability of the current findings. Emotional expressions are known to vary considerably across cultures and contexts (Barrett et al., Citation2019). As such, it would be interesting to conduct a cross-cultural study on nervousness in a variety of (interactive) settings with different contexts and tasks (e.g. classroom presentations). Lastly, although observers had difficulty determining an average nervousness score, they may show above chance performance if allowed to rate nervousness on a moment-by-moment scale (e.g. per video frame). The continuous report of emotional states has successfully been used in the past (Zaki et al., Citation2008; Zaki et al., Citation2009) and may provide insights into how nervousness fluctuates over time.
In conclusion, this study shows that more valid and reliable observations can be made by computer vision and artificial intelligence than by humans, at least when considering introspective feelings as ground truth. As such, an interesting line of future research to pursue could be the investigation of the accuracy of the nervousness detection models in other tasks, like in social or real-life rather than online settings, such as the Trier Stress Test (Allen et al., Citation2017; Linares et al., Citation2020). If model generalisation is positive, potential applications could then be, for example, the use of feedback during nervousness suppression training (e.g. Kim et al., Citation2017), an objective nervousness detection method during police interrogations (e.g. Strömwall et al., Citation2006), or the monitoring of soldiers in combat situations (e.g. Tornero-Aguilera et al., Citation2018).
Author contributions
Authors MKa and MN designed the experiment. Author MKa collected the data. MN analysed the data. Authors MN and MKu wrote the first versions of the paper and author MKa edited the final paper. All authors approved the final version of the manuscript for submission.
Supplemental_online_material.docx
Download MS Word (234.8 KB)Acknowledgements
We thank the students Roxana Alexandru, Piet Jonker, Sjors van de Ven, Rosemarijn Damen, and Neurolytics employees Juan Rivas, Lianne Hamhuis, Felix Hermsen and Belen Hein for their help during data collection and their contributions to the development of the assessment. This study was financially supported by the NWO take-off valorisation grant (number 17777).
Disclosure statement
Authors MKa and MKu declare no competing interests. Author MN declares to have received equity in a start-up company in exchange for the valorisation, supported by the Dutch Scientific Institute for Research (NWO), of the here reported models.
Data availability
The data that support the findings of this study can be requested at Neurolytics BV but restrictions apply to the availability of these data, which were provided under licence to the current study, and so are not publicly available. Data are however available from the authors upon reasonable request and with permission of Neurolytics BV. The code that is used to generate the results of this study can be requested at Neurolytics BV but restrictions apply to the availability of this code, which is developed in collaboration with, and is part of the intellectual property of Neurolytics BV, and so is not publicly available. Enquiries can be sent to [email protected].
Additional information
Funding
References
- Agastya, I. M. A., Handayani, D. O. D., & Mantoro, T. (2019). A systematic literature review of deep learning algorithms for personality trait recognition. 2019 5th International Conference on Computing Engineering and Design (ICCED). https://doi.org/10.1109/ICCED46541.2019.9161107
- Allen, A. P., Kennedy, P. J., Dockray, S., Cryan, J. F., Dinan, T. G., & Clarke, G. (2017). The trier social stress test: Principles and practice. Neurobiology of Stress, 6, 113–126. https://doi.org/10.1016/j.ynstr.2016.11.001
- Alves, N. T. (2013). Recognition of static and dynamic facial expressions: A study review. Estudos de Psicologia (Natal), 18(1), 125–130. https://doi.org/10.1590/S1413-294X2013000100020
- Baltrušaitis, T., Robinson, P., & Morency, L.-P.. (2016). Openface: An open source facial behavior analysis toolkit. 2016 IEEE Winter Conference on Applications of Computer Vision (WACV). https://doi.org/10.1109/WACV.2016.7477553
- Barrett, L. F., Adolphs, R., Marsella, S., Martinez, A. M., & Pollak, S. D. (2019). Emotional expressions reconsidered: Challenges to inferring emotion from human facial movements. Psychological Science in the Public Interest, 20(1), 1–68. https://doi.org/10.1177/1529100619832930
- Benitez-Quiroz, C. F., Srinivasan, R., & Martinez, A. M. (2018). Facial color is an efficient mechanism to visually transmit emotion. Proceedings of the National Academy of Sciences, 115(14), 3581–3586. https://doi.org/10.1073/pnas.1716084115
- Chapman, H. A., Kim, D. A., Susskind, J. M., & Anderson, A. K. (2009). In bad taste: Evidence for the oral origins of moral disgust. Science, 323(5918), 1222–1226. https://doi.org/10.1126/science.1165565
- Coles, M. E., & Heimberg, R. G. (2002). Memory biases in the anxiety disorders. Clinical Psychology Review, 22(4), 587–627. https://doi.org/10.1016/S0272-7358(01)00113-1
- Cunningham, D. W., & Wallraven, C. (2009). Dynamic information for the recognition of conversational expressions. Journal of Vision, 9(13), 7–7. https://doi.org/10.1167/9.13.7
- DePaulo, B. M., & Morris, W. L. (2004). Discerning lies from truths: Behavioral cues to deception and the indirect pathway of intuition. In B. M. DePaulo, W. L. Morris, & P. A. Granhag (Eds.), The detection of deception in forensic contexts (pp. 15–40). Cambridge.
- Dunning, D., Heath, C., & Suls, J. M. (2004). Flawed self-assessment. Psychological Science in the Public Interest, 5(3), 69–106. https://doi.org/10.1111/j.1529-1006.2004.00018.x
- Eisenbarth, H., & Alpers, G. W. (2011). Happy mouth and sad eyes: Scanning emotional facial expressions. Emotion, 11(4), 860. https://doi.org/10.1037/a0022758
- Ekman, P., & Friesen, W. V. (2003). Unmasking the face: A guide to recognizing emotions from facial clues. Ishk.
- Fiorentini, C., & Viviani, P. (2011). Is there a dynamic advantage for facial expressions? Journal of Vision, 11(3), 17–17. https://doi.org/10.1167/11.3.17
- Gillen, E., Biley, F., & Allen, D. (2008). Effects of music listening on adult patients’ pre-procedural state anxiety in hospital. International Journal of Evidence-Based Healthcare, 6(1), 24–49. https://doi.org/10.1111/j.1744-1609.2007.00097.x
- Greenberg, J., & Folger, R. (2012). Controversial issues in social research methods. Springer Science & Business Media.
- Guntuku, S. C., Qiu, L., Roy, S., Lin, W., & Jakhetiya, V. (2015). Do others perceive you as you want them to? Modeling personality based on selfies. Proceedings of the 1st International Workshop on Affect & Sentiment in Multimedia. https://doi.org/10.1145/2813524.2813528
- Herrera, S., Montorio, I., Cabrera, I., & Botella, J. (2017). Memory bias for threatening information related to anxiety: An updated meta-analytic review. Journal of Cognitive Psychology, 29(7), 832–854. https://doi.org/10.1080/20445911.2017.1319374
- Hoegen, R., Gratch, J., Parkinson, B., & Shore, D. (2019). Signals of emotion regulation in a social dilemma: Detection from face and context. 2019 8th International Conference on Affective Computing and Intelligent Interaction (ACII). https://doi.org/10.1109/ACII.2019.8925478
- Hoffmann, H., Kessler, H., Eppel, T., Rukavina, S., & Traue, H. C. (2010). Expression intensity, gender and facial emotion recognition: Women recognize only subtle facial emotions better than men. Acta Psychologica, 135(3), 278–283. https://doi.org/10.1016/j.actpsy.2010.07.012
- Hoque, M. E., McDuff, D. J., & Picard, R. W. (2012). Exploring temporal patterns in classifying frustrated and delighted smiles. IEEE Transactions on Affective Computing, 3(3), 323–334. https://doi.org/10.1109/T-AFFC.2012.11
- Huffcutt, A. I., Culbertson, S. S., & Weyhrauch, W. S. (2013). Employment interview reliability: New meta-analytic estimates by structure and format. International Journal of Selection and Assessment, 21(3), 264–276. https://doi.org/10.1111/ijsa.12036
- Ilmini, W., & Fernando, T. (2017). Computational personality traits assessment: A review. 2017 IEEE International Conference on Industrial and Information Systems (ICIIS). https://doi.org/10.1109/ICIINFS.2017.8300416
- Jack, R. E., Garrod, O. G., & Schyns, P. G. (2014). Dynamic facial expressions of emotion transmit an evolving hierarchy of signals over time. Current Biology, 24(2), 187–192. https://doi.org/10.1016/j.cub.2013.11.064
- James, L. R., Demaree, R. G., & Wolf, G. (1984). Estimating within-group interrater reliability with and without response bias. Journal of Applied Psychology, 69(1), 85. https://doi.org/10.1037/0021-9010.69.1.85
- Junior, J., Jacques, C., Güçlütürk, Y., Pérez, M., Güçlü, U., Andujar, C., & van Gerven, M. (2018). First impressions: A survey on computer vision-based apparent personality trait analysis. arXiv preprint arXiv:1804.08046.
- Kamachi, M., Bruce, V., Mukaida, S., Gyoba, J., Yoshikawa, S., & Akamatsu, S. (2013). Dynamic properties influence the perception of facial expressions. Perception, 42(11), 1266–1278. https://doi.org/10.1068/p3131n
- Kappen, M., & Naber, M. (2021). Objective and bias-free measures of candidate motivation during job applications. Scientific Reports, 11(1), 1–8. https://doi.org/10.1038/s41598-021-00659-y
- Kim, H. E., Hong, Y.-J., Kim, M.-K., Jung, Y. H., Kyeong, S., & Kim, J.-J. (2017). Effectiveness of self-training using the mobile-based virtual reality program in patients with social anxiety disorder. Computers in Human Behavior, 73, 614–619. https://doi.org/10.1016/j.chb.2017.04.017
- Klein, O., Doyen, S., Leys, C., Magalhães de Saldanha da Gama, P. A., Miller, S., Questienne, L., & Cleeremans, A. (2012). Low hopes, high expectations. Perspectives on Psychological Science, 7(6), 572–584. https://doi.org/10.1177/1745691612463704
- Krstajic, D., Buturovic, L. J., Leahy, D. E., & Thomas, S. (2014). Cross-validation pitfalls when selecting and assessing regression and classification models. Journal of Cheminformatics, 6(1), 1–15. https://doi.org/10.1186/1758-2946-6-10
- Krumhuber, E. G., Kappas, A., & Manstead, A. S. (2013). Effects of dynamic aspects of facial expressions: A review. Emotion Review, 5(1), 41–46. https://doi.org/10.1177/1754073912451349
- Kudielka, B. M., Hellhammer, D. H., & Kirschbaum, C.. (2007). Ten years of research with the trier social stress test-revisited . In E. Harmon-Jones & P. Winkielman (EDS.), Social neuroscience: Integrating biological and psychological explanations of social behavior (pp. 56–83). The Guilford Press.
- Landsberger, H. A. (1958). Hawthorne revisited: Management and the worker, its critics, and developments in human relations in industry.
- Lang, P. J., Bradley, M. M., & Cuthbert, B. N. (1990). Emotion, attention, and the startle reflex. Psychological Review, 97(3), 377. https://doi.org/10.1037/0033-295X.97.3.377
- Lieberman, D. A. (1979). Behaviorism and the mind: A (limited) call for a return to introspection. American Psychologist, 34(4), 319. https://doi.org/10.1037/0003-066X.34.4.319
- Linares, N. N., Charron, V., Ouimet, A., Labelle, P., & Plamondon, H. (2020). A systematic review of the Trier Social Stress Test methodology: Issues in promoting study comparison and replicable research. Neurobiology of Stress, 13, 100235. https://doi.org/10.1016/j.ynstr.2020.100235
- Lippens, L., Vermeiren, S., & Baert, S. (2023). The state of hiring discrimination: A meta-analysis of (almost) all recent correspondence experiments. European Economic Review, 151, 104315. https://doi.org/10.1016/j.euroecorev.2022.104315
- Liu, L., Preotiuc-Pietro, D., Samani, Z. R., Moghaddam, M. E., & Ungar, L. (2016). Analyzing personality through social media profile picture choice. Proceedings of the International AAAI Conference on Web and Social Media. https://doi.org/10.1609/icwsm.v10i1.14738
- Mehta, Y., Majumder, N., Gelbukh, A., & Cambria, E. (2019). Recent trends in deep learning based personality detection. Artificial Intelligence Review, 1–27. https://doi.org/10.1007/s10462-019-09770-z
- Mezulis, A. H., Abramson, L. Y., Hyde, J. S., & Hankin, B. L. (2004). Is there a universal positivity bias in attributions? A meta-analytic review of individual, developmental, and cultural differences in the self-serving attributional bias. Psychological Bulletin, 130(5), 711. https://doi.org/10.1037/0033-2909.130.5.711
- Morris, M. W., & Keltner, D. (2000). How emotions work: The social functions of emotional expression in negotiations. Research in Organizational Behavior, 22, 1–50. https://doi.org/10.1016/S0191-3085(00)22002-9
- Moss-Racusin, C. A., Dovidio, J. F., Brescoll, V. L., Graham, M. J., & Handelsman, J. (2012). Science faculty’s subtle gender biases favor male students. Proceedings of the National Academy of Sciences, 109(41), 16474–16479. https://doi.org/10.1073/pnas.1211286109
- Naber, M., Stoll, J., Einhäuser, W., & Carter, O. (2013). How to become a mentalist: Reading decisions from a competitor’s pupil can be achieved without training but requires instruction. PLoS One, 8(8), e73302. https://doi.org/10.1371/journal.pone.0073302
- Riach, P. A., & Rich, J. (2002). Field experiments of discrimination in the market place. The Economic Journal, 112(483), F480–F518. https://doi.org/10.1111/1468-0297.00080
- Sackett, D. L. (2015). Why did the randomized clinical trial become the primary focus of my career? Value in Health, 18(5), 550–552. https://doi.org/10.1016/j.jval.2015.04.001
- Spielberger, C. D. (1972). Anxiety as an emotional state. Anxiety-current trends and theory (pp. 23–49).
- Spielberger, C. D., & Rickman, R. L. (1990). Assessment of state and trait anxiety. Anxiety: Psychobiological and clinical perspectives (pp. 69–83).
- Strömwall, L. A., Hartwig, M., & Granhag, P. A. (2006). To act truthfully: Nonverbal behaviour and strategies during a police interrogation. Psychology, Crime & Law, 12(2), 207–219. https://doi.org/10.1080/10683160512331331328
- Susskind, J. M., Lee, D. H., Cusi, A., Feiman, R., Grabski, W., & Anderson, A. K. (2008). Expressing fear enhances sensory acquisition. Nature Neuroscience, 11(7), 843–850. https://doi.org/10.1038/nn.2138
- Sutherland, C. A., Oldmeadow, J. A., Santos, I. M., Towler, J., Burt, D. M., & Young, A. W. (2013). Social inferences from faces: Ambient images generate a three-dimensional model. Cognition, 127(1), 105–118. https://doi.org/10.1016/j.cognition.2012.12.001
- Sutherland, C. A., Rowley, L. E., Amoaku, U. T., Daguzan, E., Kidd-Rossiter, K. A., Maceviciute, U., & Young, A. W. (2015). Personality judgments from everyday images of faces. Frontiers in Psychology, 6, 1616. https://doi.org/10.3389/fpsyg.2015.01616
- Tornero-Aguilera, J. F., Robles-Pérez, J. J., & Clemente-Suárez, V. J. (2018). Use of psychophysiological portable devices to analyse stress response in different experienced soldiers. Journal of Medical Systems, 42(4), 1–9. https://doi.org/10.1007/s10916-018-0929-2
- Tsamardinos, I., Greasidou, E., & Borboudakis, G. (2018). Bootstrapping the out-of-sample predictions for efficient and accurate cross-validation. Machine Learning, 107(12), 1895–1922. https://doi.org/10.1007/s10994-018-5714-4
- Valstar, M. F., Pantic, M., Ambadar, Z., & Cohn, J. F. (2006). Spontaneous vs. Posed facial behavior: Automatic analysis of brow actions. Proceedings of the 8th International Conference on Multimodal Interfaces. https://doi.org/10.1145/1180995.1181031
- Van de Mortel, T. F. (2008). Faking it: Social desirability response bias in self-report research. Australian Journal of Advanced Nursing, The, 25(4), 40–48.
- van der Kooij, K. M., & Naber, M. (2019). An open-source remote heart rate imaging method with practical apparatus and algorithms. Behavior Research Methods, 51(5), 2106–2119. https://doi.org/10.3758/s13428-019-01256-8
- Van Rossum, G., & Drake, F. L. (1995). Python reference manual (pp. 1–59). Centrum voor Wiskunde en Informatica.
- Viswesvaran, C., & Ones, D. S. (1999). Meta-analyses of fakability estimates: Implications for personality measurement. Educational and Psychological Measurement, 59(2), 197–210. https://doi.org/10.1177/00131649921969802
- Vrij, A., Hartwig, M., & Granhag, P. A. (2019). Reading lies: Nonverbal communication and deception. Annual Review of Psychology, 70(1), 295–317. https://doi.org/10.1146/annurev-psych-010418-103135
- Wegrzyn, M., Vogt, M., Kireclioglu, B., Schneider, J., & Kissler, J. (2017). Mapping the emotional face. How individual face parts contribute to successful emotion recognition. PloS one, 12(5), e0177239. https://doi.org/10.1371/journal.pone.0177239
- Welsh, J. (2000). Reducing patient stress in theatre. British Journal of Perioperative Nursing (United Kingdom), 10(6), 321–327. https://doi.org/10.1177/175045890001000605
- Zaki, J., Bolger, N., & Ochsner, K. (2008). It takes Two. Psychological Science, 19(4), 399–404. https://doi.org/10.1111/j.1467-9280.2008.02099.x
- Zaki, J., Weber, J., Bolger, N., & Ochsner, K. (2009). The neural bases of empathic accuracy. Proceedings of the National Academy of Sciences, 106(27), 11382–11387. https://doi.org/10.1073/pnas.0902666106