
 ?Mathematical formulae have been encoded as MathML and are displayed in this HTML version using MathJax in order to improve their display. Uncheck the box to turn MathJax off. This feature requires Javascript. Click on a formula to zoom.
ABSTRACT
The mechanisms by which delusion and anxiety affect the tendency to make hasty decisions (Jumping-to-Conclusions bias) remain unclear. This paper proposes a Bayesian computational model that explores the assignment of evidence weights as a potential explanation of the Jumping-to-Conclusions bias using the Beads Task. We also investigate the Beads Task as a repeated measure by varying the key aspects of the paradigm. The Bayesian model estimations from two online studies showed that higher delusional ideation promoted reduced belief updating but the impact of general and social anxiety on evidence weighting was inconsistent. The altered evidence weighting as a result of a psychopathological trait appeared insufficient in contributing to the Jumping-to-Conclusions bias. Variations in Beads Task aspects significantly affected subjective certainty at the point of decisions but not the number of draws to decisions. Repetitions of the Beads Task are feasible if one assesses the Jumping-to-Conclusions bias using number of draws to decisions.
Introduction
Numerous studies have investigated the tendency to make hasty decisions based on relatively little evidence (i.e., Jumping-to-Conclusions (JTC) bias) as a vulnerability and maintaining factor across different psychopathologies such as psychosis, depression, and anxiety disorders (Ross et al., Citation2015). The JTC bias is commonly measured using a probabilistic reasoning paradigm known as the Beads Task (BT; Phillips & Edwards, Citation1966). In a Classic BT, participants are presented with two jars: one has mainly red beads (e.g. 85 red beads and 15 blue beads) and the other jar has mainly blue beads (e.g. 85 blue beads and 15 red beads). Participants are told that one of the jars is randomly chosen behind a screen. Unbeknown to the participants, beads are not drawn from a jar and instead are presented as a standardised, predetermined sequence. Participants are required to ask for beads to be individually drawn and presented until they are ready to make a decision about the source of beads, Jar A or Jar B. Participants who request two or fewer beads before making a decision are considered to demonstrate the JTC bias (Garety et al., Citation2011). In some BT variations, participants are also required to report their subjective certainty after each bead is drawn (Huq et al., Citation1988; Moritz & Woodward, Citation2005).
Meta-analyses show that the presence of clinical delusions (usually as part of a psychotic disorder) is associated with a greater JTC bias (Dudley et al., Citation2016; Ross et al., Citation2015). However, some research has also shown that both high- and low-delusion prone individuals gathered significantly lesser information compared to a rational optimal point, indicating that individuals experiencing a continuum of delusional proneness may be equally vulnerable to JTC bias (van der Leer et al., Citation2015). Meanwhile, anxiety is often investigated as a part of the relationship between delusions and JTC bias because of a shared hypersensitivity towards threat-related information and vulnerability to the belief that there is danger (Dudley & Over, Citation2003; Wong & Rapee, Citation2016). Bensi and Giusberti (Citation2007) found that higher trait anxiety was associated with significantly greater JTC bias, but other researchers have also observed that individuals with higher social and state anxiety requested more beads than controls (Johnstone et al., Citation2017; Schlier et al., Citation2016). It has been difficult to ascertain the reasons for variable effects across disorders, owing, at least in part, to a lack of understanding as to the underlying mechanisms of the JTC bias.
Emerging computational psychiatry research suggests that participants experiencing clinical delusions or paranoia may engage in noisy decision-making processes, have lowered decision threshold, and/or overweight their prior beliefs (Ashinoff et al., Citation2022; Moutoussis et al., Citation2011; Rubio et al., Citation2011). All of these factors could lead to a JTC bias. Some researchers also suggest that people experiencing delusions may also show JTC bias because of a tendency to favour weak evidence or an unlikely interpretation of an event (Speechley et al., Citation2010). These proposed mechanisms have shed light on potential ways the JTC bias may arise in the context of delusional symptomatology, but it remains uncertain if the same mechanisms apply to other psychopathological symptoms such as anxiety (Bensi & Giusberti, Citation2007; Johnstone et al., Citation2017; Schlier et al., Citation2016). Some researchers speculated that individuals experiencing high anxiety engaged in the JTC bias to reduce uncertain states (Bensi & Giusberti, Citation2007), but the replication of this result has been unsuccessful (Johnstone et al., Citation2017).
To address this limitation, we aimed to propose a computational model that directly incorporates a psychopathological trait (can be a binary or categorical variable) and assesses the influence of this trait on the belief-updating process measured in the BT. This means that our model can be widely applied across any psychological variables by substituting the trait parameter in the computational model using scores from any measures. Drawing upon the theoretical frameworks suggested by Moutoussis et al. (Citation2011) and Speechley et al. (Citation2012), we aimed to investigate the influences of psychopathological traits on the assignment of evidence weights as a potential way to explain JTC bias. Evidence weighting is particularly interesting as cognitive models of psychopathologies consistently highlight the hypersensitivity of affected individuals towards perceived threats or irrelevant information, suggesting differences in selective information processing (Beck & Clark, Citation1997; Freeman, Citation2007; Pankow et al., Citation2016; Wong & Rapee, Citation2016; Zawadzki et al., Citation2012). For example, researchers have found that individuals with higher social and general anxiety symptoms tend to update their emotions using more negatively-valanced than positively-valanced social information (Aylward et al., Citation2019; Koban et al., Citation2017). Similarly, individuals with delusion tend to notice more threat-related information and seek evidence confirming these perceived threats (Freeman, Citation2007). These research findings collectively suggest that individuals experiencing higher delusional ideation and anxiety symptoms may assign uneven weights to threat-related information to update the beliefs about their environment which could lead to hasty conclusions about one’s environment.
However, unlike delusional ideation, biases in general and social anxiety are more likely to be observed in the presence of threat cues (Beck & Clark, Citation1997; Wong & Rapee, Citation2016). We expected that individuals experiencing higher general or social anxiety levels may not exhibit biases in belief updating in the Classic BT since the stimuli presented (coloured beads) are irrelevant with the anxiety subtype (e.g. the Classic BT presents innocuous stimuli and voids threat cues such as social evaluative feedback that are known to trigger interpretation biases among those with social anxiety). On the contrary, some researchers have shown that individuals with clinical delusions exhibit a higher tendency to over-adjust their probability estimations towards the source of information matching the current piece of evidence observed in the Classic BT (Speechley et al., Citation2010, Citation2012). Thus, delusional ideation appears to be associated with altered evidence weighting even in abstract or neutral situations (Ross et al., Citation2015).
In addition, there have been various attempts to make the BT more realisticFootnote1 and easier to understand (e.g. the Fish Task and the Social BT; Speechley et al., Citation2010; Westermann et al., Citation2012). These modified tasks retain most of the characteristics of the original BT (i.e. binary outcomes, fixed sequences) and they measure the same kinds of dependent variables (i.e., the number of information pieces requested to make a decision, subjective certainty level). However, subtle differences have also been incorporated. One such difference is whether the information is drawn with or without replacement to the original information source. Although the modification may improve its ecological validity, it may significantly alter the underlying cognitive demands of the task.
That is, when information is drawn without replacement, uncertainty regarding the source of information is consistently reduced on each draw. Conversely, uncertainty should be invariant when information is drawn with replacement because the sample size is now infinite. Similarly, the sequence of information presented in the BT is generally uniform across studies (McLean et al., Citation2018; Speechley et al., Citation2010). Presenting a single sequence repeatedly may increase practice effects which could cause participants to terminate the task earlier than anticipated. It is worth noting that McLean et al. (Citation2020) suggest that the reliability of the BT can be improved by introducing a distractor sequence, but this may not necessarily improve practice effects if participants were presented with the same set of target and distractor sequences. Such confounds undermine the validity of experimental results by mistaking the methodological artefacts as the experimental influences of interest. The subtle differences across different versions of the BT may also explain the variable results concerning the JTC bias and symptoms of delusional ideation and anxiety (for reviews, see Dudley et al., Citation2016; Ross et al., Citation2015; So & Kwok, Citation2015). Therefore, the impact of alternative bead sequences is unknown and is a variable deserving of exploration for its impact on decision-making.
Description of the Bayesian computational model
We adopt the Bayesian framework to outline the way an ideal decision-maker uses information to appraise the validity of competing hypotheses (Huq et al., Citation1988; Moutoussis et al., Citation2011). This process involves integrating new evidence into the initial belief about a hypothesis, whereby the ideal decision-maker will consider the likelihood of whether Hypothesis 1 is true compared to Hypothesis 2 before considering a new piece of evidence (for a more comprehensive explanation, see Fischhoff & Beyth-Marom, Citation1983; Phillips & Edwards, Citation1966). It is assumed that an ideal decision-maker will update their belief about competing hypotheses after receiving each new piece of information and select a course of action that best aligns with the available evidence (Fischhoff & Beyth-Marom, Citation1983). We do not claim that the Bayesian framework is the only way to formulate belief updating and understand the JTC bias. However, we consider the Bayesian model to be appropriate and robust in framework for understanding the JTC bias as the BT sequentially presents information and assesses the probability estimations of the source of the information presented on a trial-to-trial basis (Phillips & Edwards, Citation1966).
illustrates the Bayesian model created for this experiment. The model specifies that 1 to K individuals completing the task can request 1 to I beads before they make their decision about the source of beads presented. Each individual completes J number of BTs with varying sequences of beads which are either drawn with or without replacement.
Figure 1. The shaded nodes represent observable variables, and the unshaded nodes represent unobservable variables. The square nodes represent discrete variables whereas the round nodes represent continuous variables. The double-edged nodes are deterministic nodes while the single-edged nodes are stochastic variables. The right-hand side of the figure shows the evidence weighting component of the model ( and
) which includes the influences of the psychopathological trait (
) variable on evidence weighting for frequently occurring information (
) and infrequent information (
). The left-hand side of the figure shows the belief updating component of the model, for which the reported probability estimation for the correct source of beads (
) is influenced by the number of frequently occurring beads (
) and infrequent beads (
) observed, and the weights assigned to these beads types. The belief updating node (
) contributes to the evidence accumulation (
) for competing hypotheses, which then influences the decision made about the correct source of beads (
) once the decision threshold
is met.
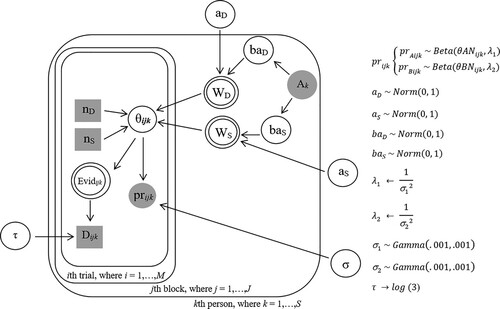
The model assumes that the number of frequently and infrequently occurring beads that the kth individual observes in the ith draw would influence their internal representation of the probability that a given bead has been drawn from Jar A or Jar B for the jth BT (i.e., in a sequence of R-R-R-O-O-R-O-R-R-R, R is the frequently occurring beads whereas O is the infrequently occurring beads). We operationalise the internal representation as a part of Bayesian belief updating (Phillips & Edwards, Citation1966).
Equations (1) and (2) show the basic Bayesian updating. Based on the Bayes’ rule, one would use the observed datum E to update their prior beliefs about the competing hypotheses that beads are drawn from Jar A or Jar B, as represented by P(HA) and P(HB) respectively. P(E|HA) and P(E|HB) represent the likelihood of observing each datum given that a particular hypothesis is true. Considering both the likelihood of observed data and prior beliefs about each hypothesis, updated beliefs are formed (also known as posterior probabilities as represented by P(HA|E) and P(HB|E)).
(1)
(1)
(2)
(2) Based on Equations (1) and (2), each datum E is evaluated equally as there are no weights assigned to datum E. We expand the basic Bayes’ rule by introducing an evidence weight component. We assume that individuals assign weights individually to the coloured bead observed in each draw. Weights assigned to frequently and infrequently occurring beads by the kth individual are represented by wDk and wSk respectively. At the population level, we assume that the population weights will not be different for any beads observed, just as conceptualised in the basic Bayes rule. Thus, the population-level weights assigned to the frequently and infrequently occurring beads, as represented by aD and aS, are assumed to be 0. However, we allow any deviations from the population weights that are influenced by one’s psychopathological symptoms, as indicated by baD and baS. The magnitude of differences in assigning evidence weights depends on the levels of psychopathological symptoms for the individual, Ak. The weighting function is exponentiated to ensure that evidence weights and the resulting probability estimations are always positive (see Equations (3) and (4)).
(3)
(3)
(4)
(4) Equation (5) shows the expansion of the basic Bayesian updating which includes the evidence weights components. In this variant of Bayes’ rule, the prior beliefs that beads are drawn from Jar A and Jar B are represented by
and
, and the likelihood of observing the coloured beads given if they are drawn from Jar A or Jar B, are represented by
and
respectively. The posterior probabilities for each competing hypothesis are represented by
and
. Thus, just as in the basic Bayesian updating, the kth individual uses the observed bead in the ith draw, either a frequently occurring bead or infrequent bead as represented by
and
, to update their prior beliefs about the source of beads. The kth individual also considers the likelihood of observing the bead given if it is drawn from Jar A or Jar B and they assign weights to the observed beads. The kth individual could hypothetically evaluate both frequently and infrequently occurring beads equally, or they may place more emphasis on frequently occurring beads and discount any observed infrequently occurring beads. We allow for flexibility in prior beliefs such that individuals’ beliefs for Jar A and B prior to the first bead follows a beta distribution with a uniform prior.
(5)
(5) It is important to note that in Equation (5), the weighting functions are only incorporated in the belief updating for a particular hypothesis, but not both hypotheses at the same time. This is because the posterior probabilities are normalised in the model such that both posterior beliefs cannot increase at the same time since a constant sum applies (see Equations (6)–(8); Phillips & Edwards, Citation1966).
(6)
(6)
(7)
(7)
(8)
(8)
Therefore, the weights assigned to the frequently and infrequently occurring beads, wDk and wSk are interpreted as weights assigned to information in favour of Jar A if the weights are incorporated in the belief updating for Jar A, and weights assigned to information in favour of Jar B if the weighting function is attached to the belief updating for Jar B. In other words, a wDk value larger than 1 means that the kth individual places heavier weights on frequently occurring beads in favour of Jar A. A wDk value smaller than 1 means that the kth individual places more emphasis on the frequently occurring beads in favour of Jar B. The same interpretation applies to wSk, which would be the weights assigned to secondary beads in favour of Jar A or B depending on the location of the weighting function.
We assume that the posterior beliefs formed after each draw contributes to the evidence accumulated for Jar A and Jar B (see Equations (9) and (10)), as conceptualised by Moutoussis et al. (Citation2011).
(9)
(9)
(10)
(10) When the evidence accumulated for either Jar exceeds a decision threshold
, the kth individual will stop sampling information and can make a decision about whether the bead(s) is/are drawn from Jar A or Jar B. The jth BT then terminates. If the evidence accumulation does not exceed the decision threshold
, then they will continue sampling more information. We set the decision threshold
as the log of Bayes Factor 3, which implies that one would have substantial evidence supporting a hypothesis (Lee & Wagenmakers, Citation2014).
(11)
(11) shows the flow of belief updating as conceptualised within the model and instantiated in the BT. The internal Bayesian belief updating can be observed in two ways: one’s reported certainty level that the beads are drawn are from Jar A and Jar B as represented by
and
, as well as a binary decision of Jar A or B. The reported certainty level of the source of beads for the kth individual is assumed to follow a beta distribution consisting of their posterior belief for the ith draw and a precision parameter.
The present study
To summarise, the goal of the present investigation was to fit our proposed Bayesian model with participants’ responses in the BT to explore how delusional ideation, general, and social anxiety influence the way individuals assign weights to information in contributing to the JTC bias. We focused on the continuums of delusional ideation, general, and social anxiety as these psychopathological traits were more prominently researched in the JTC literature due to the similar underlying hypersensitive threat system (Schlier et al., Citation2016). We also examined the effects of modifying the sequences of information and instructions about whether the information is drawn with or without replacement on participants’ subjective certainty to decisions and the number of draws to decisions. While these aims were secondary, we were interested in replicating the relationship between different psychopathological traits and the primary decisional variables in the BT.
We hypothesised that individuals with higher levels of delusional ideation will request significantly fewer beads to decide and report significantly higher subjective certainty to decisions (Ross et al., Citation2015). Although the findings of anxiety and JTC bias have been inconsistent, cognitive models of anxiety postulate that biases in interpreting information are activated in the presence of perceived threats (Beck & Clark, Citation1997; Wong & Rapee, Citation2016). Given the Classic BT lacks threat cues, we hypothesised that general and social anxiety will not have significant associations with the number of draws to decisions and subjective certainty at the point of decisions. These regression analyses will help to contribute to the pool of evidence related to JTC bias in delusional ideation and anxiety.
Transparency and openness
Preregistration
The present investigation was not preregistered on any platforms.
Data, materials, code, and online resources
Data, materials, and code will be made available upon publication via this link: https://osf.io/p7wy6/?view_only=0bb79d9a44a9438ebaec4b4179d7fbbf
Reporting
We report how we determined our sample size, all data exclusions, all manipulations, and all measures in the study.
Ethical approval
The present investigation was approved by the Australian National University Human Research Ethics Committee (Protocol number 2020/553).
Method
The present investigation consisted of an online study and one replication study that involved completing 12 BTs consisting of different sequences of information, ratios of beads, and task instructions.
Participants
We recruited 52 participants from the United States and the United Kingdom through an online crowdsourcing platform, Prolific™. This sample size is determined through a rigorous simulation study that examined the properties of the proposed Bayesian hierarchical model. The results indicated that 50 participants are sufficient for the model to reliably and accurately estimate the influence of psychopathological traits on evidence weights assigned to frequently and infrequently occurring beads.
Two participants were excluded from data analysis for failing to pass attention checks as this indicated that they may be providing unreliable data. The data analysis included 50 participants (50% females, mean age = 31.54, SD = 11.21, range = 18–63 years old, 68% Caucasian, 86% reported that their highest education was at least high school or undergraduate level, and 34% reported having a diagnosis of mental disorder(s) with depression and anxiety disorders being the most commonly reported mental illnesses).
Materials
Beads task
A computerised version of the BT was constructed using QualtricsTM. The BT instructions were similar to those from the studies by Garety et al. (Citation2011) and Huq et al. (Citation1988). The instructions only differed in whether participants were told that “After each bead is drawn, it is returned to the jar so that the number and proportions of beads remain the same” or “After each bead is drawn, it is not returned to the jar”. This manipulation allowed the exploration of whether drawing information with and without replacement affects decision-making in the BT.
shows all BT versions administered in the present study. There were 12 levels of manipulation (2 instructions × 2 sequences × 3 uncertainty levels). The beads were drawn based on a predetermined sequence unknown to participants. The sequence of beads for the 55:45 ratio was randomly generated once and was fixed for all participants, whereas the sequences of beads for the 70:30 and 90:10 ratios were from Bensi and Giusberti (Citation2007) as well as Moritz and Woodward (Citation2005) respectively. The sequences are listed below:
Green: 45 Purple
G-P-P-G-P-G-P-G-G-P-P-G-G-G-P-P-G-G-P-P
Green: 30 Yellow
G-G-Y-G-G-Y-G-G-Y-G-G-G-Y-G-G-Y-G-G-Y-G
Pink: 10 Brown
P-P-P-P-B-P-P-P-P-P-B-P-P-P-P-B-P-P-P-P
Figure 2. The 55:45 ratio of beads represents the highest uncertainty level in the BT, followed by 70:30, and 90:10 ratio of beads implies the lowest uncertainty level in the BT. The presentation of 12 BTs was randomised for each participant.
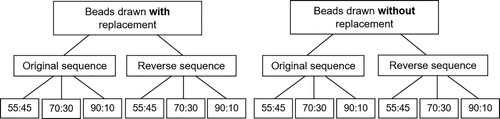
To explore the effect of using different sequences, we reversed the above sequences to create another set of sequence. After each bead was drawn and presented on the participants’ computer screen, participants could either terminate the trial when they had decided on the source of beads, or request to see more beads. Participants also reported their certainty level that the bead(s) drawn so far was/were from Jar A or Jar B using a constant sum rating scale. The total certainty levels reported for both Jar A and Jar B were restricted to 100. Participants would be automatically directed to decide if they requested to see more beads after the 20th draw and the trial would be terminated. All beads that had been drawn remained on the screen as a memory aid. The “correct” decision of each task was pseudo-randomised.
Psychopathology measures
We included eight measures that assess variables that have been postulated to be correlated with the JTC bias across various studies in the literature, including delusional ideation, psychotic-like experiences, depression, general and social anxiety, stress, impulsiveness, and impression management (Curley et al., Citation1986; Garety et al., Citation2011; Schlier et al., Citation2016). The focus of the report is on the prominently researched variables including delusional ideation, general, and social anxiety. Results concerning other measured trait variables can be found in Online Appendix E.
21-Item Peters Delusion Inventory (PDI-21)
The PDI-21 consists of 21 yes-no items measuring delusional ideation. Individuals who endorse the delusion-like beliefs also rate the degrees of conviction, distress, and preoccupation associated with the endorsed beliefs on a 5-Point Likert scale (Peters et al., Citation2004). Examples of the yes-no items include “Do you ever feel as if you could read other people’s minds?” and “Do you ever think people can communicate telepathically?”. The McDonald’s Ω for the PDI-21 in this sample was .86, estimated using “psych” package version 2.3.6 (Revelle, Citation2023). The Bayesian and regression analyses utilised the total scores of all items including the dimensional items to capture a more holistic perspective between delusional ideation and the mechanism of JTC bias.
Social Interaction Anxiety Scale and Social Phobia Scale (SIAS-6 & SPS-6)
The SIAS-6 and SPS-6 are a set of companion scales consisting of 12 items that measure the anxiety associated with social interaction and fear of scrutiny respectively (Peters et al., Citation2012). The items are rated on a 5-point Likert scale ranging from 0 (“Not at all characteristic or true of me”) to 4 (“Extremely characteristic or true of me”). Examples of items include “I feel tense if I meet an acquaintance on the street” and “I worry about shaking or trembling when I’m watched by other people”. The McDonald’s Ω for the combined SIAS-6 and SPS-6 was .94.
Depression, Anxiety, and Stress Scale (Anxiety Subscale; DASS-A)
The DASS-21 Anxiety Subscale (DASS-A) consists of seven items measuring anxiety experienced over the past week, with a greater focus on the somatic symptomology of anxiety (Lovibond & Lovibond, Citation1995). The items are rated on a 4-point Likert scale ranging from 0 (“Never”) to 3 (“Almost always”). Examples of items include “I was aware of dryness of my mouth” and “I experienced trembling (e.g. in the hands)”. The McDonald’s Ω for the DASS-A was .92.
Procedure
The study was distributed on ProlificTM. Participants gave informed consent to participate and completed a demographic questionnaire including age, gender, ethnicity, education, English proficiency, and mental health history. Next, the participants completed all 12 BT variants (sequence 1 – draw with replacement (WR); sequence 2 – draw with replacement (RWR); sequence 1 – draw without replacement (WO); sequence 2 – draw without replacement (RWO)), with varying ratios of beads. Finally, the participants completed eight psychopathology measures. All participants were debriefed at the end of the study and were provided with links to mental health resources. Participants were compensated with £3.68.
Statistical analysis
Bayesian computational modelling was employed to illustrate how psychopathological traits such as delusional ideation and anxiety influence assignments of evidence weights in the BT. We also planned to explore any effects of manipulating the characteristics of BT on primary decisional variables, including the number of draws and subjective certainty to decisions using mixed-effects Poisson regression and mixed-effects beta regression respectively. The mixed-effects approach helps to ensure that the analysed effects were not influenced by the dependence of errors (Magezi, Citation2015). All analyses were conducted on the R version 4.1 using packages “lme4” (Bates et al., Citation2015) and “glmmTMB” (Brooks et al., Citation2017). Contrasts between the variations of the BT were conducted using the “emmeans” package.
Results
Data cleaning and analysis
No multivariate outliers were detected in this sample using participants’ responses to the full set of eight psychopathological measures. shows the descriptive statistics of the psychopathology and primary decisional variables. The means of SIAS-6 and SPS-6, as well as the DASS-A scores in this sample are higher than the normative average (Carleton et al., Citation2014; Crawford et al., Citation2009).
Table 1. Descriptive statistics of psychopathological and decisional variables.
Beads task conditions and number of draws to decisions
Given our small sample size, a sensitivity test was conducted to identify potential influential cases in the mixed-effects models using the “influence.me” package (Nieuwenhuis et al., Citation2012). No potential influential cases that could change the significance of models were detected (dfbetas cutoff > .28, where the cutoff point is 2/√n). No overdispersion in the mixed models was detected.
Based on paired comparisons with a p-value adjustment using false discovery rate, the results show that the number of draws to decisionsFootnote2 was statistically similar across all BT variants regardless of the sequences presented and the way information was drawn (see ). When paired comparisons were conducted separately for the different ratios of beads, the number of draws to decisions in RWO condition was significantly fewer than in WO condition for 55:45 ratio, ratio = .80, p = .039 (see Online Appendix A). No other significant differences were observed.
Table 2. Paired comparisons of decisional variables between BTs variations.
Beads task conditions and subjective certainty at the point of decisions
Paired comparisons of the mixed-effects beta regression models with a p-value adjustment using false discovery rate were performed. Results indicate that the subjective certainty at the point of decisions in the RWR condition was significantly lower compared to WR, WO, and RWO conditions (refer ). This pattern of differences was observed across most ratios of beads (see Online Appendix A).
Evidence weights assigned to frequently occurring and infrequent beads
Variables observed in the BT were used to fit the proposed Bayesian computational model, including the trial-to-trial subjective certainty of the source of beads drawn, number of draws to decisions, ratios of beads, psychopathological trait scores, beads sequences, and participants’ final decision about the source of beads. The psychopathological trait scores were standardised, such that a standard deviation of increase in the psychopathological trait is associated with a standard deviation of change in the assignment evidence weights. The decision threshold was fixed for all individuals, at the log of Bayes factor 3 which indicates that one has sufficient evidence supporting a hypothesis at the point of decision (Lee & Wagenmakers, Citation2014). An examination of threshold sensitivity was also conducted by manipulating the decision threshold to be either making a decision based on no evidence or very strong evidence supporting a hypothesis (see Online Appendix C). This step was to ensure that the model estimations were not influenced by the decision threshold set for the model. The model was run using 10,000 iterations with four chains consisting of different initial values. The model was also run separately for different psychopathological traits and the model converged for all runs (value was less than 1.1; Su & Yajima, Citation2021).
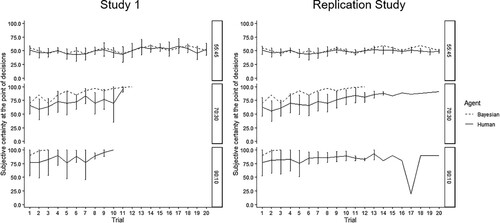
The results show that, without considering the influences of psychopathological traits (i.e., null model), participants placed significantly greater weights on the frequently occurring beads in favour of the incorrect jar (jar with a lower ratio of frequently occurring beads) compared to the correct jar (estimate = −.53, 95%CI[−.56, −.51]). Participants also assigned significantly greater weights on infrequently occurring beads in favour of the correct jar (jar with a lower ratio of infrequent beads) compared to the incorrect jar (estimate = .60, 95%CI[.57, .62]). This reflects conservative belief updating compared to an ideal Bayesian agent because infrequent information was given greater weights to revise the belief about the correct source of information presented. Interestingly, participants updated their belief at a similar rate as an ideal Bayesian agent when the uncertainty level was the highest, i.e., 55:45 ratio, and deviated the most from the ideal Belief updating when the uncertainty level was the lowest at 90:10 ratio (see ).
Figure 3. The lines were set to terminate once the agent(s) reached a subjective certainty about the source of beads drawn of 99.9% which indicated “absolute certainty”. In most cases, the ideal Bayesian agent would terminate the BT earlier than a human agent.
The more complex models that include delusional ideation, general anxiety, and social anxiety as an additional parameter had lower Deviance Information Criterion values compared to the simpler model without a psychopathological trait included, indicating that the more complex models had a better model fit, ΔDICPDI = −39.5, ΔDICsSIAS-6&SPS-6 = −.3, ΔDICSIAS = −2.7, ΔDICSPS = −13.5, and ΔDICDASS-A = −28.8.
No significant association between social anxiety and evidence weights was observed (see and ). However, higher delusional ideation significantly exacerbated the greater weights assigned to infrequent information to update the belief about the correct source of information. This indicates that higher delusional ideation promoted conservative belief updating about the correct source of information presented (see ). On the contrary, higher general anxiety was associated with significantly greater weights assigned to frequently occurring beads in favour of the correct jar, thereby reducing the conservatism in belief updating. All results remained similar even when decision thresholds were changed and across all BT variations (see Online Appendix C).
Figure 4. The subjective certainty at the point of decisions was simulated using the Bayesian estimations reported in and Equation (5). The lines were set to terminate when the simulated subjective certainty reached 99.9% indicating absolute certainty about the source of information drawn. The figure shows overlapping lines of subjective certainty across all trials when the level social anxiety was at the mean (0 standard deviation), 3 standard deviations above the mean, and 3 standard deviations below the mean. This means that social anxiety levels did not significantly influence belief updating. Higher general anxiety (purple line) increased belief updating about the correct source of information drawn consistently across all ratios of beads. However, this increase is less observable when the uncertainty level is low (i.e., 90:10 ratio).
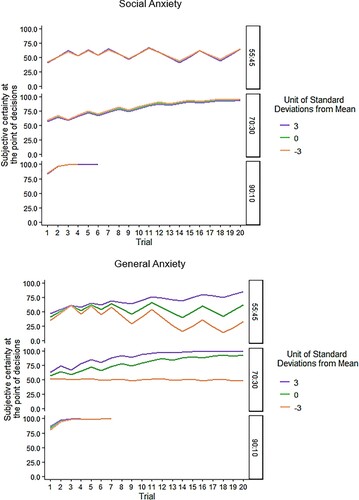
Figure 5. It appears that higher delusional ideation (purple line) only attenuated belief updating in the 70:30 and 90:10 ratios (especially for the first three beads observed) and exhibited an opposite effect under high uncertainty levels in the environment (i.e., 55:45 ratio). This suggests that higher delusional ideation may be associated with the JTC bias about the correct source of information when the uncertainty level is high.
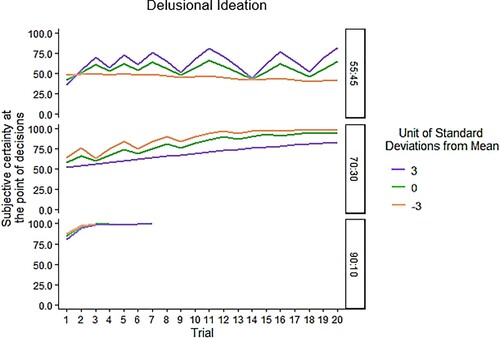
Table 3. Model estimations of the differences in assigning evidence weights across psychopathological traits (Study 1).
Associations between psychopathological traits and decisional variables in the BT
We used mixed-effects Poisson and beta regressions to test our hypotheses that there will be a (a) significant and negative association between delusional ideation and number of draws to decisions; (b) significant and positive association between delusional ideation and subjective certainty at the point of decisions; and (c) no significant association between social anxiety and number of draws to decisions or subjective certainty at the point of decisions. The p-values were adjusted using false discovery rates for multiple hypotheses testing.
The results show no significant associations were found between the trait variables and primary decisional variables. The hypothesised significant association between delusional ideation and number of draws to decisions (b = .10, p = .496), and subjective certainty at the point of decisions (b = −.00, p = .997) were not supported. However, the hypothesised non-significant association between social anxiety and the number of draws to decisions (b = .26, p = .053), and subjective certainty at the point of decisions (b = .06, p = .496) were supported. Additional Bayesian analyses shown in Online Appendix D were consistent with the frequentist hypothesis testing, supporting no significant associations between the psychopathological and BT decisional variables.
Replication study
We conducted a replication study by recruiting another 53 participants based in the United States or the United Kingdom to complete the same study on ProlificTM to ensure the reliability of findings reported in Study 1. Two participants failed attention checks and were excluded from data analysis. One participant was also missing responses across the three trait measures due to technical errors on QualtricsTM, but they were included in data analyses as these missing trait measures are not reported as part of this investigation. Overall, our analysis consisted of 51 participants (45% females, 70% Caucasians, mean age = 33.51, SD = 11.62, range = 19–70 years old, 78% reported that their highest education was at least at high school or undergraduate level, and 27.5% reported having a diagnosis of mental disorder(s) with mainly depression and anxiety disorders).
We also conducted t-test and chi-square test to examine differences in age, gender, and psychopathological traits between the samples from Study 1 and the replication study. These samples did not differ significantly in age (mean difference = −1.97, 95%CI[−6.48, 2.53], t(98.98) = −.87, p = .388) or gender (χ2(1) = .00, p = 1). The two samples did not differ significantly in their levels of social anxiety (mean difference = −4.18, 95%CI[−.15, 8.52], t(97.36) = 1.92, p = .058), but differed significantly on the levels of delusional ideation (mean difference = 20.43, 95%CI[6.11, 34.74], t(77.42) = 2.84, p = .006) and general anxiety (mean difference = 2.45, 95%CI[.76, 4.14], t(87.04) = 2.88, p = .005). Overall, the replication sample has lower scores on the PDI, SIAS-6 & SPS-6, and DASS-A compared to Study 1.
Results
No multivariate outliers were detected using the full set of psychopathological measures. The descriptive statistics of the psychopathological measures and observed decisional variables in the BTs can be found in Online Appendix B. Three cases were detected as potential influential cases (dfbetas ≥ .28), but were retained in the analyses as they did not alter the significance of the model. The same analyses reported in Study 1 were employed.
Overall, the results from Study 1 were generally replicated. The BT variations did not significantly affect the number of draws to decisions (see Online Appendices A and B). The subjective certainty at the point of decisions was significantly lower in the RWR condition compared to RWO and WR conditions, thus suggesting similar observations as Study 1, but this pattern of result was only observed in the 90:10 ratio (see Online Appendix B). This sample also failed to reveal significant associations between delusional ideation and number of draws to decisions (b = .18, p = .320), and subjective certainty at the point of decisions (b = .00, p = .987). There were also no significant associations between social anxiety and number of draws to decisions (b = .13, p = .335) as well as subjective certainty at the point of decisions (b = .09, p = .335). Thus, the regression results in Study 1 were replicated.
We used the Bayesian estimations reported in Study 1 as priors to estimate the evidence weighting for the replication sample. In this sample, participants generally placed significantly greater weights on frequently occurring beads in favour of the incorrect jar (estimate = −.62, 95%CI[−.64, −.60]) and also significantly greater weights on infrequent beads in favour of the correct jar (estimate = .69, 95%CI[.67, .72]). The general conservatism in belief updating was replicated.
The more complex models that include delusional ideation and general anxiety as an additional parameter had lower Deviance Information Criterion values compared to the simpler model without a psychopathological trait included, indicating that the more complex models had a better model fit, ΔDICPDI = −5104.0, ΔDICSIAS-6&SPS-6 = −28.5, ΔDICSIAS = −5083.4, ΔDICSPS = −5076.9, and ΔDICDASS-A = −1044.1.
Higher delusional ideation exacerbated the greater evidence weights to infrequent information to update the belief about the correct source of information (see ). However, in this sample, higher social anxiety was associated with greater weights assigned on frequently occurring beads to update the beliefs about the correct sources of beads drawn, thereby reducing conservatism in belief updating. General anxiety exhibited inconsistent influences on evidence weights compared to Study 1, whereby general anxiety did not have any significant influences on evidence weighting in this replication sample.
Table 4. Model estimations of the differences in assigning evidence weights across psychopathological traits (replication study).
The results were similar across different decision thresholds and ratios of beads (see Online Appendix C). Furthermore, the pattern of deviations from ideal Bayesian updating across ratios of beads was replicated (see ).
Discussion
A main finding of this investigation is the illustration of how participants weighted information presented in the BT. The Bayesian estimations across two study samples indicate that individuals exhibited conservatism and an overall tendency to seek reassurance when making decisions, consistent with the early studies of the BT (Huq et al., Citation1988; Phillips & Edwards, Citation1966). The present investigation found that individuals allocated significantly greater weights to infrequent information to update their beliefs about the correct source of information, leading to an attenuated belief updating compared to an ideal Bayesian agent. Such a pattern of belief updating suggests that human participants are vulnerable to the salience effects. This effect occurs when new or odd information has a greater impact on decision making (Kahneman, Citation2011; Taylor & Thompson, Citation1982). Additionally, the results showed that the salience effect was stronger under a low uncertainty level (i.e., 90:10 ratio) than a high uncertainty level (i.e., 55:45 ratio).
The present investigation also provided an extended perspective on why humans deviate from the ideal Bayesian updating via the influences of psychopathological traits on evidence weighting. The findings suggest that the salience effect is stronger with higher delusional ideation (Pankow et al., Citation2016). There was a stronger tendency to weight frequent information in favour of the less probable outcome as delusion ideation increases, which provides further empirical support that that individuals with higher delusional ideation may be more ready to accept implausible events due to differences in how information is used to update beliefs (Moritz & Woodward, Citation2004; Zawadzki et al., Citation2012). Given the stronger salience effect and tendency to favour the less probable outcomes, it is possible that altered evidence weighting may contribute to JTC bias about a less probable outcome with higher delusional ideation. Further studies are warranted to investigate this speculation in clinical populations, as the model estimations indicate that one may need to experience a level of delusional ideation that is at least 8 standard deviations above the mean.
Likewise, the results also did not reveal a significant association between delusional ideation and the number of draws to decisions and subjective certainty at the point of decisions. Given the present samples consisted of participants who were not pre-screened for any mental health diagnosis, it is unsurprising to observe the null findings. Previous studies suggested that hasty responding may only occur in individuals with clinical delusions (Dudley et al., Citation2016; van Dael et al., Citation2006). Furthermore, the meta-analysis by Ross et al. (Citation2015) suggested an effect size of r = −.10 between delusion ideation and JTC bias, for which our current studies do not provide enough power to detect this effect size. Therefore, future studies are warranted to further replicate the current findings using a bigger sample size, ideally with individuals experiencing clinically elevated symptoms.
Unexpectedly, there were inconsistent influences from general and social anxiety on evidence weighting across both samples. Higher general and social anxiety either had no significant influences on evidence weighting or reduced the general conservatism in belief updating by promoting a greater emphasis on frequent information. These inconsistencies are likely to be due to the differences in general and social anxiety levels observed across the two samples and the relatively small sample sizes. Based on the present studies, we could not draw a conclusion on the impact of social and general anxiety on evidence weighting.
However, given the Classic BT lacks threat-related cues specific to social or general anxiety such as social feedback or negative life outcomes (Beck & Clark, Citation1997; Wong & Rapee, Citation2016), higher general and social anxiety may slightly increase belief updating in abstract situations due to a higher drive to avoid making the “wrong” decisions. For example, an encephalogram study showed that individuals with high social anxiety exhibited greater brain activity when making errors in both non-social and social situations than individuals with low social anxiety (Barker et al., Citation2015). This speculation remains to be tested with a larger sample size that provides higher power to detect small effect sizes. Regardless of the inconsistencies of influences, the magnitude of significant influences within each sample appears insufficient to outweigh the general conservatism to the extent that general or social anxiety symptoms could contribute to JTC bias. Based on the model estimations, one needs to have an anxiety symptom level that is at least 20 standard deviations above the mean to exhibit the JTC bias through altered evidence weighting (refer to Equation (5)). This highlights the unlikelihood that altered evidence weighting due to social anxiety can result in hasty decision-making in an abstract task. Supporting this, no significant associations existed between social anxiety and the primary decisional variables measured in the Classic BT.
The present investigation also provided new insights into some of the impacts of varying key BT characteristics on decisional aspects. Firstly, using different sequences or data sampling methods did not affect the number of draws to decisions. This suggests that these characteristics do not influence the decision values associated with beads presented to the extent that they influence the action of requesting information. Given the number of draws was not significantly affected by the method of sampling information in the BT, this supports the validity of JTC bias observed in previous studies that used BT variants that did not provide the instruction that information was drawn with replacement back the original source of information.
However, these BT variations significantly affected the subjective certainty reported at the point of decisions. Participants reported significantly lower subjective certainty when the sequence of beads was reversed and when beads were drawn with replacement compared to when the original beads sequence was used and drawn without replacement. In the reverse sequence, participants would observe more conflicting information within the first two draws (especially for the 55:45 and 70:30 ratios of beads). Moreover, when information was drawn with replacement, the uncertainty regarding the source of replacement did not diminish after each draw since the sample size available is infinite in this condition. The decision thresholds may be lowered to make decisions under these conditions, given the number of draws to decisions was unaffected by the manipulation of sequences and data sampling method.
Overall, the present findings indicate potential solutions to the criticisms that the BT lacks replicability and reliability, given it is often administered once or with the same sequence repeated several times (McLean et al., Citation2018). The current findings imply that the researchers should consider administering the BT repeatedly by presenting different beads sequences. However, this is only feasible if researchers are interested in the dichotomous categorisation of JTC groups or the number of draws to decisions. Presenting different sequences of beads may have little bearing if the research focuses on individuals’ final subjective certainty level at the point of decisions. That being said, comprehensive manipulations of sequences are warranted to ensure that the variations of sequences will not affect the number of draws to decisions.
In conclusion, the present study demonstrated that individuals exhibited reduced belief updating in the BT compared to an ideal Bayesian agent due to differences in evidence weighting. Higher delusional ideation appeared to exacerbate the attenuation in belief updating about the correct source of information. Although there were inconsistent influences of general and social anxiety on the assignment of evidence weights in the BT, taken together, these influences were considered insufficient to contribute to extreme increases in belief updating leading to JTC bias. The present study further found that delusion ideational and social anxiety were not significantly associated primary decisional variables in the BT. The current findings are inconsistent with most previous individual studies, possibly due to the low power in the current sample size to detect the small effect sizes. The current findings also indicated that changing sequences and information sampling method did not significantly influence the number of draws to decisions but significantly affected on one’s subjective certainty at the point of decisions. This highlights a potential of administering BT as a repeated measure if researchers measure the JTC bias using the number of draws to decisions in the BT. More research is warranted to further generalise the current results to clinical populations.
Authors contributions
Conceptualisation: N Tan, Y Shou, J Chen, B K Christensen; Methodology: N Tan, Y Shou, B K Christensen, J Chen; Software: N Tan, Y Shou; Formal Analysis: N Tan, Y Shou; Investigation: N Tan, Writing – Original Draft: N Tan; Writing – Review & Editing: N Tan, Y Shou, J Chen, B K Christensen; Visualisation: N Tan, Supervision: Y Shou, B K Christensen, J Chen.
appendices.docx
Download MS Word (63.4 KB)Disclosure statement
No potential conflict of interest was reported by the author(s).
Notes
1 There is also a version of the BT, known as the Box Task, that was developed to improve the task comprehensibility (Balzan et al., Citation2017). However, it is beyond the scope of this study to discuss the Box Task, as this task may be tapping into different cognitive processes compared to the BT (Balzan et al., Citation2017).
2 We also found no significant differences in the number of individuals who exhibited JTC bias (i.e. drawing two or fewer pieces of beads) across the BT variations using mixed-effects binomial regression with false discovery rate adjustment applied (see Online Appendix A).
References
- Ashinoff, B. K., Singletary, N. M., Baker, S. C., & Horga, G. (2022). Rethinking delusions: A selective review of delusion research through a computational lens. Schizophrenia Research, 245, 23–41. https://doi.org/10.1016/j.schres.2021.01.023
- Aylward, J., Valton, V., Ahn, W.-Y., Bond, R. L., Dayan, P., Roiser, J. P., & Robinson, O. J. (2019). Altered learning under uncertainty in unmedicated mood and anxiety disorders. Nature Human Behaviour, 3(10), 1116–1123. https://doi.org/10.1038/s41562-019-0628-0
- Balzan, R. P., Ephraums, R., Delfabbro, P., & Andreou, C. (2017). Beads task vs. box task: The specificity of the jumping to conclusions bias. Journal of Behavior Therapy and Experimental Psychiatry, 56, 42–50. https://doi.org/10.1016/j.jbtep.2016.07.017
- Barker, T. V., Troller-Renfree, S., Pine, D. S., & Fox, N. A. (2015). Individual differences in social anxiety affect the salience of errors in social contexts. Cognitive, Affective, & Behavioral Neuroscience, 15(4), 723–735. https://doi.org/10.3758/s13415-015-0360-9
- Bates, D., Mächler, M., Bolker, B., & Walker, S. (2015). Fitting linear mixed-effects models using lme4. Journal of Statistical Software, 67(1), 1–48. https://doi.org/10.18637/jss.v067.i01
- Beck, A. T., & Clark, D. A. (1997). An information processing model of anxiety: Automatic and strategic processes. Behaviour Research and Therapy, 35(1), 49–58. https://doi.org/10.1016/S0005-7967(96)00069-1
- Bensi, L., & Giusberti, F. (2007). Trait anxiety and reasoning under uncertainty. Personality and Individual Differences, 43(4), 827–838. https://doi.org/10.1016/j.paid.2007.02.007
- Brooks, M. E., Kristensen, K., van Benthem, K. J., Magnusson, A., Berg, C. W., Nielsen, A., Skaug, H. J., Mächler, M., & Bolker, B. M. (2017). glmmTMB balances speed and flexibility among packages for zero-inflated generalized linear mixed modeling. The R Journal, 9(2), 378–400. https://doi.org/10.32614/RJ-2017-066
- Carleton, R. N., Thibodeau, M. A., Weeks, J. W., Teale Sapach, M. J. N., McEvoy, P. M., Horswill, S. C., & Heimberg, R. G. (2014). Comparing short forms of the Social Interaction Anxiety Scale and the Social Phobia Scale. Psychological Assessment, 26(4), 1116–1126. https://doi.org/10.1037/a0037063
- Crawford, J. R., Garthwaite, P. H., Lawrie, C. J., Henry, J. D., MacDonald, M. A., Sutherland, J., & Sinha, P. (2009). A convenient method of obtaining percentile norms and accompanying interval estimates for self-report mood scales (DASS, DASS-21, HADS, PANAS, and sAD). The British Journal of Clinical Psychology, 48(Pt 2), 163–180. https://doi.org/10.1348/014466508X377757
- Curley, S. P., Yates, J. F., & Abrams, R. A. (1986). Psychological sources of ambiguity avoidance. Organizational Behavior and Human Decision Processes, 38(2), 230–256. https://doi.org/10.1016/0749-5978(86)90018-X
- Dudley, R., Taylor, P., Wickham, S., & Hutton, P. (2016). Psychosis, delusions and the ‘jumping to conclusions’ reasoning bias: A systematic review and meta-analysis. Schizophrenia Bulletin, 42(3), 652–665. https://doi.org/10.1093/schbul/sbv150
- Dudley, R. E. J., & Over, D. E. (2003). People with delusions jump to conclusions: A theoretical account of research findings on the reasoning of people with delusions. Clinical Psychology & Psychotherapy, 10(5), 263–274. https://doi.org/10.1002/cpp.376
- Fischhoff, B., & Beyth-Marom, R. (1983). Hypothesis evaluation from a Bayesian perspective. Psychological Review, 90(3), 239–260. https://doi.org/10.1037/0033-295X.90.3.239
- Freeman, D. (2007). Suspicious minds: The psychology of persecutory delusions. Clinical Psychology Review, 27(4), 425–457. https://doi.org/10.1016/j.cpr.2006.10.004
- Garety, P., Freeman, D., Jolley, S., Ross, K., Waller, H., & Dunn, G. (2011). Jumping to conclusions: The psychology of delusional reasoning. Advances in Psychiatric Treatment, 17(5), 332–339. https://doi.org/10.1192/apt.bp.109.007104
- Huq, S. F., Garety, P. A., & Hemsley, D. R. (1988). Probabilistic judgements in deluded and non-deluded subjects. The Quarterly Journal of Experimental Psychology Section A, 40(4), 801–812. https://doi.org/10.1080/14640748808402300
- Johnstone, K. M., Chen, J., & Balzan, R. P. (2017). An investigation into the jumping-to-conclusions bias in social anxiety. Consciousness and Cognition, 48, 55–65. https://doi.org/10.1016/j.concog.2016.10.012
- Kahneman, D. (2011). Thinking, fast and slow (p. 499). Farrar, Straus and Giroux.
- Koban, L., Schneider, R., Ashar, Y. K., Andrews-Hanna, J. R., Landy, L., Moscovitch, D. A., Wager, T. D., & Arch, J. J. (2017). Social anxiety is characterized by biased learning about performance and the self. Emotion, 17(8), 1144–1155. https://doi.org/10.1037/emo0000296
- Lee, M. D., & Wagenmakers, E.-J. (2014). Bayesian cognitive modeling: A practical course. Cambridge University Press.
- Lovibond, P. F., & Lovibond, S. H. (1995). The structure of negative emotional states: Comparison of the Depression Anxiety Stress Scales (DASS) with the Beck Depression and Anxiety Inventories. Behaviour Research and Therapy, 33(3), 335–343. https://doi.org/10.1016/0005-7967(94)00075-U
- Magezi, D. A. (2015). Linear mixed-effects models for within-participant psychology experiments: An introductory tutorial and free, graphical user interface (LMMgui). Frontiers in Psychology, 6. https://doi.org/10.3389/fpsyg.2015.00002
- McLean, B. F., Mattiske, J. K., & Balzan, R. P. (2018). Towards a reliable repeated-measures beads task for assessing the jumping to conclusions bias. Psychiatry Research, 265, 200–207. https://doi.org/10.1016/j.psychres.2018.04.043
- McLean, B. F., Mattiske, J. K., & Balzan, R. P. (2020). Jumping to conclusions in the less-delusion-prone? Preliminary evidence from a more reliable beads task. Journal of Behavior Therapy and Experimental Psychiatry, 68, 101562. https://doi.org/10.1016/j.jbtep.2020.101562
- Moritz, S., & Woodward, T. S. (2004). Plausibility judgement in schizophrenic patients: Evidence for a liberal acceptance bias. German Journal of Psychiatry, 7(4), 66–74.
- Moritz, S., & Woodward, T. S. (2005). Jumping to conclusions in delusional and non-delusional schizophrenic patients. The British Journal of Clinical Psychology, 44(Pt 2), 193–207. https://doi.org/10.1348/014466505X35678
- Moutoussis, M., Bentall, R. P., El-Deredy, W., & Dayan, P. (2011). Bayesian modelling of jumping-to-conclusions bias in delusional patients. Cognitive Neuropsychiatry, 16(5), 422–447. https://doi.org/10.1080/13546805.2010.548678
- Nieuwenhuis, R., Grotenhuis, M. t., & Pelzer, B. (2012). influence.ME: Tools for detecting influential data in mixed effects models. The R Journal, 4(2), 38–47. https://doi.org/10.32614/RJ-2012-011
- Pankow, A., Katthagen, T., Diner, S., Deserno, L., Boehme, R., Kathmann, N., Gleich, T., Gaebler, M., Walter, H., Heinz, A., & Schlagenhauf, F. (2016). Aberrant salience is related to dysfunctional self-referential processing in psychosis. Schizophrenia Bulletin, 42(1), 67–76. https://doi.org/10.1093/schbul/sbv098
- Peters, E., Joseph, S., Day, S., & Garety, P. (2004). Measuring delusional ideation: The 21-item Peters et al. Delusions Inventory (PDI). Schizophrenia Bulletin, 30(4), 1005–1022. https://doi.org/10.1093/oxfordjournals.schbul.a007116
- Peters, L., Sunderland, M., Andrews, G., Rapee, R. M., & Mattick, R. P. (2012). Development of a short form Social Interaction Anxiety (SIAS) and Social Phobia Scale (SPS) using nonparametric item response theory: The SIAS-6 and the SPS-6. Psychological Assessment, 24(1), 66–76. https://doi.org/10.1037/a0024544
- Phillips, L. D., & Edwards, W. (1966). Conservatism in a simple probability inference task. Journal of Experimental Psychology, 72(3), 346–354. https://doi.org/10.1037/h0023653
- Revelle, W. (2023). psych: Procedures for psychological, psychometric, and personality research. R package version 2.3.6.
- Ross, R. M., McKay, R., Coltheart, M., & Langdon, R. (2015). Jumping to conclusions about the Beads Task? A meta-analysis of delusional ideation and data-gathering. Schizophrenia Bulletin, 41(5), 1183–1191. https://doi.org/10.1093/schbul/sbu187
- Rubio, J. L., Ruiz-Veguilla, M., Hernández, L., Barrigón, M. L., Salcedo, M. D., Moreno, J. M., Gómez, E., Moritz, S., & Ferrín, M. (2011). Jumping to conclusions in psychosis: A faulty appraisal. Schizophrenia Research, 133(1), 199–204. https://doi.org/10.1016/j.schres.2011.08.008
- Schlier, B., Helbig-Lang, S., & Lincoln, T. M. (2016). Anxious but thoroughly informed? No jumping-to-conclusions bias in social anxiety disorder. Cognitive Therapy and Research, 40(1), 46–56. https://doi.org/10.1007/s10608-015-9724-2
- So, S. H., & Kwok, N. T. (2015). Jumping to conclusions style along the continuum of delusions: Delusion-prone individuals are not hastier in decision making than healthy individuals. PLoS One, 10(3), e0121347. https://doi.org/10.1371/journal.pone.0121347
- Speechley, W. J., Ngan, E. T.-C., Moritz, S., & Woodward, T. S. (2012). Impaired evidence integration and delusions in Schizophrenia. Journal of Experimental Psychopathology, 3(4), 688–701. https://doi.org/10.5127/jep.018411
- Speechley, W. J., Whitman, J. C., & Woodward, T. S. (2010). The contribution of hypersalience to the ‘jumping to conclusions’ bias associated with delusions in schizophrenia. Journal of Psychiatry & Neuroscience: JPN, 35(1), 7–17. https://doi.org/10.1503/jpn.090025
- Su, Y.-S., & Yajima, M. (2021). R2jags: Using R to run ‘JAGS’ (0.7-1) [Computer software]. https://cran.r-project.org/web/packages/R2jags/index.html.
- Taylor, S. E., & Thompson, S. C. (1982). Stalking the elusive ‘vividness’ effect. Psychological Review, 89, 155–181. https://doi.org/10.1037/0033-295X.89.2.155
- van Dael, F., Versmissen, D., Janssen, I., Myin-Germeys, I., van Os, J., & Krabbendam, L. (2006). Data gathering: Biased in psychosis? Schizophrenia Bulletin, 32(2), 341. https://doi.org/10.1093/schbul/sbj021
- van der Leer, L., Hartig, B., Goldmanis, M., & McKay, R. (2015). Delusion proneness and ‘jumping to conclusions’: Relative and absolute effects. Psychological Medicine, 45(6), 1253–1262. https://doi.org/10.1017/S0033291714002359
- Westermann, S., Salzmann, S., Fuchs, X., & Lincoln, T. M. (2012). Introducing a Social Beads Task. Journal of Experimental Psychopathology, 3(4), 594–611. https://doi.org/10.5127/jep.017111
- Wong, Q. J. J., & Rapee, R. M. (2016). The aetiology and maintenance of social anxiety disorder: A synthesis of complimentary theoretical models and formulation of a new integrated model. Journal of Affective Disorders, 203, 84–100. https://doi.org/10.1016/j.jad.2016.05.069
- Zawadzki, J. A., Woodward, T. S., Sokolowski, H. M., Boon, H. S., Wong, A. H. C., & Menon, M. (2012). Cognitive factors associated with subclinical delusional ideation in the general population. Psychiatry Research, 197(3), 345–349. https://doi.org/10.1016/j.psychres.2012.01.004