
ABSTRACT
Trypophobia is a relatively common aversion to clusters of holes. There is no consensus yet on which emotions are involved in Trypophobia nor in its functional utility. This report investigates the role of disgust using contamination tasks in two studies, which contrast people with an aversion to trypophobic stimuli to those without. In Study 1, participants reported their emotional reactions to imagined contamination of trypophobic images. In Study 2, participants evaluated physically present trypophobic, disgust, fear, and control stimuli. The capacity of these stimuli to contaminate other objects was established using a chain of contagion task. Across both studies, contamination was present, however, only those with an aversion to trypophobic stimuli evidenced contamination on the chain of contagion task, a hallmark of disgust responding. Elevated levels were not only reported for disgust, but also alongside fear/anxiety. Participant reports suggest an underlying disease avoidance mechanism in Trypophobia, with trypophobic participants demonstrating an exaggerated response to such stimuli involving disgust and fear/anxiety, which is also seen in small animal phobia, BII, and C-OCD. Implications, particularly for treatment are discussed.
Introduction
Trypophobia is a fairly common aversion to clusters of holes, with around 10–18% of the population reportedly affected (Cole, Citation2024). This aversion is often documented as a response to images of natural objects such as lotus seed pods or honeycomb but can also be induced by human-made objects such as sponges or crumpets. It is called a “phobia” as people with Trypophobia report intense emotional reactions and physical symptoms such as nausea, pounding heart and butterflies in the stomach, suggestive of fear (Le et al., Citation2015). Trypophobic participants often report clinical levels of impairment, with some meeting the criteria for specific phobia (Vlok-Barnard & Stein, Citation2017). However, there is no agreed definition for Trypophobia, and it is not recognised as a mental disorder in the Diagnostic and Statistical Manual of Mental Disorders, 5th edition ([DSM-5]; American Psychiatric Association (APA), Citation2013). Currently, there is no consensus on the emotions induced by trypophobic stimuli. Some researchers suggest the aversion is best characterised as a fear response (Cole & Wilkins, Citation2013), while others report the involvement of disgust (Ayzenberg et al., Citation2018; Kupfer & Le, Citation2018). The functional utility of Trypophobia – as might be argued for fear of snakes for example – also remains unknown. The primary aim of the present study was to evaluate the role of disgust in Trypophobia using contamination tasks. Addressing this is important as it paves the way for determining function, aetiology, maintenance, and potentially treatment.
As fear and disgust are often activated concurrently and result in similar defensive responses (e.g. avoidance), this can make it hard to distinguish between them (Barlow, Citation2004; Rozin & Fallon, Citation1987). Investigating the role of disgust in phobias, and specifically in Trypophobia is important as disgust can influence the severity of self-reported symptoms in fear-based disorders such that a decrease in disgust levels can predict a decrease in reported symptoms (Olatunji, Citation2010). Furthermore, the involvement of disgust would suggest a somewhat different approach to treatment than for fear-based phobias. The learning processes underlying fear and disgust differ as such that fear is based on expectancy learning and acquired through Pavlovian conditioning, where the fear response is elicited in expectation of a dangerous object or situation (Myers & Davis, Citation2007). For disgust, however, it has been suggested that acquisition occurs via evaluative conditioning, a type of learning which is harder to extinguish (Schienle et al., Citation2005). While fear is generally treated with gradual exposure to the feared object or situation to desensitise and extinguish the response (Mineka, Citation1985), exposure may then be less effective at eliminating disgust, with counterconditioning and revaluation likely to be more useful (de Houwer, Citation2011).
Phobias are generally characterised by excessive and irrational fear (APA, Citation2013). Functionally, fear is a conserved defensive reaction to perceived threat (e.g. Woody & Teachman, Citation2000). Fear appraisals mainly focus on imminent danger, such as potentially poisonous or dangerous animals. In contrast, disgust has been linked to disease avoidance (e.g. Oaten et al., Citation2009). Appraisal processes for disgust focus on contamination, the feeling that an object’s disgusting properties have been transferred to another object by contact (e.g. Rachman, Citation2004). Generally, disgust elicitors fall into three categories: core disgust (i.e. rotting food, small animals, body or waste products), animal reminder disgust (i.e. death or body envelope violations), and contamination disgust (Olatunji et al., Citation2012).
Disgust has been linked to phobias and anxiety-based disorders, particularly small animal phobias (e.g. spider phobia), blood-injection-injury phobia (BII), and contamination-related obsessive-compulsive disorder (C-OCD; Cisler et al., Citation2009). One reason why these may all involve disgust is that these psychopathologies all include elicitors that fit into one of the categories identified above. It is therefore unsurprising that BII has been significantly related to animal reminder disgust (Olatunji et al., Citation2006). Some researchers even suggest that these psychopathologies also have a disease avoidance function (Woody & Teachman, Citation2000), and it is easy to see the link between disease avoidance and BII or C-OCD. Matchett and Davey (Citation1991) examined the link between disgust or contamination sensitivity and fear for animal phobias. They found that disgust and contamination sensitivity was related to fear of small animals, but only those that don’t attack humans and those that are considered to evoke revulsion, considering it support for the disease avoidance model for small animal phobias (e.g. cockroaches or spiders). Furthermore, in small animal phobias, fear of contamination, and hence disgust, is heightened, suggesting spiders, cockroaches etc. are often seen as a source of contamination (Mulkens et al., Citation1996).
Previous research has linked Trypophobia with disgust, however, results have been mixed and there is no consensus as to which emotions trypophobic stimuli evoke. Early research described the distress experienced by images of holes as a fear reaction (Cole & Wilkins, Citation2013); Imaizumi et al. (Citation2016b) suggested that Trypophobia proneness can be predicted by core disgust sensitivity, suggesting the involvement of disgust. Kupfer and Le (Citation2018) examined Trypophobia as a disease avoidance response using disease relevant and irrelevant clusters. Emotion ratings and open-ended responses revealed that aversive reactions were primarily based on disgust. For studies using physiological measures, the results are harder to interpret. Ayzenberg et al. (Citation2018) found that exposure to trypophobic images resulted in pupil constriction, which is associated with parasympathetic activation and possibly indicative of disgust. Le et al. (Citation2020) examined participant’s heart rate and heart rate variability after seeing trypophobic images and found an increase in both variables, again possibly consistent with a disgust reaction – but only in trypophobic participants. In contrast, electrodermal activity following exposure to trypophobic images indicated sympathetic nervous system activation – suggestive of fear (Pipitone et al., Citation2017).
A further source of evidence for disgust vs. fear as underlying emotion concerns psychological treatment of Trypophobia, for which there are two published case studies. One examined cognitive behavioural therapy (CBT) including exposure (İmrek et al., Citation2018), while the other analysed CBT in combination with sertraline (Martínez-Aguayo et al., Citation2018). Both found an improvement in symptoms after treatment. This improvement was driven by a reduction in fear but did not lead to extinction of the aversive response. Indeed, Martínez-Aguayo et al. (Citation2018) reported that disgust towards trypophobic objects was still present, highlighting the potential importance of establishing which emotions are present, so treatment can be modified accordingly.
The easiest way to establish the involvement of particular emotions, and hence to differentiate fear from disgust, is by using self-report. Humans can reliably differentiate between fear and disgust based on their subjective feelings and action tendencies (Roseman et al., Citation1994). A further approach is to study negative contamination, as this seems to be a unique and defining characteristic of disgust, and hence, potentially diagnostic of its presence (Rozin & Fallon, Citation1987). Several studies in other domains have included a “chain of contagion” task or “contaminated cookie” task (Mulkens et al., Citation1996; Tolin et al., Citation2004). The “contaminated cookie” task refers to experiments where previously neutral and preferred food (i.e. cookies) is deemed inedible after it has been in contact with disgusting items (i.e. becoming contaminated). The “chain of contagion” task is an approach that measures the degree to which objects that are deemed disgusting can contaminate neutral objects (i.e. via transfer from one object to another).
Trypophobia has mainly been studied using images (Cole & Wilkins, Citation2013; Le et al., Citation2015). The general approach is to form two groups of participants – a trypophobic and a non-trypophobic group. Trypophobic participants can be identified either by personal report or via their responses on the Trypophobia Questionnaire (Le et al., Citation2015). This questionnaire can also be used to group participants into either high or low Trypophobia proneness. So far, no study has analysed trypophobic reactions towards actual trypophobic-inducing objects. Furthermore, only a few studies have used self-rated emotion scales to differentiate between disgust and fear and none have used behavioural experiments such as the “chain of contagion” task to test for contamination – putatively indicative of disgust. In addition, while people with Trypophobia report aversion to both natural and human-made objects, differences between these categories have not been explored either. Such differences may be important in understanding the function of these type of reaction to clusters of holes. In sum, this report involved two studies using contamination tasks to evaluate disgust in Trypophobia, with both comparing groups of trypophobic and non-trypophobic participants. Study 1 is a brief exploratory online study using self-report ratings to examine the contamination potential of trypophobic images. Study 2 is the main experiment, using a chain of contagion task to compare the contamination propensity of actual trypophobic, disgust and fear-inducing objects.
Study 1 – online self-report ratings examining contamination potential
Method
Overview
This study was composed of two parts. The first presented demographic questions followed by the Trypophobia and disgust questionnaires. In the second part, participants were shown trypophobic, disgust and control images with the aim to examine disgust contamination potential to imagined direct and indirect contact with the stimuli. The study was self-paced and took approximately 15 min to complete.
Participants
Power analyses indicated that 34 participants per group were needed to achieve an effect size of .5 and a power of .8 for one-sample t-tests, while a sample size of 45 for the trypophobic group and 111 for the control group were needed for independent t-tests (assuming a sample ratio of .4, due to advertising). Based on this, we intended to recruit at least 50 trypophobic participants and 120 participants for the control group but were not closing the survey until the end of the semester to enable students to obtain course credits. Participants were recruited from the undergraduate student pool at Macquarie University and received partial course credit for their involvement. Participants were also recruited from online support groups for Trypophobia (“Trypophobia: Fear of Clusters of Holes” https://www.facebook.com/groups/3318322299/ or “Trypophobia Support Group” https://www.facebook.com/groups/173094772752228/). Participants from support groups had to be at least 18 years of age and reside in Australia. They were compensated for their time by entering a prize draw to win a $100 voucher. A total of 295 participants initially participated in this study. One participant was removed due to short completion time (less than five minutes) and three participants provided invalid responses (extreme responses for decoy questions on the DS-R) and were excluded. The final sample consisted of 291 participants (79% female) made up of 231 students and 60 support group peers with ages ranging from 17 to 62 years (M = 23.5, SD = 9.5).
Measures
Self-report questionnaires
Trypophobia Questionnaire
The TQ (Le et al., Citation2015) was developed to measure proneness to Trypophobia. The questionnaire consists of 19 items. Seventeen items measure subjective and somatic responses to trypophobic images such as “I feel anxious, full of dread or fearful”, “I feel sick or nauseous” or “I have trouble breathing”, and two items include decoy questions (“I want to laugh” and “I feel at peace”) that are not relevant to the Trypophobia construct. Participants rate the items based on their experience when looking at two trypophobic images (honeycomb and lotus seed pod).
All questionnaire items are measured on a five-point scale ranging from “Not at all” (1) to “Extremely” (5), with higher scores indicating greater impairment. The final score is derived from the sum of all item scores, excluding dummy items. Scores range from 17 to 85, and Le et al. (Citation2015) found that sensitivity and specificity of the TQ is greatest at scores above 31. Thus, an individual who scores 32 or above is deemed as having Trypophobia.
Previous research has established construct, convergent and discriminant validity and demonstrated a single-factor solution for the questionnaire, explaining 63.3% of the total variance. Internal consistency for the TQ is good with α = .94 as is test-retest reliability r = .85 (Le et al., Citation2015). The questionnaire has also been validated with a Japanese adult sample and reliability and validity of the Japanese version has been confirmed (Imaizumi et al., Citation2016a). This questionnaire also demonstrated good internal consistency in our study with α = .95.
Disgust-Scale Revised
The DS-R (Haidt et al., Citation1994; modified by Olatunji et al., Citation2007) is a 25-item questionnaire measuring disgust sensitivity on the three disgust factors core (including food, small animals, or body products), animal-reminder (including death or body envelope violations) and contamination (including concerns about interpersonal transmission of essence). Items are answered on a five-point scale, ranging from 0 (“Strongly disagree (very untrue about me)” or “Not disgusting at all”) to 4 (“Strongly agree (very true about me)” or “Extremely disgusting”). The questionnaire also includes two decoy items to identify people who are not paying attention (“I would rather eat a piece of fruit than a piece of paper” and “You see a person eating an apple with a knife and fork”). The final overall disgust score is the mean of all item scores, excluding the dummy questions. Each disgust sensitivity factor score is also calculated separately, with core disgust consisting of 12 items, animal-reminder including 8 items and contamination consisting of 5 items.
Previous research has shown that overall internal consistency is good with α = .84, while consistency for the three core structures ranges between α = .61 (contamination), α = .74 (core) and α = .78 (animal reminder) (Olatunji et al., Citation2007). The DS-R and its three core disgust factors has been confirmed in eight countries and proven to be psychometrically superior to the original Disgust Scale (DS) developed by Haidt et al. (Citation1994) (Olatunji et al., Citation2009; van Overveld et al., Citation2011). The DS is the only questionnaire of disgust to have a behavioural validation (Rozin et al., Citation1999), hence its use here. The questionnaire demonstrated good internal consistency in our study, with α = .88 (overall), α = .63 (contamination), α = .77 (core) and α = .80 (animal reminder).
Materials
Images
The images were obtained from Le et al. (Citation2015) across the three categories (1) trypophobic images, (2) disgust images and (3) neutral images (control). Each category included 20 images, and all stimuli displayed different objects. Control stimuli consisted of objects with just one hole, such as a washing machine, tyre, or CD, while disgust images included objects such as mould, dirt, sewage, blood, cockroaches, rubbish, worms, rats, varicose veins, or vomit.
Emotion Rating Scale
Participants rated their elicited emotions (angry, anxious, disgusted, fearful, happy, sad, surprised, and distressed) in relation to the visual stimuli on a five-point scale ranging from “Very slightly or not at all” (1) to “Extremely” (5) To determine contamination potential, only ratings of disgust were of interest and the other emotions were included to distract participants from our primary focus.
Procedure
The study was undertaken online via Qualtrics. Participants completed the study on their own devices at a time convenient for them. While the survey was self-paced, the time spent looking at each stimulus was recorded to check if participants spent sufficient time looking at the images to provide accurate emotion ratings.
Participants started by filling out the self-report questionnaires, followed by a series of demographic questions. The order of the self-report questionnaires (TQ and DS-R) was counterbalanced. The demographic section was used as a buffer to emotional or physical effects the TQ might have had on participants.
To establish disgust contamination potential, participants were shown a set of stimuli assessing direct (imagined touch) and indirect contamination (via a brand-new pencil that was rubbed across the object) for each of the categories (trypophobic, disgust and control). Participants were shown 5 randomly chosen images out of a pool of 20 available images for each category. Stimuli were hence largely different for each participant, although all images were drawn from the same pool for each category. After viewing each image, participants were asked to complete the Emotion Rating Scale. For stimuli in the direct contamination set, participants were asked to rate their emotions when imagining touching the objects, and for stimuli in the indirect contamination set, they were asked to rate their emotions when imagining touching a pencil that was rubbed across the object.
Data analysis
As study 1 was considered a brief experiment to explore if trypophobic images have contamination potential, analyses only focused on these images. Participants who scored 32 or above on the TQ were classified as the trypophobic group while all others were categorised into the control group. Emotion ratings for trypophobic stimuli were averaged to form category ratings. Data were tested for assumption by assessing residual p-plots and examining standardised skewness and kurtosis (<3). Values for control stimuli were non-normal due to multiple values of 1 (“very slightly or not at all”) on the Emotion Rating Scale. As baseline control data could not be included in the parametric analyses due to this non-normality, we subtracted each participant’s baseline ratings from their disgust ratings The analysis includes descriptive statistics, followed by one-sample t-tests to analyse contamination potential of trypophobic images and finally independent samples t-tests to examine group differences.
Results
Part 1: self-report questionnaires
Descriptive statistics are shown in . Independent t-tests revealed significantly higher disgust sensitivity and Trypophobia proneness scores in the trypophobic group. Results did not indicate age differences between groups but showed a significant relationship between gender and trypophobia proneness X2 (1, N = 291) = 4.32, p = .038, with females being significantly more prone to trypophobia (32%) than males (18%).
Table 1. Questionnaire descriptive statistics.
Part 2: disgust contamination potential
To establish if trypophobic stimuli have contamination potential, one-sample t-tests (µ = 0) were used for each of the groups (i.e. trypophobic and control group) to establish if imagined touch induces disgust. This was done first to measure direct contamination (i.e. elicited disgust when imagining touching the objects), followed by indirect contamination (i.e. elicited disgust when imagining touching a pencil that was rubbed across the object). Groups were then compared for differences in contamination potential using independent sample t-tests.
Direct contamination results revealed significant effects in both groups. Participants in the trypophobic group felt disgust at the prospect of touching the depicted trypophobic items (M = 2.6, SD = 1.2), t(84) = 19.70, p < .001, d = 2.1, as did participants in the control group (M = 0.6, SD = 1.0), t(205) = 8.69, p < .001, d = 0.6. Thus, the trypophobic stimuli can induce disgust in both groups at the prospect of direct contact. We then examined if the prospect of direct contamination induced greater disgust in the trypophobic group relative to controls – it did t(289) = 13.84, p < .001, d = 1.8.
Indirect contamination results were similar to the direct contamination condition for both groups. Trypophobic participants experienced disgust (M = 2.3, SD = 1.5), t(84) = 14.14, p < .001, d = 1.5, as did the control group (M = 0.5, SD = 0.9), t(205) = 7.74, p < .001, d = 0.5. This indicates that participants in both groups believe that they would feel disgust if touched by a previously neutral object that had come into contact with a trypophobic stimulus. Indirect contamination also induced greater disgust in the trypophobic group relative to controls, t(289) = 12.35, p < .001, d = 1.6.
Discussion
Direct contamination was measured by establishing if imagined touch induces disgust while indirect contamination was evaluated by analysing if imagined touch of a brand-new pencil that was rubbed across the depicted images induces disgust. Results revealed that trypophobic stimuli induce disgust in both groups at the prospect of both, direct and indirect contact. However, the trypophobic group experienced disgust to a significantly greater extent than the control group for both types of contamination. While these results are consistent with disgust being a key emotion evoked when trypophobic participants view trypophobic images, a stronger test of this hypothesis is to examine performance with actual exposure to real stimuli. Thus Study 2 undertook a laboratory experiment to examine reports of disgust and contamination when trypophobic and control participants are exposed to real stimuli.
Study 2 – chain of contagion task
Introduction
Study 2 compared contamination reports for trypophobic, disgust, fear, and control objects, including natural and human-made examples. The latter was included to elucidate the possible functional basis of any disgust response (i.e. would it be greater for natural stimuli with “real” threats hiding in the holes?) as this may have implications for the selection of stimuli for exposure interventions (e.g. naturalistic may be more potent). We also included a short, structured interview with open-ended responses to explore perceived reasons behind the aversion to trypophobic stimuli and examine potential underlying mechanisms, such as pathogen avoidance or protection from potentially dangerous or poisonous animals.
Method
Study design and aim
The study was designed in two parts. The first consisted of a face-to-face chain of contagion task examining emotional reactions and contamination potential towards the test objects. The aim was to determine if trypophobic objects have contamination potential, whether contamination differs across different object categories, and whether there are differences between trypophobic and non-trypophobic participants. Furthermore, to compliment self-report findings, the study also aimed to examine behavioural differences of contamination and whether there are differences between natural and human-made objects. The second part included a brief structured interview to provide information on why trypophobic objects provoke emotions. The study took approximately 30 min to complete.
Participants
Power analyses indicated that 34 participants per group were needed to achieve an effect size of .5 and a power of .8 for one-sample t-tests, while a sample size of 62 for each group was needed for independent t-tests (aiming for equal sample sizes). Power analyses also indicated that a total of 96 participants were needed to achieve an effect size of .3 and power of .8 for a four-way mixed design ANOVA. Based on this, we planned to recruit 62 participants for each group. Participants were recruited from the undergraduate student pool at Macquarie University who received partial course credit for their involvement. Students were preselected according to their results on the TQ (Le et al., Citation2015), which they completed online. This ensured the selection of students who classified as trypophobic (score of 32 and above on the TQ) and non-trypophobic (control group, all other participants). A total of 123 (87% female) participants participated, with ages ranging from 17 to 35 years (M = 19.2, SD = 2.9). The final sample consisted of 62 students in the trypophobic group and 61 students in the control group, with preselection done a priori according to TQ results. Although participants self-recruited, those scoring high on the TQ were specifically targeted and personally invited to maximise differences in TQ scores between groups. Furthermore, male participants also received personal invitations in an attempt to balance gender. No attempts were made to match age.
Part 1 – chain of contagion task
The chain of contagion task was adapted from Tolin et al. (Citation2004). Our experiment included 16 objects which were chosen according to data analysis from the initial online study. Objects included natural and human-made items and were divided into the following eight categories: (1) natural trypophobic items (honeycomb, lotus seed pod, luffa), (2) human-made trypophobic items (crumpet, sponge, brick), (3) natural disgust items (soil, [fake] snotty tissue), (4) human-made disgust items ([fake] used band aid, glass eye), (5) natural fear items (wasp, spider), (6) human-made fear items ([fake] insecticide powder, metal tongues that supposedly have been used to handle radioactive material but have been thoroughly cleaned and de-contaminated) (7) natural neutral items (dried apple ring), and (8) human-made neutral items (toilet roll).
Participants started the task by rating their emotional reaction towards each object on the Emotion Rating Scale in the following order: angry, sad, anxious, disgusted, fearful, surprised, and happy, before moving on to the contagion task. The Emotion Rating Scale is a seven-point paper/pencil scale ranging from “Not at all” (1), “Very slightly” (2), “A little” (3), “Moderately” (4), “Quite a bit” (5), “A lot” (6) to “Extremely” (7). Only ratings of disgust, fear and anxiety were of interest and the other scales were included to distract participants from our primary focus (fear and anxiety were included as previous research indicated that trypophobic stimuli also evokes fear).
To examine contamination, a new pencil (pencil#1) fresh from its box was systematically rubbed for 10 s all over the object. After the pencil had contacted the object, participants were asked if the experimenter could touch them with pencil#1 first on their hand, then arm and finally chin. They were only touched once and only on the body part they last agreed to be touched on. Participants were then required to rate their emotional reactions towards the pencil on the Emotion Rating Scale. If participants did not wish to be touched on their chin, the examiner then picked up a new pencil (pencil#2) fresh from its box and systematically rubbed it for 5 s all over pencil#1, which was discarded afterwards. Once pencil#1 was out of sight, participants were again asked whether the experimenter could touch them with pencil#2 on their hand, arm or chin and accordingly touched on the body part they last agreed to be touched. They were then asked to rate their emotional reactions towards pencil#2. This procedure was repeated for all 16 objects, whereby the object order was random for each participant.
Part 2 – structured interview and self-report questionnaires
Participants were presented with 14 randomised statements as to why an emotional reaction to trypophobic objects might occur. The statements were read and answered once in regard to all of the trypophobic stimuli, which were laid out in front of them. The following statements were used: (1) Something could be hiding in the holes, (2) There are too many holes on the item, (3) The holes are too close together, (4) The holes are too deep, (5) The holes are different sizes, (6) I can’t see what’s in the holes, (7) I’m curious about what’s in the holes, (8) Something dangerous might be in the holes, (9) Something gross might be in the holes, (10) There could be germs or bacteria on the object, (11) I could get bitten or stung if I touch the object, (12) I could get poisoned if I touch the object, (13) There might be something liquid or slimy in the holes, and (14) There might be dirt in the holes. Finally, participants were asked four questions from the DS-R and four from the TQ. Only the highest correlated questions with the overall TQ and the overall DS-R scores as established in Study 1 were chosen to keep the experiment time at a minimum.
Data analysis
As fear and anxiety ratings were very similar, these ratings were collapsed to form a negative emotion rating.
Data were tested for the assumption of normality by assessing residual p-plots and examining standardised skewness and kurtosis (<3). All values for ratings of interest (disgust and negative emotion scale) were distributed normally, excepting behavioural data from the contamination task and the brief structured interview, which were both analysed using non-parametric tests. In five instances, individual emotion ratings for objects of interest were missing and manually imputed by using the average rating of the corresponding emotion for the specific object and participant.
As per the online study, emotion ratings for objects were averaged to form category ratings for trypophobic (honeycomb, lotus seed pod, luffa, synthetic car wash sponge, crumpet, brick), disgust (tissue, soil, glass eye, band-aid), fear (spider, wasp, insecticide, contaminated metal tongues) and neutral objects (dried apple rings and toilet paper roll).
We first examined descriptive statistics. Differences in contamination and negative emotion ratings were assessed across all object categories, using a three-way mixed design ANOVA with Object Category (trypophobic vs. neutral, resp. disgust vs. neutral) and Emotions (disgust vs. negative emotions) as within- and Group (trypophobic vs. control) as between-factor variables. Additionally, behavioural differences in contamination (i.e. number of contamination trials and level of touch) were examined with non-parametric Mann–Whitney tests, separately for each object category to complement self-report findings. Differences in contamination across trypophobic object types were examined with a three-way mixed design ANOVA using within-factor variables Object Type (human-made vs. natural objects) and Emotion (disgust vs. negative emotions) and between-factor variable Group (trypophobic vs. control). To control for multiple comparisons in these tests, we applied the Bonferroni correction. Interaction effects were analysed using simple effects analysis, applying the Bonferroni method to adjust for multiple comparisons. Lastly, we present qualitative statistics for the structured interview.
Results
Part 1a: demographic information and self-report questionnaires
Results did not indicate age or gender differences between groups, however, independent t-tests revealed significantly higher disgust sensitivity and Trypophobia proneness in the trypophobic group. Trypophobic respondents were on average significantly more sensitive to disgust (Mdisgust = 3.0, SDdisgust = .7) and prone to Trypophobia (Mtryp = 44.5, SDdisgust = 10.7) than the control group (Mdisgust = 2.5, SDdisgust = 1.0), tdisgust(121) = 3.23, p = .002; (Mtryp = 17.9, SDtryp = 2.6), ttryp(121) = 18.80, p < .001.
Part 1b: chain of contagion task analysis
Group differences in contamination and negative emotions across object categories
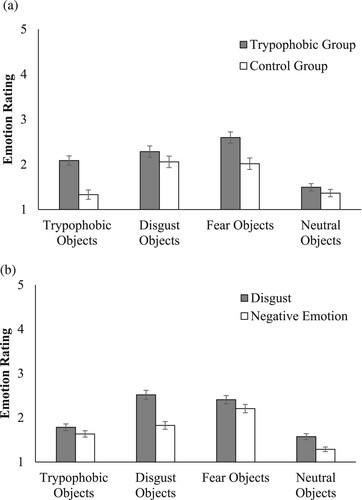
Contamination was examined by rubbing a new pencil (pencil#1) on the trial objects and analysing the disgust ratings towards this previously neutral pencil. As previous research indicated the presence of disgust and fear, we also included negative emotions in this analysis. A three-way mixed design ANOVA was used comparing within factor variables Emotions (disgust vs. negative emotions) for pencil#1 and Object Category (trypophobic vs. disgust vs. fear vs. neutral) with between factor variable Group (trypophobic vs. control). All main effects were significant (see ) as well as the interaction between Object Category and Group F(3,119) = 8.85, p < .001, ηp2 = .07 and Object Category and Emotion F(3,119) = 38.58, p < .001, ηp2 = .24.
Table 2. Three-way ANOVA emotion ratings across all object categories.
(a) displays the interaction effect between Object Category and Group. Simple main effects analyses, using Bonferroni to adjust for multiple comparisons (α_adj = .05/4 = .0125), revealed that while both participant groups reacted similarly to disgust objects F(1,121) = 1.62, p = .205, ηp2 = .01 and neutral objects F(1,121) = 1.24, p = .267, ηp2 = .01, the difference in emotion ratings between groups was much larger for trypophobic F(1,121) = 26.78, p < .001, ηp2 = .18 and fear objects F(1,121) = 10.42, p = .002, ηp2 = .08. However, this more intense emotional response in the trypophobic group did not involve disgust to a greater degree than it did the other negative emotions, as the Object Category by Group by Emotion interaction was not significant. Nonetheless, simple main effects analyses (Bonferroni adjusted α = .05/4 = .0125) to examine the Object Category by Emotion interaction ((b)) clearly indicated that disgust featured more prominently for all participants in their response to disgust objects F(1,121) = 118.48, p < .001, ηp2 = .5. While this analysis identified significant differences in contamination (i.e. disgust ratings) across object categories F(3,119) = 48.85, p < .001, ηp2 = .56, it did not establish a significant difference in contamination between trypophobic objects (M = 1.8, SD = 0.9) and neutral objects (M = 1.6, SD = 0.8), p = .018 (adjusted α = .0125). Consequently, it did not confirm contamination potential for trypophobic objects. Separate simple effects analyses for each group (adjusted α = .05/8 = .00625) also revealed significant differences in contamination across object categories for both groups (FTryp(3,119) = 31.28, p < .001, ηp2 = .44 and FControl(3,119) = 28.19, p < .001, ηp2 = .42). However, contamination potential for trypophobic objects was established, but only for the trypophobic group. In this group, the difference in contamination between trypophobic objects (M = 2.2, SD = 0.9) and neutral objects (M = 1.6, SD = 0.7) was significant, p < .001.
Figure 1. (a) Interaction effect object category × group: emotion ratings pencil#1 for each object category and group (M and SE). (b) Interaction effect object category × emotion: emotion ratings pencil#1 for each object category (M and SE)
Behavioural differences in contamination
Behavioural differences were measured in two ways: (1) the number of contamination trials per participant, and (2) the level of touch, i.e. the body part participants allowed to be touched. To examine behavioural differences between groups on the number of contamination trials, we compared the median number of pencil trials for the different object categories (trypophobic, disgust, fear and neutral) across groups. Pencil#2 trials were only initiated when participants perceived contamination to persist, that is, when they did not allow their chin to be touched by pencil#1. A higher number of pencil#2 trials is hence associated with a greater degree of contamination, meaning that an object contaminates pencil#1 to a greater extent to leave sufficient contamination to further contaminate neutral objects such as pencil#2.
Four non-parametric Mann–Whitney tests (one for each object category) were used to establish behavioural differences in contamination (i.e. the number of contamination trials) between the trypophobic and the control group. To account for multiple comparisons, Bonferroni corrections were applied and the original alpha level α = .05 was corrected to α1 = .05/4 = .0125. Only the trypophobic object category resulted in significant differences between groups, Z = 2.60, p < .001. For trypophobic group participants, contamination persisted to a significantly greater degree for trypophobic objects, and these objects contaminated pencil#1 to a greater extent (Mdn = 1.3) than for the control group (Mdn = 1.0).
For the analysis of the level of touch participants allowed with pencil#1 (level 0 = no touch, level 1 = arm, level 2 = hand, level 3 = chin), we presumed higher levels of touch indicate lower levels of object contamination. To validate this association, we used the Pearson Correlation Coefficient to analyse the relationship between level of touch and disgust ratings for pencil#1, separately for each of the object categories. Results revealed that levels of touch (i.e. no touch or arm as opposed to hand or chin) for trypophobic objects, were indeed negatively associated with ratings of disgust r(121) = –.65, p < .001. This suggests that level of touch and the disgust rating are measuring largely the same construct. Level of touch for the other object categories was also significantly negatively correlated with pencil#1 disgust ratings; disgust objects r(121) = –.42, p < .001 and fear objects r(121) = –.54, p < .001.
Four non-parametric Mann–Whitney tests (one for each object category) were then used to analyse differences in median levels of touch (i.e. the body part where participants allowed to be touched) between groups. Bonferroni corrections were applied again to account for multiple comparisons, and the original alpha level α = .05 was corrected to α1 = .05/4 = .0125. Only the trypophobic object category was significant, with trypophobic participants allowing a significant lower level of touch (Mdn = 2.6) than the control group (Mdn = 3.0), Z = 2.70, p < .001. No other group comparison was significant.
Differences in contamination between human-made and natural trypophobic objects
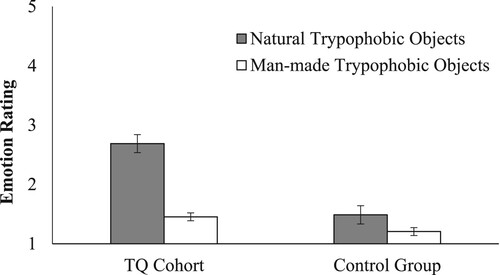
To examine differences in contamination between human-made (synthetic car wash sponge, crumpet, brick) and natural (lotus seed pod, honeycomb, luffa) trypophobic objects, a three-way mixed design ANOVA was used comparing Object Type (human-made vs. natural) and Emotions (disgust vs. negative emotions) for pencil#1 as within-subject factors and Group as the between factor. All main effects were significant, with trypophobic objects inducing on average significantly more disgust (M = 1.8, SD = .9) than negative emotions (M = 1.6, SD = .8), F(1,121) = 27.42, p < .001, ηp2 = .19, natural trypophobic objects (M = 2.1, SD = 1.2) evoking on average significantly more emotions than man-made trypophobic objects (M = 1.3, SD = .5), F(1,121) = 82.29, p < .001, ηp2 = .41, and the trypophobic group (M = 2.1, SD = 1.1) experiencing on average significantly higher emotions than the control group (M = 1.3, SD = 1.1), F(1,121) = 26.77, p < .001, ηp2 = .18. Furthermore, the interaction effect between Object Type and Group, F(1,121) = 35.67, p < .001, ηp2 = .23, illustrated in . There was a much larger difference in reported emotions between natural and human-made trypophobic objects for participants in the trypophobic group than for controls. Trypophobic participants’ emotional reaction was significantly higher for natural trypophobic objects than human-made objects while non-trypophobic participants’ emotional reactions were quite similar for both object types.
Figure 2. Emotion ratings for natural and human-made trypophobic objects by group (M and SE).
To complement these self-report findings, we further analysed behavioural differences between natural and human-made trypophobic objects, again comparing median number of pencil trials across groups. Two non-parametric Mann–Whitney tests were used to establish behavioural differences in number of trials between trypophobic and control groups for natural as well as human-made trypophobic objects.
Only natural trypophobic objects resulted in significant differences between groups, with trypophobic participants requiring significantly more pencil#2 trials (Mdn = 1.5) than the control group (Mdn = 1.3), Z = 2.5, p = .011. For trypophobic participants, contamination persisted to a significantly greater degree for natural trypophobic objects, and these objects contaminated pencil#1 to a greater extent than for the control group.
Level of touch for pencil#1 was also analysed using two non-parametric Mann–Whitney tests to examine differences in median levels of touch between participant groups. Again, only natural trypophobic objects achieved significant results, with trypophobic participants allowing a significant lower level of touch (Mdn = 2.2) than the control group (Mdn = 2.6), Z = 2.8, p < .001.
Part 2: brief interview – why are trypophobic objects disturbing?
All participants were provided a set of potential reasons why trypophobic objects might be disturbing and asked whether they agreed with these statements. shows the results for both groups. Trypophobic group participants agreed significantly more than controls to disgust-related items such as “Something gross is hiding in there” X2(1, N = 123) = 18.95, p < .001 or “Something liquid/slimy is in there” X2(1, N = 123) = 4.69, p = .03 or statements relating to uncertainty “I can’t see what’s in there” X2(1, N = 123) = 8.21, p < .001. Furthermore, trypophobic group participants also agreed significantly more to feature-related questions, such as the number of holes (too many) X2(1, N = 123) = 32.76, p < .001, proximity of holes (too close) X2(1, N = 123) = 32.89, p < .001, and their depth (too deep) X2(1, N = 123) = 12.36, p < .001.
Table 3. Frequency of agreement with statements by group.
General discussion
The aim of this research was to investigate the role of disgust in Trypophobia using contamination tasks. Contamination is a signature response for disgusting objects and is potentially diagnostic of the presence of disgust (Rozin & Fallon, Citation1987). In both studies, trypophobic stimuli demonstrated contamination potential, indicating disgust was a key component of trypophobic participants’ reaction when they encountered stimuli with clusters of holes. Study 1 found that trypophobic images induced direct (imagined touch of the depicted object) and indirect contamination (imagined touch of a brand-new pencil that has been rubbed across the displayed object) for all participants, however, to a greater extend for the trypophobic group. Study 2 found evidence that real trypophobic objects were contaminating, but only in trypophobic participants. While contamination for disgust objects was largely the same between groups, controls showed little emotional response to trypophobic objects. Behavioural measures complemented the self-report findings and showed that trypophobic participants required a significantly higher number of trials per object, which is associated with a greater degree of contamination. Furthermore, they allowed a significantly lower level of touch (i.e. the body part participants allowed to be touched) than the control group. The presence of contamination within the trypophobic group suggests that disgust is induced by trypophobic stimuli as contamination is a distinguishing feature of disgust in the context of other negative emotions (e.g. Curtis et al., Citation2011; Rachman, Citation2004; Rozin & Fallon, Citation1987). Moreover, when the contamination findings are considered in concert with self-report ratings of disgust and behavioural responses (i.e. more trials and lower level of touch), they strongly suggest that trypophobic participants experience this emotion when they encounter trypophobic stimuli.
The important role of disgust in aversion to trypophobic stimuli could potentially contribute to the development and maintenance of what people report as a phobic reaction. As the adaptive value of disgust has been linked to disease avoidance (e.g. Curtis et al., Citation2011; Oaten et al., Citation2009), the presence of disgust – and disgust-related comments from the interview data (i.e. “something gross is hiding in there”) – suggest disease avoidance as a contributory factor in aversion to trypophobic stimuli. This conclusion is consistent with previous work, which suggested that Trypophobia results from an adaptive predisposition linking clusters of holes to pathogen threat (Kupfer & Le, Citation2018).
Contamination was also measured in Study 1, using images for imagined contamination. Interestingly, however, results differed compared to Study 2 where we used real objects. Imagined contamination resulted in a contamination response for both research groups, while real objects only resulted in contamination for the trypophobic group. A possible explanation could be that imagined contamination requires mental imagery and participants might have experienced a lack of control over their mental imagery. The control group might not have been able to prevent imagining the worst-case scenario, and hence, overestimated the consequences which in turn amplified their emotional responses. This explanation is in line with previous research that found that imagined contamination can exacerbate emotions due to cognitive amplification (Rachman, Citation2004). Alternatively, images might show clearer details of stimuli than real objects, which could elicit more intense emotional reactions from both groups.
Study 2 also revealed that both trypophobic and non-trypophobic groups had similar emotional reactions to disgust stimuli. This suggests the heightened emotional response of trypophobic participants towards trypophobic stimuli cannot be explained by a general sensitivity to disgust. Instead, as trypophobic stimuli only evoked strong emotional responses from trypophobic participants, this implies that these participants have a heightened sensitivity towards a particular class of stimuli, and it is this which causes the stronger emotional response. Such potent negative emotional responses can serve as effective unconditioned stimuli (Mowrer, Citation1960). They can lead to escape or avoidance behaviour, thereby preventing interaction with the stimulus, which in turn increases the likelihood of recurring aversive behaviour in the future. This could potentially contribute to the maintenance of Trypophobia.
Although disgust plays an important role in Trypophobia, other negative emotions (e.g. fear and anxiety) were also reported at a heightened level in trypophobic participants in Study 2, suggesting that the term “phobia” may be an appropriate description of their response. The concurrent activation of fear and anxiety, with disgust, has also been seen in small animal phobias, Blood, Injury and Injection phobia (BII) and Contamination-related Obsessive-Compulsive Disorder (C-OCD), which all share a similar emotional response profile (Cisler et al., Citation2009). Each of these conditions includes cognitive and behavioural components, such as irrational beliefs and appraisals related to disease avoidance, vulnerability to infection or contamination beliefs, which then result in escape or avoidance (Matchett & Davey, Citation1991; Woody & Teachman, Citation2000). They also demonstrate somatic symptoms indicative of both, fear, and disgust, and, interestingly, the potential to contaminate neutral objects (Bianchi & Carter, Citation2012; Tolin et al., Citation2004; Woody et al., Citation2005), which we also found in our research. While C-OCD also includes the element of intrusive repetitive thoughts and obsessions about contamination (APA, Citation2013), there is no evidence, however, that people with Trypophobia have similar thoughts or obsessions.
The concurrent activation of negative emotions and disgust is also particularly important for the development of a suitable treatment for Trypophobia, as successful therapy must be tailored to target not only fear, but also disgust. While the current treatment of choice for specific phobia includes exposure and for C-OCD exposure with response prevention (Barlow, Citation2004), this only targets fear, but not disgust. Efficacy of such treatments has hence been variable (Wolitzky-Taylor et al., Citation2008). As established earlier, it is more effective to use counterconditioning and revaluation to extinguish disgust (de Houwer, Citation2011) and any potential new treatment for Trypophobia should include this in combination with exposure.
A key question is why trypophobic participants should have such an amplified emotional response to trypophobic stimuli. Clearly, most people do not regard them as threatening, but interview data with comments such as “something gross is hiding in there” or “something liquid/ slimy is in there”, suggest that participants envision clusters of holes as potential havens for harmful pathogens or creatures. It seems that the imagination of what might be in or on the holes is what is driving the exaggerated response of trypophobic participants. As already discussed, mental imagery can amplify emotions and emotional reactions by overestimating the likelihood of occurrence or the likelihood of negative consequences (Rachman, Citation2004). Furthermore, those comments were often made in response to natural trypophobic objects, which, in comparison to human-made stimuli, evoked significantly more negative emotion and behavioural avoidance in trypophobic participants. Indeed, it seems that natural objects are responsible for the aversion in trypophobic participants. One possible reason for this difference between natural and human-made objects might be familiarity and exposure. Participants might have been more exposed to human-made objects (sponge, crumpet, or brick), which could have led to desensitisation or a reduced emotional response to these stimuli. A further and related possibility is that as these objects were manufactured, they pose less of a pathogen threat in contrast to natural objects. Taken together, the results and comments imply an adaptive function to protect the body from disease and parasites (e.g. Curtis et al., Citation2011; Oaten et al., Citation2009) which fits well with the disease avoidance theory rather than avoidance of imminent threat through potentially dangerous or poisonous animals.
The present work has some limitations. Participants were mainly self-selected, potentially leading to a sample that may not accurately represent the entire population of people with Trypophobia. As the sample was largely recruited form first year university students, demographic characteristics such as age, gender, ethnicity or socioeconomic status may differ. Furthermore, participants volunteered to take part, and hence, they might differ in their motivation, such that they might have a greater interest in the topic, or personal experiences related to the research. While this not necessarily means that participants in our sample suffer more from Trypophobia, it could mean that they are more aware of their aversive reactions and symptoms or their body and health in general. Our sample might also differ in personality traits and attitudes, as participants that volunteer in research might be more open to new experiences or more extrovert. While these differences could potentially lead to selection biases which could affect the generalisability of our findings, our sample does not differ in recruitment compared to previous research, which also relied on volunteer participants from university student pools or online Trypophobia support groups (e.g. Kupfer & Le, Citation2018; Le et al., Citation2020; Pipitone et al., Citation2017).
Conclusion
The primary aim of this study was to explore the role of disgust in Trypophobia using contamination tasks. Across both studies, disgust was significantly elevated when trypophobic participants were exposed to trypophobic stimuli – relative to non-trypophobic controls, and Study 2 also provided evidence of heightened fear and anxiety. Evidence for a key role of disgust in aversion to trypophobic stimuli was demonstrated by the finding of contamination in trypophobic participants, but not in controls. The presence of disgust suggests an underlying disease avoidance mechanism is similar to what has been found in small animal phobias, BII, and C-OCD.
Disclosure statement
No potential conflict of interest was reported by the author(s).
Additional information
Funding
References
- American Psychiatric Association (APA). (2013). Diagnostic and statistical manual of mental disorders (DSM-5®). American Psychiatric Pub. https://doi.org/10.1176/appi.books.9780890425596
- Ayzenberg, V., Hickey, M. R., & Lourenco, S. F. (2018). Pupillometry reveals the physiological underpinnings of the aversion to holes. PeerJ, 6, e4185. https://doi.org/10.7717/peerj.4185
- Barlow, D. H. (2004). Anxiety and its disorders: The nature and treatment of anxiety and panic. Guilford press.
- Bianchi, K. N., & Carter, M. M. (2012). An experimental analysis of disgust sensitivity and fear of contagion in spider and blood injection injury phobia. Journal of Anxiety Disorders, 26(7), 753–761. https://doi.org/10.1016/j.janxdis.2012.06.004
- Cisler, J. M., Olatunji, B. O., & Lohr, J. M. (2009). Disgust, fear, and the anxiety disorders: A critical review. Clinical Psychology Review, 29(1), 34–46. https://doi.org/10.1016/j.cpr.2008.09.007
- Cole, G. G. (2024). Is trypophobia real? BJPsych Open, 10(2), e48. https://doi.org/10.1192/bjo.2023.621
- Cole, G. G., & Wilkins, A. J. (2013). Fear of holes. Psychological Science, 24(10), 1980–1985. https://doi.org/10.1177/0956797613484937
- Curtis, V., De Barra, M., & Aunger, R. (2011). Disgust as an adaptive system for disease avoidance behaviour. Philosophical Transactions of the Royal Society B: Biological Sciences, 366(1563), 389–401. https://doi.org/10.1098/rstb.2010.0117
- de Houwer, J. (2011). Evaluative conditioning: A review of functional knowledge and mental process theories. In T. R. Schachmann & S. Reilly (Eds.), Associative learning and conditioning theory (pp. 399–416). Oxford University Press. https://doi.org/10.1093/acprof:oso/9780199735969.003.0130.
- Haidt, J., McCauley, C., & Rozin, P. (1994). Individual differences in sensitivity to disgust: A scale sampling seven domains of disgust elicitors. Personality and Individual Differences, 16(5), 701–713. https://doi.org/10.1016/0191-8869(94)90212-7
- Imaizumi, S., Furuno, M., Hibino, H., & Koyama, S. (2016a). Reliability and validity of the Japanese version of the Trypophobia Questionnaire (tq-j). International Journal of Psychology, 51, 544. https://doi.org/10.2132/personality.25.171
- Imaizumi, S., Furuno, M., Hibino, H., & Koyama, S. (2016b). Trypophobia is predicted by disgust sensitivity, empathic traits, and visual discomfort. SpringerPlus, 5(1), 1449. https://doi.org/10.1186/s40064-016-3149-6
- İmrek, Y., Sari, M., Pala, B., & Öztürk, Y. (2018). Efficacy of cognitive-behavioural therapy in the trypophobia in the an adolescent case. Klinik Psikofarmakoloji Bulteni, 28, 243–243.
- Kupfer, T. R., & Le, A. T. (2018). Disgusting clusters: Trypophobia as an overgeneralised disease avoidance response. Cognition and Emotion, 32(4), 729–741. https://doi.org/10.1080/02699931.2017.1345721
- Le, A. T., Cole, G. G., & Wilkins, A. J. (2015). Assessment of trypophobia and an analysis of its visual precipitation. The Quarterly Journal of Experimental Psychology, 68(11), 2304–2322. https://doi.org/10.1080/17470218.2015.1013970
- Le, A., Cole, G. G., & Wilkins, A. (2020). Trypophobia: Heart rate, heart rate variability and cortical haemodynamic response. Journal of Affective Disorders, 274, 1147–1151. https://doi.org/10.1016/j.jad.2020.06.002
- Martínez-Aguayo, J. C., Lanfranco, R. C., Arancibia, M., Sepúlveda, E., & Madrid, E. (2018). Trypophobia: What do we know so far? A case report and comprehensive review of the literature. Frontiers in Psychiatry, 9, 15. https://doi.org/10.3389/fpsyt.2018.00015
- Matchett, G., & Davey, G. C. (1991). A test of a disease-avoidance model of animal phobias. Behaviour Research and Therapy, 29(1), 91–94. https://doi.org/10.1016/S0005-7967(09)80011-9
- Mineka, S. (1985). Animal models of anxiety-based disorders: Their usefulness and limitations. In A. H. Tuma, & J. D. Maser (Eds.), Anxiety and the anxiety disorders (pp. 199–244). Routledge. https://doi.org/10.4324/9780203728215-14.
- Mowrer, O. (1960). Learning theory and behavior. John Wiley & Sons.
- Mulkens, S. A., de Jong, P. J., & Merckelbach, H. (1996). Disgust and spider phobia. Journal of Abnormal Psychology, 105(3), 464. https://doi.org/10.1037/0021-843X.105.3.464
- Myers, K. M., & Davis, M. (2007). Mechanisms of fear extinction. Molecular Psychiatry, 12(2), 120–150. https://doi.org/10.1038/sj.mp.4001939
- Oaten, M., Stevenson, R. J., & Case, T. I. (2009). Disgust as a disease-avoidance mechanism. Psychological Bulletin, 135(2), 303. https://doi.org/10.1037/a0014823
- Olatunji, B. O. (2010). Changes in disgust correspond with changes in symptoms of contamination-based OCD: A prospective examination of specificity. Journal of Anxiety Disorders, 24(3), 313–317. https://doi.org/10.1016/j.janxdis.2010.01.003
- Olatunji, B. O., Adams, T., Ciesielski, B., David, B., Sarawgi, S., & Broman-Fulks, J. (2012). The Three Domains of Disgust Scale: Factor structure, psychometric properties, and conceptual limitations. Assessment, 19(2), 205–225. https://doi.org/10.1177/1073191111432881
- Olatunji, B. O., Moretz, M. W., McKay, D., Bjorklund, F., de Jong, P. J., Haidt, J., Hursti, T. J., Imada, S., Koller, S., & Mancini, F. (2009). Confirming the three-factor structure of the disgust scale – revised in eight countries. Journal of Cross-Cultural Psychology, 40(2), 234–255. https://doi.org/10.1177/0022022108328918
- Olatunji, B. O., Williams, N. L., Sawchuk, C. N., & Lohr, J. M. (2006). Disgust, anxiety and fainting symptoms associated with blood-injection-injury fears: A structural model. Journal of Anxiety Disorders, 20(1), 23–41. https://doi.org/10.1016/j.janxdis.2004.11.009
- Olatunji, B. O., Williams, N. L., Tolin, D. F., Abramowitz, J. S., Sawchuk, C. N., Lohr, J. M., & Elwood, L. S. (2007). The Disgust Scale: Item analysis, factor structure, and suggestions for refinement. Psychological Assessment, 19(3), 281. https://doi.org/10.1037/1040-3590.19.3.281
- Pipitone, R. N., Gallegos, B., & Walters, D. (2017). Physiological responses to trypophobic images and further scale validity of the trypophobia questionnaire. Personality and Individual Differences, 108, 66–68. https://doi.org/10.1016/j.paid.2016.11.068
- Rachman, S. (2004). Fear of contamination. Behaviour Research and Therapy, 42(11), 1227–1255. https://doi.org/10.1016/j.brat.2003.10.009
- Roseman, I. J., Wiest, C., & Swartz, T. S. (1994). Phenomenology, behaviors, and goals differentiate discrete emotions. Journal of Personality and Social Psychology, 67(2), 206. https://doi.org/10.1037/0022-3514.67.2.206
- Rozin, P., & Fallon, A. E. (1987). A perspective on disgust. Psychological Review, 94(1), 23. https://doi.org/10.1037/0033-295X.94.1.23
- Rozin, P., Haidt, J., McCauley, C., Dunlop, L., & Ashmore, M. (1999). Individual differences in disgust sensitivity: Comparisons and evaluations of paper-and-pencil versus behavioral measures. Journal of Research in Personality, 33(3), 330–351. https://doi.org/10.1006/jrpe.1999.2251
- Schienle, A., Schäfer, A., Walter, B., Stark, R., & Vaitl, D. (2005). Elevated disgust sensitivity in blood phobia. Cognition and Emotion, 19(8), 1229–1241. https://doi.org/10.1080/02699930500286364
- Tolin, D. F., Worhunsky, P., & Maltby, N. (2004). Sympathetic magic in contamination-related OCD. Journal of Behavior Therapy and Experimental Psychiatry, 35(2), 193–205. https://doi.org/10.1016/j.jbtep.2004.04.009
- van Overveld, M., de Jong, P. J., Peters, M. L., & Schouten, E. (2011). The Disgust Scale-R: A valid and reliable index to investigate separate disgust domains? Personality and Individual Differences, 51(3), 325–330. https://doi.org/10.1016/j.paid.2011.03.023
- Vlok-Barnard, M., & Stein, D. J. (2017). Trypophobia: An investigation of clinical features. Revista Brasileira de Psiquiatria, 39(4), 337–341. https://doi.org/10.1590/1516-4446-2016-2079
- Wolitzky-Taylor, K. B., Horowitz, J. D., Powers, M. B., & Telch, M. J. (2008). Psychological approaches in the treatment of specific phobias: A meta-analysis. Clinical Psychology Review, 28(6), 1021–1037. https://doi.org/10.1016/j.cpr.2008.02.007
- Woody, S. R., McLean, C., & Klassen, T. (2005). Disgust as a motivator of avoidance of spiders. Journal of Anxiety Disorders, 19(4), 461–475. https://doi.org/10.1016/j.janxdis.2004.04.002
- Woody, S. R., & Teachman, B. A. (2000). Intersection of disgust and fear: Normative and pathological views. Clinical Psychology: Science and Practice, 7(3), 291. https://doi.org/10.1093/clipsy.7.3.291