
ABSTRACT
Purpose: This longitudinal study analyzed the relationship between players’ physical (sprint distances, number of high-intensity accelerations and decelerations assessed with individual and relative thresholds) and technical (retrieved from SofaScore platform) performances during competition. Methods: Twenty elite players were monitored across a full season. Physical performances were monitored with GNSS devices, retrieving time (s), velocity (km.h−1) and distance (m). Sprint distances were calculated as > 80% of the match peak speed registered across the season. High-intensity accelerations and decelerations were calculated as >75% of the peak values registered across the season. Pearson (r) correlations (with 95% confidence intervals) were calculated to assess the relationship among different physical performance variables and between the physical and technical performance variables. Results: Sprint distances correlated with the number of ball touches (r = −0.36 [−0.49, −0.23], p < .001), accurate passes (r = −0.45 [−0.56, −0.32], p < .001), and dribble attempts (r = 0.30 [0.16, 0.43], p < .001). If players touched the ball more frequently and pass the ball more accurately, they covered shorter sprint distances. However, if players attempted more dribbles, they covered longer sprint distances. Conclusion: Practitioners can develop tactical strategies considering the relationship between sprint distances and technical variables such as ball touches, accurate passes, and dribble attempts.
During soccer matches, players need to cope with different demands and challenges. To do so, coaches try to elaborate a successful tactical strategy, aiming for the best possible technical responses from players, while avoiding physiological strain. During and after competition, coaches evaluate individual performances through different measurement tools (Julian et al., Citation2021) to promote further improvements. These measurements provide important information in two domains: physical demands and technical-tactical performances. Regarding physical demands, practitioners can use systems such as radar-based local positioning systems, semi-automatic video technology, or global positioning systems (Pino-Ortega et al., Citation2022). Currently, practitioners usually assess players efforts with global navigation satellite systems (GNSS) retrieving information of players’ performances, such as the distance covered and the number of intense efforts performed (Torres-Ronda et al., Citation2022). As for the technical-tactical assessments, practitioners and researchers frequently use tracking systems that can provide individual or collective information for match and training performances (Klingner et al., Citation2022; Lago-Peñas et al., Citation2023).
Due to the high intermittency of soccer-specific activities, studies highlight the need to provide high-intensity efforts to players (Beato et al., Citation2021; Stølen et al., Citation2005). Sprints (Cummins et al., Citation2013), accelerations, and decelerations (Akenhead & Nassis, Citation2016) are among the most used variables to monitor high-intensity activities of elite soccer players. In fact, the importance of monitoring these efforts has been widely discussed in the literature (de Hoyo et al., Citation2016; Hader et al., Citation2019; Malone et al., Citation2018; Russel et al., Citation2014; Small et al., Citation2009). However, adequate player monitoring implies making operational decisions before drawing interpretations and conclusions. For instance, sprint efforts are usually identified with the use of absolute and arbitrary thresholds (frequently for efforts >25.2 km.h−1), disregarding players’ individual characteristics (Gualtieri et al., Citation2023). Similarly, accelerations and decelerations are also classified with absolute and arbitrary thresholds (Silva et al., Citation2022). Different strategies have been proposed to solve the problem of using absolute and arbitrary thresholds. First, measuring distances > 80% of the individual match peak speeds can provide a more individualized approach to sprint demands (O’Connor et al., Citation2020), reduce the differences reported between playing positions (Silva et al., Citation2024), and outline important information about non-contact injuries (Aiello et al., Citation2023). Secondly, regarding accelerations and decelerations, selecting a relative intensity based on peak match efforts can help practitioners to monitor these efforts with individualized intensities (Silva, Nakamura, Serpiello, et al., Citation2023). In this particular case, previous studies (Silva, Nakamura, Serpiello, et al., Citation2023; Sonderegger et al., Citation2016) have classified high-intensity accelerations or decelerations as efforts > 75% of the individual maximal value.
Furthermore, the importance of physical and technical performance has also been discussed in previous studies. Specifically, high-speed displacements during offensive actions, such as running with the ball, can help players improve possession phases, while intense physical efforts during defensive actions can help players prevent goal situations from the opposition (Oliva-Lozano et al., Citation2023). Moreover, previous research has identified the influence of technical variables such as shots and passes on the team’s success (Moreira Praça et al., Citation2023). For example, teams with higher success covered longer distances while running (Brito Souza et al., Citation2020) and sprinting (Chmura et al., Citation2022) with the ball. Interestingly, most of the covered sprint distance is without the ball (Oliva-Lozano et al., Citation2022), which means that teams could potentially need to increase both (with and without). Also, teams with more success showed higher averages of goals for total number of shots and for shots on goal than teams with less success (Lago-Ballesteros & Lago-Peñas, Citation2010).
Understanding the relationship between physical and technical variables can help coaches individualize the development of players’ capabilities and increase their preparedness to avoid performance decrements during competition. Although previous studies have assessed the relationship between physical and technical parameters, these studies have analyzed physical demands with absolute and arbitrary thresholds (Kokstejn et al., Citation2019; Radziminski et al., Citation2022). Therefore, this study aimed to analyze the relationship between physical efforts (sprint distance, and number of high-intensity accelerations and decelerations)—collected relatively and individually—with different technical performance variables. As a secondary objective, we aimed to analyze the relationship between the physical variables.
Materials and methods
Study design
A longitudinal study design was implemented to assess the relationships between sprint and high-intensity accelerations and decelerations—calculated with individual and relative thresholds—with individual technical performances, during official matches. Data was collected during all matches of one team competing in the Portuguese first division between August 2021 and May 2022. Physical variables (sprint distance, number of high-intensity accelerations, and number of high-intensity decelerations) were collected and calculated from raw data, retrieving time (seconds), speed (km.h−1), and distance (m) for each player and for each match.
Participants
From the initial sample of thirty-six soccer players, twenty (n = 20) elite-level (McKay et al., Citation2022) players were selected to participate in this study (mean ± SD age, height and weight were 24.9 ± 4.0 years, 182.1 ± 7.5 cm, and 75.1 ± 8.3 kg). Only outfield playing positions were selected and, to be included, one full match participation was required. Additionally, only data from full matches participations were retained for analyses. Playing positions included central defender (CD; n = 6), fullback (FB; n = 3), central midfielder (CM; n = 5), wide midfielder (WM; n = 4) and forward (FW; n = 2). A a-priori power analysis was calculated using the G-Power software (version 3.1, University Kiel, Dsseldorf, Germany), which required 111 observations (Lakens, Citation2022), to achieve a power of 0.95. Number of observations were 172 (CD = 74; FB = 25; CM = 31; WM = 33; FW = 9). Data treatment followed the Declaration of Helsinki guidelines and was approved by the Ethics Committee (35/2021). Since the technical data was publicly available, players’ information was coded (as CD1, CD2, and so on) before it was treated.
Procedures
Physical demands (sprint, accelerations, and decelerations) were monitored with a 10-Hz global positioning system (Catapult Vector S7—Catapult Sports, Melbourne, Australia) that encompassed a double constellation system (GNSS and GPS). This model is certified by FIFA (1003407; from 15 August 2021 to 14 August 2023) and the 10-Hz sampling rate has been previously validated for high-speed efforts in team sports (Scott et al., Citation2016). Devices were fixed between the upper scapulae at approximately the T3–4 junction and activated 15 minutes before use, as those were the manufacturer’s instructions. The number of satellites available were 12 ± 2. All players wore the same device across the full season. From each raw data file, time (seconds), speed (km.h−1), and distance (m) were downloaded from the proprietary software (OpenField Console, Catapult Sports, Melbourne, Australia).
Physical efforts were measured individually with relative thresholds. Since field tests fail to mimic peak efforts achieved during competition (Kyprianou et al., Citation2022; Massard et al., Citation2018), we used match peak efforts as reference values to calculate the relative intensities. Therefore, the individual peak match speed was retrieved as the highest speed recorded during all league matches (thirty-four league matches) to assess sprint demands. The individual relative threshold was established at 80% of the peak match speed, as this presented advantages regarding playing positions differentiation and injury monitoring (Aiello et al., Citation2023; Silva et al., Citation2024). Sprint distances were counted for every 0.1 seconds if the speed surpassed the established threshold. To assess accelerations and decelerations efforts, peak match accelerations and decelerations were retrieved as the highest effort registered across the full season. For accelerations, the highest value was collected for each starting speed bandwidth interval (<5 km.h−1, 5–10 km.h−1, 10–15 km.h−1, 15–20 km.h−1, 20–25 km.h−1, > 25 km.h−1) because the acceleration capacity decreases as the starting speed increases (Silva, Nakamura, Serpiello, et al., Citation2023; Sonderegger et al., Citation2016). Accelerations and decelerations were counted as long as the velocity increased (acceleration) or decreased (decelerations) without establishing a minimum effort duration (Silva, Nakamura, Ribeiro, et al., Citation2023). High-intensity accelerations and decelerations were calculated as efforts > 75% of the maximal reference value (Silva, Nakamura, Serpiello, et al., Citation2023; Sonderegger et al., Citation2016) and registered as number of efforts.
Individual technical performances were collected from the SofaScore platform as: SofaScore rating (performance indicator that is created by merging and balancing data collected from the match; this rating ranges from 3, the lowest score, to 10, the maximal score), goals, assists, ball touches, accurate passes, pass accuracy (%), key passes, dribble attempts, successful dribbles, shots on target, shots off target, ground duels won, ground duels lost, aerial duels won, aerial duels lost, ball lost, fouls committed, fouls suffered interceptions, tackles, and suffered dribbles (SofaScore, Citationn.d.). Sofa Score uses the Opta Sports data collection, which has been previously validated to code players’ match actions (Liu et al., Citation2013). This platorm is free to use and allows soccer fans and the general public to track sports statistics and results.
Statistical analysis
A within-subject design was employed to analyze individual performances. Means ± SD were calculated for every variable of all players and according to their playing position. Pearson (r) correlations with 95% confidence interval (CI) were performed for all players between each physical and technical variable. For example, the number of shots on target of one player registered during one specific match was correlated with his physical demands (sprint distance and number of high-intensity accelerations and decelerations) for that match. The strength of correlations was established as very high (r = 0.90 to 1.00), high (r = 0.70 to 0.89), moderate (r = 0.50 to 0.69), low (r = 0.30 to 0.49), and little if any (r = 0.00 to 0.29) (Asuero et al., Citation2006). Statistical significance was established at p < .05. Additionally, for correlations with low strength or above (r ≥0.30), linear regressions were estimated. The technical variables were set as predictor variables, while the physical variables were set as variables to predict. With this analysis, we intended to assess not only if the dependent variable would increase along with the independent variable, but also to predict values. For example, if one player performs 4 tackles, would he cover longer or shorter distances sprinting? Additionally, linear regressions of all statistically significant correlations (p < .05) were performed (Appendix; Figures A1–A3). Since dividing the sample into players positions decreases the number of observations (i.e. 9 observations for forwards), that analyses (correlations and linear regressions) are presented in Appendix (Tables A1–A5 and Figures A4–A13). All statistical analyses were performed using Microsoft Excel (Microsoft Corporation; Version 16.68) and Jamovi (with ESCI package) (Jamovi, Citation2022; Team, Citation2021).
Results
Means ± SD for all players and by playing position are presented in . The correlation between sprint distance and the number of high-intensity accelerations was 0.09 [−0.06, 0.23] (p = .26). The correlation between sprint distance and the number of high-intensity decelerations was 0.06 [−0.09, 0.21] (p = .41). Finally, the correlation between the number of high-intensity accelerations and the number of high-intensity decelerations was 0.26 [0.12, 0.39] (p < .001). Correlations between physical variables and technical variables are presented in . Linear regressions between sprint distance and touches, accurate passes and dribble attempts are represented in , as these were the only correlations with strength of correlation classified as low or above (r ≥0.30). The remaining linear regressions (of statistically significant correlations) are available in Appendix (Figures A1–A14). From the three physical variables, sprint distance presented more statistically significant correlations (correlated with 14 technical variables; n = 14) than the number of high-intensity accelerations (n = 8) and the number of high-intensity decelerations (n = 2) did. However, most correlations presented neglectable values (r < 0.30). The three linear regressions presented in show that if players touched the ball more frequently and passed the ball more accurately, they covered shorter sprint distances. However, if players attempted more dribbles, they covered longer sprint distances.
Figure 1. Linear regressions for correlations with low strength or above (r ≥0.30) (between number of touches and sprint distance; number of accurate passes and sprint distance; number of dribble attempts and sprint distance).
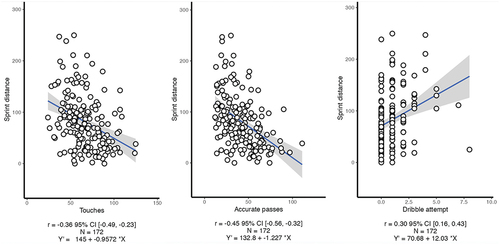
Table 1. Mean ± SD for every physical and technical variables to all players and according to playing position.
Table 2. Pearson (r) correlations [95% CI] between sprint distance (m), number of high-intensity accelerations and decelerations, and every technical variable to all players.
Discussion
The main objective of this study was to analyze the relationship between high-intensity efforts (sprints, accelerations, and decelerations), assessed individually and relatively, with different variables of technical performance. The secondary objective was to assess the relationship between the physical variables. Two main results were found: first, of the physical variables, acceleration and deceleration correlated with each other with little if any strength of correlation; and low correlations were reported between sprint distance and ball touches, sprint distance and accurate passes, and sprint distance and dribble attempts.
Previous research has reported high correlations between speed (20 m) and acceleration (10 m) test results (r = 0.79) (Mendez-Villanueva et al., Citation2011). However, during matches, no significant correlations were reported between distances covered with high-intensity accelerations (≥2 m.s−2), high-intensity decelerations (≤-2 m.s−2), and very high-intensity running (>21.99 km.h−1) (Castagna et al., Citation2017). In this study, we analyzed the physical variables with relative and individualized thresholds, because absolute and arbitrary thresholds can fail to portray players’ individuality (Gualtieri et al., Citation2023; Silva et al., Citation2022; Sweeting et al., Citation2017). As so, our study extends this approach, by presenting these physical variables, calculated individually and relative to players’ peak match values, rather than with absolute and arbitrary thresholds.
The relationship between technical and physical performances and the team success has been widely investigated. For example, Andrzejewski et al. (Citation2022) reported high correlations between goals (r = 0.90, p<.001) and assists (r = 0.88, p<.001) with total points obtained at the end of the season. Regarding the physical performance, Hoppe et al. (Citation2015) reported a moderate correlation (r = 0.52, p=.003) between running activities >22.7 km.h−1 and the number of points obtained at the end of the season. Additionally, to evaluate the relationship between physical and technical performances, Filetti et al. (Citation2017) used physical and technical efficiency indexes, reporting a moderate correlation (r = 0.60, p < .001) between them. In contrast, we found weak correlations between technical and physical performances (). The higher correlations (low strength of correlation; r = 0.30 to 0.49) were found between sprint distances and ball touches (r = −0.36 [−0.49, −0.23], p < .001), between sprint distance and accurate passes (r = −0.45 [−0.56, −0.32], p < .001), and between sprint distance and dribble attempts (r = 0.30 [0.16, 0.43], p < .001). This means that if players touched the ball more frequently and performed more accurate passes, they covered shorter sprint distances. Inversely, players covered longer sprint distances if they attempted to dribble more often.
Considering the linear regressions and sprint distances previously reported (~237 m covered ≥24 km.h−1) (Andrzejewski et al., Citation2013, Citation2015), players would touch the ball 40 times, perform 16 accurate passes, and attempt 2.1 dribbles. While these number of actions represent an average of the analyzed team, this simulation brings an interesting perspective regarding technical analysis. Technical performance should be carefully analyzed since several factors, such as sprint distance, can influence individual actions. In this case study, coaching staff could communicate with the leading coach (i.e., manager) that if one player covers shorter sprint distances, he is expected to decrease the number of dribble attempts but increase the number of accurate passes. The leading coach can then decide what kind of behavior he mainly expects from that player. This type of information can be accessed during the match due to the evolution of GNSS technology and video-based systems (Castellano et al., Citation2014).
Although the importance of technical and physical performances being well established in scientific research, previous studies analyzed physical performances with arbitrary and absolute thresholds (Andrzejewski et al., Citation2022; Filetti et al., Citation2017; Hoppe et al., Citation2015; Kokstejn et al., Citation2019; Radziminski et al., Citation2022). However, absolute thresholds are chosen as a replication approach of previous research (Gualtieri et al., Citation2023; Silva et al., Citation2022; Sweeting et al., Citation2017). Our study highlights the importance of players’ individuality, by assessing physical demands with individual and relative thresholds. To do so, we have avoided field tests values, because players capacities can change across a season and, in elite soccer context, constant testing is difficult to implement (Lovell et al., Citation2019). Therefore, using preseason test values can be misleading. Moreover, players usually achieve higher performances during field tests than during competition (Kyprianou et al., Citation2022; Massard et al., Citation2018). Additionally, the relative approach addresses the “one size fits all” problem, by establishing a specific threshold for each player according to their peak efforts. Finally, the relationship between physical and technical variables was assessed intra-individually. This is also a novel approach, that provides an interesting insight to coaches.
Limitations
While presenting a novelty approach when assessing physical and technical match performances, this study presents two major limitations. First, since the sample size can impact the correlations’ strength (Bujang & Baharum, Citation2016), we have assessed the relationships between physical and technical performances without separating playing positions. However, previous research reported differences between positions when assessing physical (Andrzejewski et al., Citation2013; Silva et al., Citation2022) and technical (Hughes et al., Citation2012) performances. In this topic, we should consider two points: first, if we consider all match participations (even if relative, with efforts or performance per minute), we could embrace a potential problem as one player could play few minutes with a “all-in” approach; secondly, we have presented the playing position analysis in supplementary information, which although showing correlations with high strength, definitive conclusions can be compromised by the sample size. Therefore, future studies should increase the sample size and investigate whether similar results are found within each position. As a second limitation, we only analyzed one team from one specific competition, while physical and technical performances can differ between leagues (Dellal et al., Citation2011). Also, including match context such as match location, opponent quality, or match outcome, can improve the perception in this topic. Finally, future research should also consider adding video analysis to understand how technical and physical actions happen.
Implications
The current findings present intriguing applications for both soccer training and competition. From a training standpoint, these findings shed light on the match demands that can be anticipated, particularly regarding technical performance. This anticipation directly influences coaches’ training strategies, as they can now better tailor them to address both physical demands and technical performance. For instance, small-sided games have been widely recommended for enhancing players’ passing skills in soccer (Clemente et al., Citation2021). When incorporating games where passing accuracy is likely to be challenged, such as those played on small pitches (Modric et al., Citation2022) heightened physical responses can be anticipated. Similarly, increased physical demands can be expected in games emphasizing dribbling frequency. When scheduling physical loads for a typical week in soccer, studies have shown daily variations, with peak demands typically occurring around three days before match day (Wrigley et al., Citation2012). Hence, sessions with peak demands could benefit from games that promote frequent dribbling or pose greater difficulty, whereas less demanding sessions could be structured around scenarios where dribbling is less emphasized and passing is facilitated. One approach previously explored is the utilization of numerical superiority games, which have demonstrated higher passing accuracy and reduced physical demands compared to games with equal numbers of players (Praça et al., Citation2015, Citation2017).
Additionally, considering that the way that each team plays has a significant impact on the match outcome (Lago-Ballesteros et al., Citation2012), coaches can perceive the potential demands of playing with possession, or with a more direct play. Other important idea is the evolution of soccer matches across the years. For example, one study has indicated that across 7 seasons, both physical (sprint distance) and technical (number of passes, number of successful passes, touches, and dribbles) performances increased (Barnes et al., Citation2014). Moreover, due to the evolution of tactical approaches to high pressing strategies, players could be exposed to more intense accelerations and decelerations (Harper et al., Citation2021). As so, practitioners need to keep close attention to both physical and technical performances of their players, in an individualize approach, avoiding assessments with arbitrary thresholds. Finally, practitioners should consider that specific technical performances such as ball touches and accurate passes can individually increase the physical demands (i.e. sprint distance).
Conclusion
In conclusion, physical match performances, assessed with relative and individualized thresholds, appear to be independent from each other, since only acceleration and deceleration correlated with each other but with little if any strength of correlation. However, technical performances correlated with physical performances, even if with low strength. Nevertheless, our findings showed that players covered shorter sprinting distances if they touched the ball more often and if they performed more accurate passes. Conversely, players covered longer sprint distances if they attempted to dribble opposition more often.
Appendix
Download MS Word (1.7 MB)Disclosure statement
No potential conflict of interest was reported by the author(s).
Supplementary material
Supplemental data for this article can be accessed online at https://doi.org/10.1080/02701367.2024.2353713.
Additional information
Funding
References
- Aiello, F., DiClaudio, C., Fanchini, M., Impellizzeri, F. M., McCall, A., Sharp, C., & Brown, S. J. (2023). Do non-contact injuries occur during high-speed running in elite football? Preliminary results from a novel GPS and video-based method. Journal of Science and Medicine in Sport, 26(9), 465–470. https://doi.org/10.1016/j.jsams.2023.07.007
- Akenhead, R., & Nassis, G. P. (2016). Training load and player monitoring in high-level football: Current practice and perceptions. International Journal of Sports Physiology and Performance, 11(5), 587–593. https://doi.org/10.1123/ijspp.2015-0331
- Andrzejewski, M., Chmura, J., Pluta, B., & Konarski, J. M. (2015). Sprinting activities and distance covered by top level Europa league soccer players. International Journal of Sports Science and Coaching, 10(1), 39–50. https://doi.org/10.1260/1747-9541.10.1.39
- Andrzejewski, M., Chmura, J., Pluta, B., Strzelczyk, R., & Kasprzak, A. (2013). Analysis of sprinting activities of professional soccer players. The Journal of Strength & Conditioning Research, 27(8), 2134–2140. https://doi.org/10.1519/JSC.0b013e318279423e
- Andrzejewski, M., Oliva-Lozano, J. M., Chmura, P., Chmura, J., Czarniecki, S., Kowalczuk, E., Rokita, A., Muyor, J. M., & Konefał, M. (2022). Analysis of team success based on match technical and running performance in a professional soccer league. BMC Sports Science, Medicine and Rehabilitation, 14(1), 1–7. https://doi.org/10.1186/s13102-022-00473-7
- Asuero, A. G., Sayago, A., & González, A. G. (2006). The correlation coefficient: An overview. Critical Reviews in Analytical Chemistry, 36(1), 41–59. https://doi.org/10.1080/10408340500526766
- Barnes, C., Archer, D. T., Hogg, B., Bush, M., & Bradley, P. S. (2014). The evolution of physical and technical performance parameters in the English premier league. International Journal of Sports Medicine, 35(13), 1095–1100. https://doi.org/10.1055/s-0034-1375695
- Beato, M., Drust, B., & Iacono, A. D. (2021). Implementing high-speed running and sprinting training in professional soccer. International Journal of Sports Medicine, 42(4), 295–299. https://doi.org/10.1055/a-1302-7968
- Brito Souza, D., López-Del Campo, R., Blanco-Pita, H., Resta, R., & Del Coso, J. (2020). Association of match running performance with and without ball possession to football performance. International Journal of Performance Analysis in Sport, 20(3), 483–494. https://doi.org/10.1080/24748668.2020.1762279
- Bujang, M. A., & Baharum, N. (2016). Sample size guideline for correlation analysis. World Journal of Social Science Research, 3(1), 37. https://doi.org/10.22158/wjssr.v3n1p37
- Castagna, C., Varley, M., Póvoas, S. C. A., & D’Ottavio, S. (2017). The evaluation of the match external load in soccer: Methods comparison. International Journal of Sports Physiology and Performance, 12(4), 490–495. https://doi.org/10.1123/ijspp.2016-0160
- Castellano, J., Alvarez-Pastor, D., & Bradley, P. S. (2014). Evaluation of research using computerised tracking systems (Amisco® and Prozone®) to analyse physical performance in elite soccer: A systematic review. Sports Medicine, 44(5), 701–712. https://doi.org/10.1007/s40279-014-0144-3
- Chmura, P., Oliva-Lozano, J. M., Muyor, J. M., Andrzejewski, M., Chmura, J., Czarniecki, S., Kowalczuk, E., Rokita, A., & Konefał, M. (2022). Physical performance indicators and team success in the German soccer League. Journal of Human Kinetics, 83(1), 257–265. https://doi.org/10.2478/hukin-2022-0099
- Clemente, F. M., Ramirez-Campillo, R., Sarmento, H., Praça, G. M., Afonso, J., Silva, A. F., Rosemann, T., & Knechtle, B. (2021). Effects of small-sided game interventions on the technical execution and tactical behaviors of young and youth team sports players: A systematic review and meta-analysis. Frontiers in Psychology, 12, 667041. https://doi.org/10.3389/fpsyg.2021.667041
- Cummins, C., Orr, R., O’Connor, H., & West, C. (2013). Global positioning systems (GPS) and microtechnology sensors in team sports: A systematic review. Sports Medicine, 43(10), 1025–1042. https://doi.org/10.1007/s40279-013-0069-2
- de Hoyo, M., Cohen, D. D., Sañudo, B., Carrasco, L., Álvarez-Mesa, A., Del Ojo, J. J., Domínguez-Cobo, S., Mañmañas, V., & Otero-Esquina, C. (2016). Influence of football match time–motion parameters on recovery time course of muscle damage and jump ability. Journal of Sports Sciences, 34(14), 1363–1370. https://doi.org/10.1080/02640414.2016.1150603
- Dellal, A., Chamari, K., Wong, D. P., Ahmaidi, S., & Keller, D. (2011). Comparison of physical and technical performance in European professional soccer match-play: The FA Premier League and La Liga. European Journal of Sport Science, 11(1), 51–59. https://doi.org/10.1080/17461391.2010.481334
- Filetti, C., Ruscello, B., D’Ottavio, S., & Fanelli, V. (2017). A study of relationships among technical, tactical, physical parameters and final outcomes in elite soccer matches as analyzed by a semiautomatic video tracking system. Perceptual and Motor Skills, 124(3), 601–620. https://doi.org/10.1177/0031512517692904
- Gualtieri, A., Rampinini, E., Dello Iacono, A., & Beato, M. (2023). High-speed running and sprinting in professional adult soccer: Current thresholds definition, match demands and training strategies. A systematic review. Frontiers in Sports and Active Living, 5(February), 1–16. https://doi.org/10.3389/fspor.2023.1116293
- Hader, K., Rumpf, M. C., Hertzog, M., Kilduff, L. P., Girard, O., & Silva, J. R. (2019). Monitoring the Athlete match response: Can external load variables predict post-match acute and residual fatigue in soccer? A systematic review with meta-analysis. Sports Medicine – Open, 5(1). https://doi.org/10.1186/s40798-019-0219-7
- Harper, D. J., Sandford, G. N., Clubb, J., Young, M., Taberner, M., Rhodes, D., Carling, C., & Kiely, J. (2021). Elite football of 2030 will not be the same as that of 2020: What has evolved and what needs to evolve? Scandinavian Journal of Medicine and Science in Sports, 31(2), 493–494. https://doi.org/10.1111/sms.13876
- Hoppe, M. W., Slomka, M., Baumgart, C., Weber, H., & Freiwald, J. (2015). Match running performance and success across a season in German Bundesliga soccer teams. International Journal of Sports Medicine, 36(7), 563–566. https://doi.org/10.1055/s-0034-1398578
- Hughes, M., Caudrelier, T., James, N., Redwood-Brown, A., Donnelly, I., Kirkbride, A., & Duschesne, C. (2012). Moneyball and soccer - an analysis of the key performance indicators of elite male soccer players by position. Journal of Human Sport & Exercise, 7(SPECIALISSUE.2), 402–412. https://doi.org/10.4100/jhse.2012.72.06
- Jamovi. (2022). The jamovi project (2.2). https://www.jamovi.org
- Julian, R., Page, R. M., & Harper, L. D. (2021). The effect of fixture congestion on performance during professional male soccer match-play: A systematic critical review with meta-analysis. Sports Medicine, 51(2), 255–273. https://doi.org/10.1007/s40279-020-01359-9
- Klingner, F. C., Huijgen, B. C. H., Den Hartigh, R. J. R., & Kempe, M. (2022). Technical–tactical skill assessments in small-sided soccer games: A scoping review. International Journal of Sports Science and Coaching, 17(4), 885–902. https://doi.org/10.1177/17479541211049532
- Kokstejn, J., Musalek, M., Wolanski, P., Murawska-Cialowicz, E., & Stastny, P. (2019). Fundamental motor skills mediate the relationship between physical fitness and soccer-specific motor skills in young soccer players. Frontiers in Physiology, 10(MAY), 1–9. https://doi.org/10.3389/fphys.2019.00596
- Kyprianou, E., DiSalvo, V., Lolli, L., Al Haddad, H., Villanueva, A. M., Gregson, W., & Weston, M. (2022). To measure peak velocity in soccer, let the players sprint. Journal of Strength and Conditioning Research, 36(1), 273–276. https://doi.org/10.1519/JSC.0000000000003406
- Lago-Ballesteros, J., & Lago-Peñas, C. (2010). Performance in team sports: Identifying the keys to success in soccer. Journal of Human Kinetics, 25(1), 85–91. https://doi.org/10.2478/v10078-010-0035-0
- Lago-Ballesteros, J., Lago-Peñas, C., & Rey, E. (2012). The effect of playing tactics and situational variables on achieving score-box possessions in a professional soccer team. Journal of Sports Sciences, 30(14), 1455–1461. https://doi.org/10.1080/02640414.2012.712715
- Lago-Peñas, C., Lorenzo-Martinez, M., López-Del Campo, R., Resta, R., & Rey, E. (2023). Evolution of physical and technical parameters in the Spanish LaLiga 2012–2019. Science and Medicine in Football, 7(1), 41–46. https://doi.org/10.1080/24733938.2022.2049980
- Lakens, D. (2022). Sample size justification. Collabra: Psychology, 8(1), 1–31. https://doi.org/10.1525/collabra.33267
- Liu, H., Hopkins, W., Gómez, A. M., & Molinuevo, S. (2013). Inter-operator reliability of live football match statistics from OPTA Sportsdata. International Journal of Performance Analysis in Sport, 13(3), 803–821. https://doi.org/10.1080/24748668.2013.11868690
- Lovell, R., Scott, D., & Park, L. (2019). Soccer velocity thresholds: Do we really know what’s best? Science and Medicine in Football, 3(1), 85–86. https://doi.org/10.1080/24733938.2019.1565361
- Malone, S., Owen, A., Mendes, B., Hughes, B., Collins, K., & Gabbett, T. J. (2018). High-speed running and sprinting as an injury risk factor in soccer: Can well-developed physical qualities reduce the risk? Journal of Science and Medicine in Sport, 21(3), 257–262. https://doi.org/10.1016/j.jsams.2017.05.016
- Massard, T., Eggers, T., & Lovell, R. (2018). Peak speed determination in football: Is sprint testing necessary? Science and Medicine in Football, 2(2), 123–126. https://doi.org/10.1080/24733938.2017.1398409
- McKay, A. K. A., Stellingwerff, T., Smith, E. S., Martin, D. T., Mujika, I., Goosey-Tolfrey, V. L., Sheppard, J., & Burke, L. M. (2022). Defining training and performance caliber: A participant classification framework. International Journal of Sports Physiology and Performance, 17(2), 317–331. https://doi.org/10.1123/ijspp.2021-0451
- Mendez-Villanueva, A., Buchheit, M., Kuitunen, S., Douglas, A., Peltola, E., & Bourdon, P. (2011). Age-related differences in acceleration, maximum running speed, and repeated-sprint performance in young soccer players. Journal of Sports Sciences, 29(5), 477–484. https://doi.org/10.1080/02640414.2010.536248
- Modric, T., Malone, J. J., Versic, S., Andrzejewski, M., Chmura, P., Konefał, M., Drid, P., & Sekulic, D. (2022). The influence of physical performance on technical and tactical outcomes in the UEFA Champions League. BMC Sports Science, Medicine and Rehabilitation, 14(1), 1–9. https://doi.org/10.1186/s13102-022-00573-4
- Moreira Praça, G., Braga Jacinto, A. L., de Sousa Pinheiro, G., de Oliveira Abreu, C., & Teoldo da Costa, V. (2023). What are the key performance indicators related to winning matches in the German Bundesliga? International Journal of Performance Analysis in Sport, 23(4), 284–295. https://doi.org/10.1080/24748668.2023.2227923
- O’Connor, F., Thornton, H. R., Ritchie, D., Anderson, J., Bull, L., Rigby, A., Leonard, Z., Stern, S., & Bartlett, J. D. (2020). Greater association of relative thresholds than absolute thresholds with noncontact lower-body injury in professional Australian rules footballers: Implications for sprint monitoring. International Journal of Sports Physiology and Performance, 15(2), 204–212. https://doi.org/10.1123/ijspp.2019-0015
- Oliva-Lozano, J. M., Fortes, V., López-Del Campo, R., Resta, R., & Muyor, J. M. (2022). When and how do professional soccer players experience maximal intensity sprints in Laliga? Science and Medicine in Football, 7(3), 288–296. https://doi.org/10.1080/24733938.2022.2100462
- Oliva-Lozano, J. M., Martínez-Puertas, H., Fortes, V., López-Del Campo, R., Resta, R., & Muyor, J. M. (2023). Is there any relationship between match running, technical-tactical performance, and team success in professional soccer? A longitudinal study in the first and second divisions of LaLiga. Biology of Sport, 40(2), 587–594. https://doi.org/10.5114/BIOLSPORT.2023.118021
- Pino-Ortega, J., Oliva-Lozano, J. M., Gantois, P., Nakamura, F. Y., & Rico-González, M. (2022). Comparison of the validity and reliability of local positioning systems against other tracking technologies in team sport: A systematic review. Proceedings of the Institution of Mechanical Engineers, Part P: Journal of Sports Engineering & Technology, 236(2), 73–82. https://doi.org/10.1177/1754337120988236
- Praça, G. M., Clemente, F. M., de Andrade, A. G. P., Morales, J. C. P., & Greco, P. J. (2017). Network analysis in small-sided and conditioned soccer games: The influence of additional players and playing position. Kinesiology, 49(2), 185–193. https://doi.org/10.26582/k.49.2.8
- Praça, G. M., De Custódio, I. J. O., & Greco, P. J. (2015). Numerical superiority changes the physical demands of soccer players during small-sided games [Superioridade numérica altera a demanda física de jogadores de futebol durante pequenos jogos]. Revista Brasileira de Cineantropometria e Desempenho Humano, 17(3), 269–279. https://doi.org/10.5007/1980-0037.2015v17n3p269
- Radziminski, L., Szwarc, A., Jastrzebski, Z., & Rzeszutko-Belzowska, A. (2022). Relationships between technical and physical match performance in elite soccer. Baltic Journal of Health and Physical Activity, 14(4), 1. https://doi.org/10.29359/BJHPA.14.4.01
- Russel, M., Sparkes, W., Northeast, J., Cook, C. J., Love, T. D., Bracken, R. M., & Kilduff, L. P. (2014). Changes in acceleration and deceleration capacity throughout professional soccer match-play. Journal of Strength and Conditioning Research, 30(10), 2839–2844. https://doi.org/10.1519/JSC.0000000000000805
- Scott, M., Scott, T. J., & Kelly, V. G. (2016). The validity and reliability of global positioning systems in team sport: A brief review. The Journal of Strength & Conditioning Research, 30(5), 1470–1490. https://doi.org/10.1519/JSC.0000000000001221
- Silva, H., Nakamura, F. Y., Beato, M., & Marcelino, R. (2022). Acceleration and deceleration demands during training sessions in football: A systematic review. Science and Medicine in Football, 7(3), 198–213. https://doi.org/10.1080/24733938.2022.2090600
- Silva, H., Nakamura, F. Y., Loturco, I., Ribeiro, J., & Marcelino, R. (2024). Analyzing soccer match sprint distances: A comparison of GPS-based absolute and relative thresholds. Biology of Sport, 41(3), 223–230. https://doi.org/10.5114/biolsport.2024.133663
- Silva, H., Nakamura, F. Y., Ribeiro, J., Asian-Clemente, J., Roriz, P., & Marcelino, R. (2023). Using minimum e ff ort duration can compromise the analysis of acceleration and deceleration demands in football. International Journal of Performance Analysis in Sport, 23(2), 125–137. https://doi.org/10.1080/24748668.2023.2201745
- Silva, H., Nakamura, F. Y., Serpiello, F. R., Ribeiro, J., Roriz, P., & Marcelino, R. (2023). Preprint adapting the percentage intensity method to assess accelerations and decelerations in football training: Moving beyond absolute and arbitrary thresholds. SportRxiv. https://doi.org/10.51224/SRXIV.286
- Small, K., McNaughton, L. R., Greig, M., Lohkamp, M., & Lovell, R. (2009). Soccer fatigue, sprinting and hamstring injury risk. International Journal of Sports Medicine, 30(8), 573–578. https://doi.org/10.1055/s-0029-1202822
- SofaScore. (n.d.). SofaScore.
- Sonderegger, K., Tschopp, M., Taube, W., & Lucía, A. (2016). The challenge of evaluating the intensity of short actions in soccer: A new methodological approach using percentage acceleration. PLOS ONE, 11(11), 1–10. https://doi.org/10.1371/journal.pone.0166534
- Stølen, T., Chamari, K., Castagna, C., & Wisløff, U. (2005). Physiology of soccer: An update. Sports Medicine, 35(6), 501–536. https://doi.org/10.2165/00007256-200535060-00004
- Sweeting, A. J., Cormack, S. J., Morgan, S., & Aughey, R. J. (2017). When is a sprint a sprint? A review of the analysis of team-sport athlete activity profile. Frontiers in Physiology, 8(JUN), 1–12. https://doi.org/10.3389/fphys.2017.00432
- Team, R. C. (2021). R: A language and environment for statistical computing (4.0). https://cran.r-project.org
- Torres-Ronda, L., Beanland, E., Whitehead, S., Sweeting, A., & Clubb, J. (2022). Tracking systems in team sports: A narrative review of applications of the data and sport specific analysis. Sports Medicine – Open, 8(1). https://doi.org/10.1186/s40798-022-00408-z
- Wrigley, R., Drust, B., Stratton, G., Scott, M., & Gregson, W. (2012). Quantification of the typical weekly in-season training load in elite junior soccer players. Journal of Sports Sciences, 30(15), 1573–1580. https://doi.org/10.1080/02640414.2012.709265