
ABSTRACT
Purpose: Youth sport (YS) is a community system for promoting children’s physical activity (PA). Studies have examined mean PA during YS practices, but few have examined inequalities in the distribution of PA among children during practice time. This study examined PA inequality in time-segmented YS practices and differences in inequality by time segment characteristics. Methods: Children’s PA and YS practices were examined using accelerometer and video observation data from a sample of YS teams (n = 36 teams, n = 101 practices) for third- through sixth-grade children (n = 392), approximately eight to 12 years old, in two rural U.S. communities. Practices were time-segmented into smaller units (episodes; n = 991). Episodes were assigned codes for purpose (e.g. warm-up), member arrangement (e.g. whole group), and setting demand (i.e. fosters participation, creates exclusion). Group accelerometer data were paired with episodes, and the Gini coefficient quantified inequality in activity counts and minutes of moderate-to-vigorous PA (MVPA). Beta generalized estimating equations examined the influence of episode structure on PA inequality. Results: Warm-up (Gini = 0.22), fitness (Gini = 0.24), and sport skill (Gini = 0.24) episodes had significantly lower inequality (p < .05) in activity counts than other purpose types. Management (Gini = 0.32) and strategy (Gini = 0.40) episodes had significantly greater inequality (p < .05) in MVPA minutes than other purpose types. Episodes fostering participation (Gini = 0.32) had significantly lower activity count inequality (p < .05) than episodes creating exclusion (Gini = 0.35). Conclusion: PA inequality among children during YS varied by practice structure. Metrics such as the Gini coefficient can illuminate inequalities in PA and may be useful for guiding efforts to improve population PA in children. Trial Registration: This study is registered at www.clinicaltrials.gov (Identifier: NCT03380143).
Improving children’s physical activity (PA) behaviors is a significant public health priority. PA is associated with numerous health benefits, including improved weight status, cardiorespiratory and muscular fitness, and reduced risk of depression (2018 Physical Activity Guidelines Advisory Committee, Citation2018; Piercy et al., Citation2018). However, in the United States (U.S.), nationally representative data indicate that only 23% of 6- to 17-year-olds meet the PA guidelines (U.S. Department of Health and Human Services, Citation2018) of accruing 60 minutes of moderate-to-vigorous physical activity (MVPA) daily (Friel et al., Citation2020). This is consistent with worldwide data indicating that only a small proportion (27%–33%) of children and adolescents globally are meeting World Health Organization PA recommendations (Aubert et al., Citation2022). PA and weight status during childhood can impact PA behavior and risk of chronic conditions, such as diabetes and heart disease, into adulthood (Reilly & Kelly, Citation2011; Telama et al., Citation2005, Citation2014), highlighting the importance of improving children’s PA to impact short- and long-term health outcomes.
Youth sport is an important avenue for promoting PA among children (International Society for Physical Activity and Health ISPAH, Citation2020; Milton et al., Citation2021; U.S. Department of Health and Human Services, Citation2019; World Health Organization, Citation2018). Over one-half of U.S. children and adolescents participate in organized sports (Black et al., Citation2022), and participation is associated with higher levels of PA and a greater likelihood of meeting PA guidelines (Hebert et al., Citation2015; Machado-Rodrigues et al., Citation2012; Marques et al., Citation2016; Vella et al., Citation2013; Wickel & Eisenmann, Citation2007). Although it is promising that sport participation positively influences children’s PA, research shows that much of youth sport practice time is spent inactive or in light activity (Cohen et al., Citation2014; Guagliano et al., Citation2013; Leek et al., Citation2011; Ridley et al., Citation2018; Sacheck et al., Citation2011; Schlechter et al., Citation2018; Wickel & Eisenmann, Citation2007). Given the reach of youth sport (Hyde et al., Citation2020), increasing PA time in this group setting has the potential to improve community population PA outcomes for children.
Youth sport practices can be conceptualized as behavior settings, or geospatially and temporally bound social and physical environments in which PA behavior occurs, and interactions within these environments produce PA outcomes (Barker, Citation1968; Barker & Gump, Citation1964). PA produced during youth sport can be examined across total practice time, defined by practice start and stop points, to understand group PA outcomes (e.g., average proportion of time spent in MVPA). However, averaging PA across the practice duration may obscure patterns of variability in group PA and social system structures resulting in high or low PA within practice time. Segmenting youth sport practice duration into smaller stable time units (labeled episodes) with defined start and stop points allows for examining PA on smaller time scales and the influence of social system structure on group PA outcomes across practice time. Extensive research has examined variability in PA by segmenting time into smaller units (Brooke et al., Citation2014). For instance, within week, children’s PA has been segmented into weekday and weekend PA to examine variability across the week (Brooke et al., Citation2016; Fairclough et al., Citation2015; Steele et al., Citation2010). Within day, children’s PA has been segmented into before-, during, and after-school (Fairclough et al., Citation2007; Lopes et al., Citation2023; McLellan et al., Citation2020; Verbestel et al., Citation2011); morning and afternoon/evening (McLellan et al., Citation2020; Schlechter et al., Citation2017); and specific lesson periods (e.g., lunch, recess) (Tudor-Locke et al., Citation2006). In youth sport observations, studies have predominantly used momentary time sampling with pre-determined time intervals (e.g., 10 second observation interval followed by a 10 second record interval) to examine PA during practice time (Carlton et al., Citation2021; Cohen et al., Citation2014; Guagliano et al., Citation2013; Shull et al., Citation2023). With this approach, PA is often reported as an average across the practice duration based on a subset of focal children. An alternative approach follows all individuals on the team to measure group-level PA outcomes and uses continuous time sampling to segment youth sport practices into smaller time units by using naturally occurring changes in the social system, such as changes in task/purpose (e.g., skill drill, fitness), to define segment start and stop points (Schlechter, Citation2018; Schlechter et al., Citation2018). Segmenting youth sport time into smaller units allows for the examination of patterns of variability in PA across time and factors influencing such variability.
Previous research has examined the influence of task/purpose, member arrangement (e.g., small group, whole group), setting demand (i.e., whether there are an equal or unequal number of opportunities to participate as children available to participate [e.g., non-elimination game versus elimination game]), coach behavior, and coach proximity on PA outcomes during youth sport practices (Carlton et al., Citation2021; Cohen et al., Citation2014; Schlechter et al., Citation2018; Shull et al., Citation2023). For instance, Cohen et al. (Citation2014) found that approximately 33% of youth soccer practice time was spent in MVPA, with MVPA highest during skill drills and fitness time. Another study examined PA during time-segmented youth flag football practices and found episodes with a purpose of free play had a greater mean percentage of time in MVPA compared to episodes with purposes of skill drill, strategy, and scrimmage (Schlechter et al., Citation2018). Thus, improving PA during youth sport requires an understanding of practice structure and the influence of structure on PA outcomes.
In addition to examining mean PA, it is necessary to investigate the distribution of PA among individuals within youth sport to strengthen understanding of group PA outcomes and within-group heterogeneity (Subramanian et al., Citation2018). Examining the distribution of PA among children within youth sport time can illuminate inequalities in PA and whether social structure, such as time segment (i.e., episode) purpose and setting demand, results in inequalities in PA or promotes PA by all children in the setting. The Gini coefficient is a common metric of distribution and inequality (Allison, Citation1978; Gini, Citation1921; Glasser, Citation1962) that may be useful for understanding the distribution of PA among children during time-segmented youth sport practices. The coefficient is derived from the Lorenz curve, which illustrates the cumulative percentage of a PA outcome, such as minutes of MVPA or activity counts, against the cumulative percentage of the population (Allison, Citation1978). The coefficient ranges from 0, perfect equality, to 1, complete inequality. Perfect equality exists when PA is equally distributed such that the first 10% of the population has 10% of the total PA (e.g., minutes or activity counts), the first 30% has 30% of the total PA, and so on, illustrated by a diagonal line called the line of equality. Inequality exists when, for example, the first 10% of the population has less than 10% of the total PA, and the Lorenz curve deviates from the line of equality (see ). Complete inequality exists when one individual has all of the PA (Glasser, Citation1962). The Gini coefficient is quantified as the percentage of the area between the line of equality and the Lorenz curve to the total area under the line of equality (Allison, Citation1978; Glasser, Citation1962).
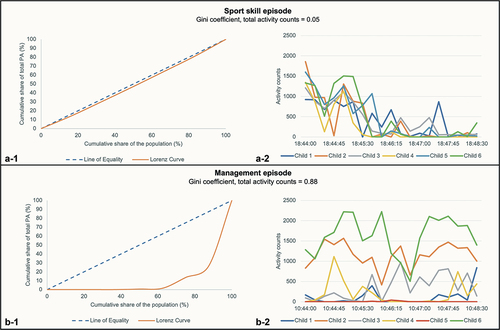
Figure 1. Inequality in children’s physical activity during one sport skill episode (a) and one management episode (b). A-1. Lorenz curve for sport skill episode. A-2. Children’s physical activity counts over time during sport skill episode. B-1. Lorenz curve for management episode. B-2. Children’s physical activity counts over time during management episode.
Only a few studies have used the Gini coefficient to investigate inequality in PA outcomes, and only one study has examined PA inequality defined by the Gini coefficient in youth sport (Althoff et al., Citation2017; Chaput et al., Citation2018; Hirata et al., Citation2020; Schlechter, Citation2018; Widyastari et al., Citation2022). Chaput and colleagues (Citation2018) utilized the Gini coefficient to conduct a country-level investigation of inequality in MVPA, sedentary, and sleep behaviors in children and found low inequality in MVPA exists at the country-level. Schlechter and colleagues (Citation2018) examined PA inequality in time-segmented youth flag football and basketball practices, and findings suggest PA inequality differed by practice time structure. For instance, time segments with a purpose of management had higher inequality than other segment purpose types, while warm-up segments had lower inequality than other segment types (Schlechter, Citation2018). To our knowledge, no other prior studies have examined the distribution of PA among children during youth sport time and how social system structure across practice time influences PA inequalities, despite numerous calls for examining the distribution of and inequalities in health-related outcomes (Krieger et al., Citation2016; National Academies of Sciences, Engineering, and Medicine, Institute of Medicine, Board on Population Health and Public Health Practice, Roundtable on Population Health Improvement, Citation2016; Widyastari et al., Citation2022; World Health Organization, Citation2014).
The Gini coefficient can be used as a metric for understanding inequality in PA during youth sport time and whether the structure of the social system promotes PA by all children or creates inequality with the accumulation of PA by a subset of children. The primary purpose of this study was to examine the influence of time-segmented episode characteristics (i.e., purpose, member arrangement, and setting demand) on PA inequality during youth sport practices. A secondary, exploratory purpose was to examine the influence of time-segmented episode characteristics on PA inequality within gender and socioeconomic status (SES) subgroups. We hypothesized that inequality in PA would differ by episode characteristics, specifically that episodes fostering inclusion (i.e., optimal setting demand) would have lower inequality than episodes fostering exclusion (i.e., disadvantaged setting demand).
Methods
Project design
This is a cross-sectional study utilizing data from Wellscapes, a hybrid effectiveness-implementation (Curran et al., Citation2012) community randomized controlled trial. Wellscapes was a two-wave staggered-start whole-of-community study focused on PA promotion in children (ClinicalTrials.gov Identifier: NCT03380143), and the present study uses data from Wave One (fall 2018 – spring 2020), in which two rural Nebraska communities with primarily Non-Hispanic White children participated. To be eligible for participation, communities needed to be in a rural area at least 10 miles from an urbanized area and have only one public high school. Study procedures were approved by the University of Nebraska Medical Center Institutional Review Board (IRB #446–18-EP, IRB #439–18-EX).
Settings and participants
We have described the settings, participants, and data collection procedures in detail elsewhere (Essay et al., Citation2023). Briefly, a sample of youth sport teams for third through sixth grade children, approximately eight to 12 years of age, from the two participating communities were recruited for participation. Any sport team in the community available for third through sixth grade children except for tackle football was eligible for participation. Due to the potential for injury, tackle football teams were excluded from participating in the Wellscapes study (Brenner et al., Citation2015; Pankow et al., Citation2022). Teams were identified through internet searching and communication with community members (Essay et al., Citation2023). Through direct communication, the research team recruited coaches of identified eligible teams to participate in video observation and accelerometer data collections during their usual team practices. Once the coach agreed to participate, all children on each participating team who were present at observed practices were eligible for video and accelerometer data collections unless they opted out of wearing an accelerometer. These data collection procedures were adopted as normal educational practice, and children’s individual data were de-identified. Thus, informed consent was not required for child participation in data collections, and accelerometer data of all children on participating youth sport teams were included in the study (Essay et al., Citation2023). Including all children on each participating team in data collection allowed for the examination of group PA outcomes and inequality among individuals during practice time. Children were recruited to provide active parent/guardian informed consent to link their accelerometer data with their name and demographic information (e.g., free/reduced lunch status) from school enrollment records. Additional details on the group and child participants are provided in a previously published protocol (Essay et al., Citation2023).
Measures
Demographics
SES was based on free and reduced lunch status from school enrollment records and was dichotomized into free/reduced and full pay status. Gender for each child was recorded as male or female. For children with parent/guardian informed consent to identify their accelerometer data, gender was based on demographic information from school enrollment records. For remaining children, gender was first based on team gender make-up for single-gender teams (i.e., all males or all females), followed by researcher observation for mixed-gender teams following previously validated observation protocols (McKenzie et al., Citation2000, Citation2006). Gender was based on researcher observation for less than 15% of observed children.
Video observation
Sport team practices were video recorded using an Apple iPad Mini 4 (Cupertino, CA, USA) with a wide-angle lens and affixed atop a tripod. The primary coach wore a microphone to capture audio. Recorded practices were then time-segmented and coded by trained research assistants according to the Geosocial Observation System (Dzewaltowski & Schlechter, Citation2017; Schlechter et al., Citation2018). Practices were segmented into naturally occurring time segments with defined start and stop points, called episodes, based on changes in purpose (e.g., skill drill, warm-up, scrimmage), location, group participants (i.e., >50% of participants change or leave), member arrangement (e.g., whole group, small group), and setting demand (i.e., optimal [an equal number of opportunities to participate as children available to participate], disadvantaged [fewer opportunities to participate than children available to participate]). Each episode time segment was assigned a code for purpose, member arrangement, and setting demand. Schlechter and colleagues (Citation2018) provide the definitions for each episode code.
Physical activity
Physical activity was measured using ActiGraph wGT3X-BT accelerometers (Pensacola, FL, USA) placed on the right hip of participating children. Consistent with recommendations for this age group (Aibar et al., Citation2014; Migueles et al., Citation2017; Trost et al., Citation2011), accelerometers were initialized to collect data in 15-second epochs, and, using a SAS macro developed by the senior author, Evenson cut-points were applied to measured activity counts to determine time spent in MVPA (≥ 2296 counts per minute) (Evenson et al., Citation2008).
Inequality in physical activity
Using Glasser’s equation (Glasser, Citation1962), a Gini coefficient was calculated for each episode to examine inequality. The coefficient ranges from 0 to 1, where 0 signifies complete equality with every individual having the same amount of PA, and 1 signifies complete inequality with one individual having all of the PA. Two Gini coefficients were calculated for each episode: 1) a Gini coefficient from total activity counts based on every child present and 2) a Gini coefficient from minutes of MVPA based on every child present. Gini coefficients were also calculated for males, females, free/reduced lunch status participants, and full pay lunch status participants for each episode to examine PA inequality within demographic subgroups.
Procedures
As part of the overall Wellscapes trial, research assistants were scheduled to attend three practices for each participating sport team each season, fall and spring, to obtain average estimates of each team’s group PA across the season (Essay et al., Citation2023). Data collection scheduling was dependent upon each team’s individual practice schedule and the availability of research assistants to travel for data collections (Essay et al., Citation2023). Thus, each team was scheduled for concurrent video observation and accelerometer data collection during three separate practices. As further described below, children in attendance at each observed practice wore accelerometers for the practice duration.
Upon arrival at each practice, research assistants set up the iPad to view the entire practice area and gave the microphone to the primary coach. Accelerometers were placed on each assenting child as they arrived, and accelerometer on-times were recorded. The entire practice duration was video-recorded, and video equipment was relocated throughout practice as needed to ensure it was recording the whole team. At the conclusion of each practice, accelerometers were retrieved from the children, and accelerometer off-times and video stop times were recorded.
Following the observation, trained research assistants time-segmented the practice routine into episodes with defined start and stop points and assigned mutually exclusive purpose, member arrangement, and setting demand codes to each episode according to the method described above. Video observation training consisted of attending a lecture, conducted by a project investigator, that described the coding process, rules, and definitions. Each research assistant then coded a minimum of three practice videos and met with the investigator to discuss accuracy and any discrepancies after completion of each video. Training was considered complete when the research assistant established 80% or greater reliability on three consecutive practice videos. Throughout data collection and observation procedures, a randomly selected subsample of 11% of each research assistant’s videos were coded by a gold standard coder, who was either a project investigator involved in the development of the observation method or a research assistant who had demonstrated consistent reliability with a project investigator, to ensure at least 80% interrater reliability was maintained. When agreement was below 80%, a third research assistant coded the video to confirm agreement was not met. The initial coder was then re-trained, and the video was re-coded by another research assistant and checked for reliability.
Statistical analysis
All analyses were conducted using SAS (Version 9.4; Cary, NC, USA). A Gini coefficient from total activity counts and from minutes of MVPA were calculated for each time-segmented episode. Therefore, each episode had values for the Gini coefficient derived from total activity counts, the Gini coefficient derived from minutes in MVPA, and the purpose, member arrangement, and setting demand codes. Prior research has suggested that Gini coefficient values below 0.3 indicate “low” inequality, between 0.3 and 0.5 indicate “medium” inequality, and 0.5 and greater indicate “high” inequality (i.e., more unequal) (Chaput et al., Citation2018).
Descriptive statistics, including means and frequencies, were used to describe practice, episode, and child participant characteristics. Descriptive means were also used to describe activity counts and MVPA minutes by episode characteristics. To address episodes of varying lengths, mean PA outcomes per minute were also examined. Beta generalized estimating equations using SAS PROC GLIMMIX with episode as the unit of analysis were used to examine the influence of episode purpose, member arrangement, and setting demand on PA inequality, defined by the Gini coefficient for total activity counts and for minutes in MVPA, respectively. Correlation and clustering for team, practice, and time segment components were addressed using a multilevel model with a random effect for practice-by-time segment nested within team. The number of participants, episode length, and sport type were used as covariates. Statistical significance was set at p < .05, and the Benjamini-Hochberg procedure was used to control for multiple comparisons and type I errors (Benjamini & Hochberg, Citation1995).
Results
Characteristics of observed youth sport teams, practices, episodes, and participants and unadjusted mean PA estimates are presented in , respectively. A total of 36 sport teams were observed, with 108 planned observations. However, due to conflicts (e.g., adult leader was sick, COVID-19 beginning in Spring 2020), 7 practices did not occur as planned. A total of 101 practices, with 991 episodes and 392 participants nested within, were observed. Practices averaged 76.0 minutes in length (standard deviation [SD] = 19.3). A mean of 9.8 (SD = 3.5) episodes were observed per practice, and the length of each episode was a mean of 7.6 minutes (SD = 8.6). As shown in , fewer episodes were examined in MVPA minute and demographic subgroup analyses due to missing Gini coefficients (e.g., no time in MVPA during episodes, no free/reduced lunch status participants present in episodes).
Table 1. Characteristics of observed teams, practices, episodes, and participants.
Table 2. Descriptive mean physical activity by episode type.
Table 3. Inequality in physical activity by episode type.
Table 4. Inequality in total activity counts by episode type for gender and socioeconomic status subgroups.
Table 5. Inequality in minutes of moderate-to-vigorous physical activity by episode type for gender and socioeconomic status subgroups.
PA inequality by episode type
Episode purpose
As shown in , PA inequality for total activity counts and MVPA minutes each differed significantly by episode purpose, with a significant main effect of episode purpose for each outcome. The estimated Gini coefficient by episode purpose ranged from 0.22 to 0.44 for total activity counts and from 0.05 to 0.40 for MVPA minutes, indicating a low- to medium-level of inequality for each outcome. For total activity counts, PA inequality was lowest during warm-up, fitness, and sport skill episodes, which had significantly lower PA inequality than game play, scrimmage, free play, strategy, management, and self-care episodes. Scrimmage episodes also had significantly lower inequality than free play, strategy, management, and self-care. Inequality in activity counts was greatest during management episodes. illustrates the Lorenz curve for activity counts for one sport skill and one management episode, as well as the activity counts across time for each child present in the episode.
For MVPA minutes, PA inequality was greatest for strategy and management episodes, which had significantly greater PA inequality than warm-up, fitness, sport skill, game play, scrimmage, free play, and self-care episodes. Consistent with inequality in activity counts, inequality in MVPA minutes was lowest during warm-up and fitness episodes. Inequality in MVPA minutes by episode type was generally lower than inequality in total activity counts, as indicated by lower Gini coefficient estimates for each purpose type.
Member arrangement
By member arrangement, Gini coefficient estimates ranged from 0.27 to 0.42 for total activity counts and from 0.01 to 0.42 for MVPA minutes, with most member arrangement types indicating a medium level of inequality for each outcome. Although the main effect of member arrangement was significant for activity counts and MVPA minutes, paired comparisons were not significant after the Benjamini-Hochberg procedure controlling for false discovery.
Setting demand
For total activity counts, episodes with optimal demand had significantly lower PA inequality than disadvantaged demand. However, inequality in MVPA minutes did not significantly differ by setting demand. Inequality in MVPA minutes by setting demand is generally lower than inequality in activity counts by setting demand.
PA inequality by episode type among demographic subgroups
Episode purpose
PA inequality by demographic subgroups for total activity counts and MVPA minutes is shown in , respectively. For each demographic subgroup, inequality in activity counts was lowest during warm-up, fitness, and sport skill episodes. Specifically, for males and full pay lunch status participants, warm-up, fitness, and sport skill episodes had significantly lower inequality in activity counts compared to scrimmage, free play, strategy, management, and self-care episodes. For females, warm-up and sport skill episodes had lower inequality in activity counts than game play, scrimmage, free play, strategy, management, and self-care episodes. For males, free/reduced lunch status participants, and full pay lunch status participants, inequality in activity counts was greatest during management episodes compared to other purpose types. For females, inequality in activity counts was greatest during free play episodes.
For each demographic subgroup, inequality in MVPA minutes was lowest in warm-up and fitness episodes compared to other purpose types. For males and full pay lunch status participants, inequality in MVPA minutes was greatest during strategy, followed by management, episodes compared to other purpose types. Among females, inequality in MVPA minutes was greatest during game play episodes, while inequality was greatest during free play and management episodes for free/reduced lunch status participants.
Member arrangement
PA inequality did not significantly differ by member arrangement for males, females, and free/reduced lunch status participants. For full pay lunch status participants, the main effect of member arrangement was significant for activity counts, but paired comparisons were not significant after the Benjamini-Hochberg procedure. Inequality in MVPA minutes was significantly greater during one-vs.-one episodes compared to solitary and whole group episodes.
Setting demand
Inequality in activity counts was significantly greater during episodes with disadvantaged setting demand compared to optimal setting demand for males. No other significant differences in inequality in activity counts or MVPA minutes by setting demand were found in demographic subgroup analyses.
Discussion
This study examined the influence of youth sport practice organized social structure on PA inequality, conceptualized as practice routines time-segmented into episode units defined by purpose, member arrangement, and setting demand, and PA outputs calculated by the Gini coefficient. Findings illustrated differences in inequality in activity counts and MVPA minutes by episode characteristics of purpose and setting demand, supporting our hypothesis. Specifically, we found that warm-up, fitness, and sport skill episodes had significantly lower inequality in activity counts and MVPA minutes than other episode purpose types. This finding was consistent in demographic subgroup analyses. We also found that inequality in activity counts was greater during episodes with disadvantaged setting demand (i.e., episodes with a fewer number of opportunities to participate than children available to participate) compared to optimal setting demand.
Several studies have examined the influence of practice structure on MVPA during youth sport practices (Carlton et al., Citation2021; Cohen et al., Citation2014; Schlechter et al., Citation2018; Shull et al., Citation2023). While Cohen et al. (Citation2014) found a higher percentage of time intervals in MVPA during skill drills and fitness time, Schlechter et al. (Citation2018) found that the percentage of time in MVPA was significantly greater in free play, warm-up, and game play compared to sport skill and fitness. Carlton et al. (Citation2021) found that game play and fitness time were associated with higher levels of PA. Previous research in other organized settings (e.g., after-school) has found that children’s MVPA is higher during free play compared to organized PA time (Ajja et al., Citation2014; Beets et al., Citation2013; Coleman et al., Citation2008; Trost et al., Citation2008), which is consistent with Schlechter et al.’s findings (Citation2018) in youth sport. The present study indicated that warm-up, fitness, and skill drill episodes had significantly lower inequality in PA compared to other episode purpose types, including significantly lower inequality compared to free play episodes. PA inequality was greatest during management and strategy episodes. Our findings are consistent with a previous study that examined PA inequality, calculated by the Gini coefficient, during recreational flag football and basketball for five- to 11-year-olds and seven- to 12-year-olds, respectively. This previous study found that inequality was lowest during warm-up and highest during management episodes (Schlechter, Citation2018). Episodes in which the adult organizes the activity, such as sport skill, may have lower but more equal PA due to the adult leader providing structure that promotes similar levels of activity among all children present in the setting. On the other hand, free play episodes, in which time is less structured and children have more autonomy, may have higher mean PA but greater inequality due to a subset of children choosing to be more active. The combination of previous research examining levels of PA and the present study examining PA inequality suggests incorporating structured and unstructured time during youth sport practices may increase the amount and equality of PA among children, although further research is needed to test this hypothesis.
Consistent with a prior study examining PA inequality in youth sport (Schlechter, Citation2018), the present study did not find significant differences in PA inequality overall by member arrangement. The absence of significant differences in PA inequality in the present study may be due to the low variability of member arrangement episodes observed in the sampled youth sport practices. Nearly 90% of observed episodes were whole group. Other previous research, which has predominantly focused on average levels of PA in youth sport, has found differences in the amount of MVPA by member arrangement. For example, Cohen et al. (Citation2014) found higher MVPA during youth soccer when children were organized in small groups and individual activities, compared to whole group and one-vs.-one activities. Additionally, principles for improving organized PA time, such as CATCH (Kelder et al., Citation2003; McKenzie et al., Citation1994) and LET US Play (Brazendale et al., Citation2015; Weaver et al., Citation2013), recommend organizing children into smaller groups, as activities in which group sizes are large can result in lower PA and reduced opportunity for all children to participate (Arnett, Citation2004; Brazendale et al., Citation2015; Kelder et al., Citation2003; Weaver et al., Citation2013). However, as average amount of PA is a different outcome than inequality in PA, the influence of youth sport routines and coach implementation of these recommended principles on inequality requires further examination.
In addition to episode purpose, PA inequality also differed by episode setting demand. Episodes that fostered participation of all children in the setting had significantly lower inequality in activity counts than episodes that created exclusion. Inequality in MVPA minutes did not differ by setting demand. This may be because inequality in activity counts included all activity, not just MVPA, and variability in activity counts among children was likely greater than variability in MVPA minutes. Barker and Gump (Citation1964) originally examined the concept of setting demand in relation to school size and suggested that schools with a greater number of opportunities to participate in activities, relative to the number of students, likely have greater overall participation. This concept has been examined in research on PA in organized settings for children, and principles for improving organized PA time recommend strategies for structuring settings to foster participation, rather than exclusion, to increase PA (Brazendale et al., Citation2015; Weaver et al., Citation2013). These strategies include eliminating the use of lines, using non-elimination games, and providing sufficient equipment (Brazendale et al., Citation2015; Weaver et al., Citation2013). Previous research has demonstrated greater mean levels of PA during setting time structured to foster participation compared to time structured to foster exclusion (Brazendale et al., Citation2015; Foster et al., Citation2010; Schlechter et al., Citation2018). Additionally, consistent with the present study, a previous study found that optimal setting demand episodes had significantly lower inequality in activity counts than disadvantaged setting demand, although inequality in MVPA minutes was not significantly different between the two demand types (Schlechter, Citation2018).
It is important to note that average amount of and inequality in the distribution of PA are different outcomes, and youth sport practice structure may influence these outcomes differently. For instance, previous studies have found greater average percent time in MVPA during free play (Schlechter et al., Citation2018), while the present study found greater PA inequality during free play compared to other purpose types. On the other hand, previous research (Schlechter et al., Citation2018) and the present study have found lower average percent time in MVPA and greater inequality, respectively, during management episodes. Additionally, inequality in MVPA minutes appears to be lower for each setting demand type than inequality in total activity counts, indicated by lower Gini coefficient estimates. Taken together, these previous and present findings suggest that lower inequality may not simply be due to lower levels of PA and that the relationship between level of and inequality in PA is likely influenced by practice structure. Further, different practice structures may result in similar group average levels of PA but different distributions of PA. For example, one soccer practice may allow all children to participate in PA, while another soccer practice allows for only a subset of children to participate in PA. Though these practices may have similar mean levels of PA, the distributions of PA among children present in each setting differ. While the mean is an important metric for understanding levels of PA, using additional metrics such as the Gini coefficient to examine the full distribution of PA among children in a setting, including non-normal distributions, can aid in more fully understanding PA outcomes during youth sport. Further research is needed to examine relationships between the amount and inequality of PA during youth sport, including whether relationships differ by youth sport practice structure.
The secondary aim of this study was to explore inequality within gender and SES subgroups by time-segmented episode characteristics. Results illustrate that PA inequality exists within demographic subgroups of males, females, free/reduced lunch status participants, and full pay lunch status participants, and that inequality differs by episode purpose. While inequality was lowest during warm-up, fitness, and sport skill episodes in subgroup analyses, consistent with overall findings, patterns of inequality appear to differ by demographic subgroup. For instance, the Gini coefficient for activity counts during game play episodes was 0.52 for males, while the coefficient was 0.13 for full pay lunch participants. Additionally, inequality in activity counts appears to be higher among males than females, indicated by larger Gini coefficients for all episode purpose types, while inequality appears to be lower among full pay lunch status participants than free/reduced lunch status participants. The differences between setting demand in inequality in activity counts was only significant for the male subgroup. Previous studies examining PA among demographic subgroups have predominantly focused on differences between subgroups, such as PA differences between males and females (Friel et al., Citation2020). The present findings show that inequalities in the distribution of PA exist within demographic subgroups, suggesting that attributing PA inequality overall to PA differences by lunch status (as a proxy for SES) and gender oversimplifies the examination of PA inequality. While this study intended to explore whether inequalities within demographic subgroups exist, examining differences between demographic subgroups is also important for fully understanding PA inequality. Although not considered in the demographic subgroup analyses due to limited data, team makeup by demographics (e.g., mixed-gender/same-gender, mixed-SES/same-SES, % low SES) is another social system factor that may influence variability in PA inequality, in addition to episode characteristics. Further research using additional inequality metrics is needed to understand whether inequality exists between subgroups such that one subgroup (e.g., males) holds more PA than another (e.g., females) in particular episode types.
The Gini coefficient is a popular metric for operationalizing inequality in the public health literature because it uses information from the entire distribution to generate a single summary statistic (De Maio, Citation2007; Trapeznikova, Citation2019). However, a limitation is that two populations or episode time segments may have different distributions of PA (i.e., different kinds of inequalities) but similar Gini coefficient values. Additionally, the Gini coefficient does not clearly separate within- and between-group inequality, and interpreting the magnitude of and differences between coefficients is challenging, as the coefficient is not expressed in natural units (e.g., in MVPA minutes) (Koolman & van Doorslaer, Citation2004). Based on the suggested cut-points for high (Gini >0.5) versus low (Gini <0.3) Gini coefficient values (Chaput et al., Citation2018), our results indicate a meaningful level of inequality during youth sport practices. However, examining relationships between PA inequality, calculated by the Gini coefficient, and other system-level outcomes (e.g., percent of children meeting PA guidelines, obesity prevalence) would advance understanding of the magnitude of inequality and its impacts on health. Numerous metrics for measuring inequality exist, including decile ratios (Gold et al., Citation2001), the Atkinson index (Atkinson & Micklewright, Citation1992), and the coefficient of variation (Champernowne & Cowell, Citation1998). Although these metrics have been found to be highly correlated with the Gini coefficient when applied to country-level step counts (Althoff et al., Citation2017), they have not been used to quantify inequality in activity counts and MVPA minutes in organized settings such as youth sport. Each inequality metric has advantages and disadvantages, and further investigation of PA inequality utilizing additional metrics, as well as other PA-related outcomes such as light PA and sedentary time, is warranted in order to more fully understand PA inequality among children.
Community and setting metrics are needed to understand population health outcomes and the social and physical conditions impacting health outcomes. The importance of collecting data on PA and inequalities to inform policy and practice efforts is increasingly being recognized (Krieger et al., Citation2016; National Academies of Sciences, Engineering, and Medicine, Institute of Medicine, Board on Population Health and Public Health Practice, Roundtable on Population Health Improvement, Citation2016; Pate et al., Citation2020; Sallis & Pate, Citation2021; World Health Organization, Citation2014). The present study illustrates the utility of the Gini coefficient as one such metric that may be useful for community and setting decision-making. By illuminating PA inequalities and the social structures that influence inequalities within and across youth sport practice time, researchers and practitioners can advance efforts to intervene upon and restructure youth sport time to promote PA for all children. Inserting time segments with more equal PA among children, such as warm-up and fitness, and reducing segments with greater inequality in PA, such as management and strategy, during youth sport time may result in greater equality of PA among children. Further, using the mean as the only metric to inform decision-making for increasing group-level PA outcomes could result in increasing PA among highly active children, while PA among less active children remains unchanged. Monitoring practice routines and PA outcomes using additional metrics that are informative about inequalities in the distribution of PA can aid in understanding how children spend their time during youth sport and highlight areas for improving both the level and equality of PA so that all children have opportunities to be active. While this study examined sport practices, it is important to note that games may result in different social structures and inequalities. As games have a different purpose (i.e., competition), practices may provide more opportunity for restructuring setting time to improve PA for population health impacts. Further, children spend much of their waking time in organized settings in addition to youth sport, including school and youth clubs, and these settings produce variable PA outcomes. A gap remains in understanding inequalities in the distribution of PA during non-sport setting time, highlighting the need to further examine inequalities in other organized settings. Incorporating data from sport and non-sport settings in community monitoring efforts is necessary for understanding social structural factors promoting and constraining PA and influencing inequalities in PA (Essay et al., Citation2023). The present study demonstrated the importance of focusing not only on mean PA within organized setting time, but also examining the distribution of PA among children within setting time to more fully understand the level and equality of PA.
Study limitations and strengths
Limitations of the current study include that youth sport teams from only five sport types, which were all ball sports, and only two rural, predominantly White, Non-Hispanic communities in Nebraska were included in the sample. This limits the generalizability of the results. Season is also important to consider, as some inequalities may exist based on the sports that were in-season at the time of data collection. However, the selected communities were representative of rural Nebraska communities, and the sport teams were sampled from the sports available for children in the communities. Although the Gini coefficient is a popular metric of inequality, the metric does not indicate where inequality occurs or whether a specific subgroup is particularly advantaged or disadvantaged in a population or episode where inequality exists. Additionally, potential inaccuracies in child gender may exist based on researcher observation. However, for nearly 90% of observed children, gender was recorded based on school enrollment demographic information or single-gender team make-up. Finally, the study did not consider whether sport teams were made up of mixed- or same-demographic participants, limiting understanding of the level of inequality within demographic subgroups. Strengths of the study include the large sample size of episodes included in the analysis. Further, we used a novel observation method with interrater reliability, as well as accelerometers for assessing PA. Finally, this is the first study to examine PA inequality overall and within demographic subgroups during time-segmented youth sport practices and the influence of time segment social structure on PA inequality.
Conclusion
While numerous studies have examined the influence of social structure on mean MVPA in organized group settings for children, few have examined inequality in the distribution of PA among children during setting time. The present study showed that PA inequality during youth sport practices differed by episode time segment social structure, both overall and within demographic subgroups. These findings highlight the importance of focusing not only on mean PA, but also on the distribution of PA among children during setting time. Future research should examine inequality in PA using additional metrics, other PA-related outcomes (e.g., light PA), and relationships between average levels of and inequality in PA to gain a greater understanding of the influence of social structure on population health PA outcomes among children. Community metrics, such as the Gini coefficient, can assist in illuminating inequalities in the distribution of PA and guide efforts for improving population PA in children.
Consent to participate
The IRB approved the collection of video observation and accelerometer data as Exempt. A waiver for informed consent to participate in data collection procedures was approved due to normal educational practice. Parents/guardians provided informed consent to link his or her child’s group setting data with their name and demographic information from school enrollment records. These procedures were approved by the IRB as minimal risk with a waiver of child assent requested.
Ethics approval
The University of Nebraska Medical Center Institutional Review Board (IRB) approved study procedures (IRB #446–18-EP, IRB #439–18-EX).
Acknowledgments
We would like to thank our community partners for participating in this study.
Disclosure statement
No potential conflict of interest was reported by the author(s).
Data availability statement
The datasets generated and analyzed during the current study are not publicly available. Following NIH and IRB data sharing policies, de-identified data will be made available after completion of the study and publication of the main findings of R01CA215420 from the PI David A. Dzewaltowski, PhD.
Additional information
Funding
References
- 2018 Physical Activity Guidelines Advisory Committee. (2018). Physical activity guidelines advisory committee scientific report [Internet]. Department of Health and Human Services. Retrieved January 12, 2021, from https://health.gov/our-work/physical-activity/current-guidelines/scientific-report
- Aibar, A., Bois, J. E., Zaragoza, J., Generelo, E., Julián, J. A., & Paillard, T. (2014, June). Do epoch lengths affect adolescents’ compliance with physical activity guidelines? The Journal of Sports Medicine and Physical Fitness, 54(3), 326–334.
- Ajja, R., Clennin, M. N., Weaver, R. G., Moore, J. B., Huberty, J. L., Ward, D. S., Pate, R. R., & Beets, M. W. (2014, December). Association of environment and policy characteristics on children’s moderate-to-vigorous physical activity and time spent sedentary in afterschool programs. Preventive Medicine, 69(Suppl 1), S49–54. https://doi.org/10.1016/j.ypmed.2014.09.010
- Allison, P. D. (1978, December). Measures of Inequality. American sociological review, 43(6), 865. https://doi.org/10.2307/2094626
- Althoff, T., Sosič, R., Hicks, J. L., King, A. C., Delp, S. L., & Leskovec, J. (2017, July 20). Large-scale physical activity data reveal worldwide activity inequality. Nature, 547(7663), 336–339. https://doi.org/10.1038/nature23018
- Arnett, M. G. (2004). Effect of team size in soccer on moderate to vigorous physical activity. Physical Educator, 61(3), 114–119.
- Atkinson, A. B., & Micklewright, J. (1992). Economic transformation in eastern europe and the distribution of income (illustrated ed.). Cambridge University Press.
- Aubert, S., Barnes, J. D., Demchenko, I., Hawthorne, M., Abdeta, C., Abi Nader, P., Adsuar Sala, J. C., Aguilar-Farias, N., Aznar, S., Bakalár, P., Bhawra, J., Brazo-Sayavera, J., Bringas, M., Cagas, J. Y., Carlin, A., Chang, C.-K., Chen, B., Christiansen, L. B., Christie, C. J. A. … Zembura, P. (2022, November 1). Global matrix 4.0 physical activity report card grades for children and adolescents: Results and analyses from 57 countries. Journal of Physical Activity and Health, 19(11), 700–728. https://doi.org/10.1123/jpah.2022-0456
- Barker, R. G. (1968). Ecological psychology: Concepts and methods for studying the environment of human behavior. Stanford University Press.
- Barker, R. G., & Gump, P. V. (1964). Big school, small school: High school size and student behavior. Stanford University Press.
- Beets, M. W., Weaver, R. G., Beighle, A., Webster, C., & Pate, R. R. (2013, August). How physically active are children attending summer day camps? Journal of Physical Activity and Health, 10(6), 850–855. https://doi.org/10.1123/jpah.10.6.850
- Benjamini, Y., & Hochberg, Y. (1995, January). Controlling the false discovery rate: A practical and powerful approach to multiple testing. Journal of the Royal Statistical Society: Series B (Methodological), 57(1), 289–300. https://doi.org/10.1111/j.2517-6161.1995.tb02031.x
- Black, L. I., Terlizzi, E. P., & Vahratian, A. (2022, August). Organized sports participation among children aged 6–17 years: United States, 2020. NCHS Data Brief, 441, 1–8. https://doi.org/10.15620/cdc:119026
- Brazendale, K., Chandler, J. L., Beets, M. W., Weaver, R. G., Beighle, A., Huberty, J. L., & Moore, J. B. (2015, July). Maximizing children’s physical activity using the LET US play principles. Preventive Medicine, 76, 14–19. https://doi.org/10.1016/j.ypmed.2015.03.012
- Brenner, J. S., LaBella, C. R., Brooks, M. A., Diamond, A., Kelly, A. K. W., LaBotz, M., Logan, K., Loud, K. J., Moffatt, K. A., Nemeth, B., Pengel, B., & Hennrikus, W. (2015, November). Council on sports medicine and fitness. Tackling in youth football. Pediatrics, 136(5), e1419–30. https://doi.org/10.1542/peds.2015-3282
- Brooke, H. L., Atkin, A. J., Corder, K., Ekelund, U., & van Sluijs, E. M. F. (2016, January). Changes in time-segment specific physical activity between ages 10 and 14 years: A longitudinal observational study. Journal of Science & Medicine in Sport, 19(1), 29–34. https://doi.org/10.1016/j.jsams.2014.10.003
- Brooke, H. L., Corder, K., Atkin, A. J., & van Sluijs, E. M. F. (2014, October). A systematic literature review with meta-analyses of within- and between-day differences in objectively measured physical activity in school-aged children. Sports Medicine, 44(10), 1427–1438. https://doi.org/10.1007/s40279-014-0215-5
- Carlton, T., McKenzie, T. L., Bocarro, J. N., Edwards, M., Casper, J., Suau, L., & Kanters, M. A. (2021, July 9). Objective assessment of physical activity and associated contexts during high school sport practices. Frontiers in Sports and Active Living, 3, 548516. https://doi.org/10.3389/fspor.2021.548516
- Champernowne, D. G., & Cowell, F. A. (1998). Economic inequality and income distribution (illustrated ed.). Cambridge University Press.
- Chaput, J. P., Barnes, J. D., Tremblay, M. S., Fogelholm, M., Hu, G., Lambert, E. V., Maher, C., Maia, J., Olds, T., Onywera, V., Sarmiento, O. L., Standage, M., Tudor‐Locke, C., & Katzmarzyk, P. T. (2018, June). Inequality in physical activity, sedentary behaviour, sleep duration and risk of obesity in children: A 12-country study. Obesity Science & Practice, 4(3), 229–237. https://doi.org/10.1002/osp4.271
- Cohen, A., McDonald, S., McIver, K., Pate, R., & Trost, S. (2014, May). Assessing physical activity during youth sport: The observational system for recording activity in children: Youth sports. Pediatric Exercise Science, 26(2), 203–209. https://doi.org/10.1123/pes.2013-0095
- Coleman, K. J., Geller, K. S., Rosenkranz, R. R., & Dzewaltowski, D. A. (2008, December). Physical activity and healthy eating in the after-school environment. The Journal of School Health, 78(12), 633–640. https://doi.org/10.1111/j.1746-1561.2008.00359.x
- Curran, G. M., Bauer, M., Mittman, B., Pyne, J. M., & Stetler, C. (2012, March). Effectiveness-implementation hybrid designs: Combining elements of clinical effectiveness and implementation research to enhance public health impact. Medical Care, 50(3), 217–226. https://doi.org/10.1097/MLR.0b013e3182408812
- De Maio, F. G. (2007, October). Income inequality measures. Journal of Epidemiology and Community Health, 61(10), 849–852. https://doi.org/10.1136/jech.2006.052969
- Dzewaltowski, D. A., & Schlechter, C. R. (2017). CLOUDEE: Child leadership observation for understanding developmental episodes and engagement. Retrieved August 17, 2022, from http://www.drdaviddzewaltowski.com/child-leadership-observation.html
- Essay, A. M., Schenkelberg, M. A., Von Seggern, M. J., Rosen, M. S., Schlechter, C. R., Rosenkranz, R. R., & Dzewaltowski, D. A. (2023). A protocol for a local community monitoring and feedback system for physical activity in organized group settings for children. Journal of Physical Activity & Health, 20(5), 385–393. https://doi.org/10.1123/jpah.2022-0486
- Evenson, K. R., Catellier, D. J., Gill, K., Ondrak, K. S., & McMurray, R. G. (2008, December). Calibration of two objective measures of physical activity for children. Journal of Sports Sciences, 26(14), 1557–1565. https://doi.org/10.1080/02640410802334196
- Fairclough, S. J., Boddy, L. M., Mackintosh, K. A., Valencia-Peris, A., & Ramirez-Rico, E. (2015, July). Weekday and weekend sedentary time and physical activity in differentially active children. Journal of Science & Medicine in Sport / Sports Medicine Australia, 18(4), 444–449. https://doi.org/10.1016/j.jsams.2014.06.005
- Fairclough, S. J., Butcher, Z. H., & Stratton, G. (2007, May). Whole-day and segmented-day physical activity variability of northwest England school children. Preventive Medicine, 44(5), 421–425. https://doi.org/10.1016/j.ypmed.2007.01.002
- Foster, K. E., Behrens, T. K., Jager, A. L., & Dzewaltowski, D. A. (2010, July). Effect of elimination games on physical activity and psychosocial responses in children. Journal of Physical Activity & Health, 7(4), 475–483. https://doi.org/10.1123/jpah.7.4.475
- Friel, C. P., Duran, A. T., Shechter, A., & Diaz, K. M. (2020, October). U.S. children meeting physical activity, screen time, and sleep guidelines. American Journal of Preventive Medicine, 59(4), 513–521. https://doi.org/10.1016/j.amepre.2020.05.007
- Gini, C. (1921, March). Measurement of inequality of incomes. The Economic Journal, 31(121), 124. https://doi.org/10.2307/2223319
- Glasser, G. J. (1962, September). Variance formulas for the mean difference and coefficient of concentration. Journal of the American Statistical Association, 57(299), 648–654. https://doi.org/10.1080/01621459.1962.10500553
- Gold, R., Kawachi, I., Kennedy, B. P., Lynch, J. W., & Connell, F. A. (2001, September). Ecological analysis of teen birth rates: Association with community income and income inequality. Matern Child Health J, 5(3), 161–167. https://doi.org/10.1023/a:1011343817153
- Guagliano, J. M., Rosenkranz, R. R., & Kolt, G. S. (2013, January). Girls’ physical activity levels during organized sports in Australia. Medicine and Science in Sports and Exercise, 45(1), 116–122. https://doi.org/10.1249/MSS.0b013e31826a0a73
- Hebert, J. J., Møller, N. C., Andersen, L. B., Wedderkopp, N., & Baker, J. L. (2015, August 11). Organized sport participation is associated with higher levels of overall health-related physical activity in children (CHAMPS Study-DK). PLOS ONE, 10(8), e0134621. https://doi.org/10.1371/journal.pone.0134621
- Hirata, R. P., Oliveira, J. M. D., Schneider, L. P., Bertoche, M. P., Rodrigues, L. A. L., Rodrigues, A., Mantoani, L. C., Hernandes, N. A., Pitta, F., & Furlanetto, K. C. (2020, December). The gini coefficient: A new approach to assess physical activity inequality in COPD. Journal of Chronic Obstructive Pulmonary Disease, 17(6), 623–626. https://doi.org/10.1080/15412555.2020.1813270
- Hyde, E. T., Omura, J. D., Fulton, J. E., Lee, S. M., Piercy, K. L., & Carlson, S. A. (2020, July 30). Disparities in youth sports participation in the U.S. 2017–2018. American Journal of Preventive Medicine, 59(5), e207–10. https://doi.org/10.1016/j.amepre.2020.05.011
- International Society for Physical Activity and Health (ISPAH). (2020, November). ISPAH’s eight investments that work for physical activity. www.ISPAH.org/Resources
- Kelder, S. H., Mitchell, P. D., McKenzie, T. L., Derby, C., Strikmiller, P. K., Luepker, R. V., & Stone, E. J. (2003, August). Long-term implementation of the CATCH physical education program. Health Education & Behavior, 30(4), 463–475. https://doi.org/10.1177/1090198103253538
- Koolman, X., & van Doorslaer, E. (2004, July). On the interpretation of a concentration index of inequality. Health Economics, 13(7), 649–656. https://doi.org/10.1002/hec.884
- Krieger, N., Waterman, P. D., Spasojevic, J., Li, W., Maduro, G., & Van Wye, G. (2016, February). Public health monitoring of privilege and deprivation with the index of concentration at the extremes. American Journal of Public Health, 106(2), 256–263. https://doi.org/10.2105/AJPH.2015.302955
- Leek, D., Carlson, J. A., Cain, K. L., Henrichon, S., Rosenberg, D., Patrick, K., & Sallis, J. F. (2011, April). Physical activity during youth sports practices. Arch Pediatr Adolesc Med, 165(4), 294–299. https://doi.org/10.1001/archpediatrics.2010.252
- Lopes, M. V. V., da Costa, B. G. G., Malheiros, L. E. A., Carvalho, H. M., Crochemore-Silva, I., & Silva, K. S. (2023, April 3). Time-segmented physical activity patterns of Brazilian adolescents: Within- and between-day variability. Measurement in Physical Education and Exercise Science, 27(2), 125–135. https://doi.org/10.1080/1091367X.2022.2102924
- Machado-Rodrigues, A. M., E Silva, M., Mota, J., Santos, R. M., Cumming, S. P., & Malina, R. M. (2012, July). Physical activity and energy expenditure in adolescent male sport participants and nonparticipants aged 13 to 16 years. Journal of Physical Activity & Health, 9(5), 626–633. https://doi.org/10.1123/jpah.9.5.626
- Marques, A., Ekelund, U., & Sardinha, L. B. (2016, February). Associations between organized sports participation and objectively measured physical activity, sedentary time and weight status in youth. Journal of Science & Medicine in Sport / Sports Medicine Australia, 19(2), 154–157. https://doi.org/10.1016/j.jsams.2015.02.007
- McKenzie, T. L., Cohen, D. A., Sehgal, A., Williamson, S., & Golinelli, D. (2006, February). System for observing play and recreation in communities (SOPARC): Reliability and feasibility measures. Journal of Physical Activity & Health, 3(s1), S208–22. https://doi.org/10.1123/jpah.3.s1.s208
- McKenzie, T. L., Marshall, S. J., Sallis, J. F., & Conway, T. L. (2000, January). Leisure-time physical activity in school environments: An observational study using SOPLAY. Preventive Medicine, 30(1), 70–77. https://doi.org/10.1006/pmed.1999.0591
- McKenzie, T. L., Strikmiller, P. K., Stone, E. J., Woods, S. E., Ehlinger, S. S., Romero, K. A., & Budman, S. T. (1994). CATCH: Physical activity process evaluation in a multicenter trial. Health Education Quarterly, 21(Suppl 2), S73–89. https://doi.org/10.1177/10901981940210s106
- McLellan, G., Arthur, R., Donnelly, S., & Buchan, D. S. (2020, March). Segmented sedentary time and physical activity patterns throughout the week from wrist-worn ActiGraph GT3X+ accelerometers among children 7-12 years old. Journal of Sport and Health Science, 9(2), 179–188. https://doi.org/10.1016/j.jshs.2019.02.005
- Migueles, J. H., Cadenas-Sanchez, C., Ekelund, U., Delisle Nyström, C., Mora-Gonzalez, J., Löf, M., Labayen, I., Ruiz, J. R., & Ortega, F. B. (2017, September). Accelerometer data collection and processing criteria to assess physical activity and other outcomes: A systematic review and practical considerations. Sports Medicine, 47(9), 1821–1845. https://doi.org/10.1007/s40279-017-0716-0
- Milton, K., Cavill, N., Chalkley, A., Foster, C., Gomersall, S., Hagstromer, M., Kelly, P., Kolbe-Alexander, T., Mair, J., McLaughlin, M., Nobles, J., Reece, L., Shilton, T., Smith, B. J., & Schipperijn, J. (2021, June 1). Eight investments that work for physical activity. Journal of Physical Activity & Health, 18(6), 625–630. https://doi.org/10.1123/jpah.2021-0112
- National Academies of Sciences, Engineering, and Medicine, Institute of Medicine, Board on Population Health and Public Health Practice, Roundtable on Population Health Improvement. (2016). Metrics that matter for population health action: Workshop summary. National Academies Press (US). https://doi.org/10.17226/21899
- Pankow, M. P., Syrydiuk, R. A., Kolstad, A. T., Hayden, A. K., Dennison, C. R., Mrazik, M., Hagel, B. E., & Emery, C. A. (2022, June). Head games: A systematic review and meta-analysis examining concussion and head impact incidence rates, modifiable risk factors, and prevention strategies in youth tackle football. Sports Medicine, 52(6), 1259–1272. https://doi.org/10.1007/s40279-021-01609-4
- Pate, R. R., Sallis, J. F., & Pollack Porter, K. M. (2020, January). Surveillance of physical activity: Actions needed to support new federal guidelines. American Journal of Public Health, 110(1), 87–89. https://doi.org/10.2105/AJPH.2019.305443
- Piercy, K. L., Troiano, R. P., Ballard, R. M., Carlson, S. A., Fulton, J. E., Galuska, D. A., George, S. M., & Olson, R. D. (2018, November 20). The physical activity guidelines for americans. JAMA, 320(19), 2020–2028. https://doi.org/10.1001/jama.2018.14854
- Reilly, J. J., & Kelly, J. (2011, July). Long-term impact of overweight and obesity in childhood and adolescence on morbidity and premature mortality in adulthood: Systematic review. International Journal of Obesity, 35(7), 891–898. https://doi.org/10.1038/ijo.2010.222
- Ridley, K., Zabeen, S., & Lunnay, B. K. (2018, September). Children’s physical activity levels during organised sports practices. Journal of Science & Medicine in Sport / Sports Medicine Australia, 21(9), 930–934. https://doi.org/10.1016/j.jsams.2018.01.019
- Sacheck, J. M., Nelson, T., Ficker, L., Kafka, T., Kuder, J., & Economos, C. D. (2011, May). Physical activity during soccer and its contribution to physical activity recommendations in normal weight and overweight children. Pediatric Exercise Science, 23(2), 281–292. https://doi.org/10.1123/pes.23.2.281
- Sallis, J. F., & Pate, R. R. (2021, August 1). Creating the future of physical activity surveillance in the United States: Better data for better health. Journal of Physical Activity & Health, 18(S1), S1–5. https://doi.org/10.1123/jpah.2021-0182
- Schlechter, C. R. (2018). The social contexts of youth settings for influencing physical activity [Internet] [ Doctoral dissertation]. Kansas State University. Retrieved May 16, 2023, from http://hdl.handle.net/2097/39124
- Schlechter, C. R., Guagliano, J. M., Rosenkranz, R. R., Milliken, G. A., & Dzewaltowski, D. A. (2018, February 8). Physical activity patterns across time-segmented youth sport flag football practice. BMC Public Health, 18(1), 226. https://doi.org/10.1186/s12889-018-5108-3
- Schlechter, C. R., Rosenkranz, R. R., Fees, B. S., & Dzewaltowski, D. A. (2017). Preschool daily patterns of physical activity driven by location and social context. The Journal of School Health, 87(3), 194–199. https://doi.org/10.1111/josh.12486
- Shull, E. R., McIver, K., McLain, A. C., Monsma, E., & Pate, R. R. (2023, July 19). Factors associated with children’s physical activity during youth soccer practices. Research Quarterly for Exercise and Sport, 1–7. https://doi.org/10.1080/02701367.2023.2225563
- Steele, R. M., van Sluijs, E. M., Sharp, S. J., Landsbaugh, J. R., Ekelund, U., & Griffin, S. J. (2010, December 9). An investigation of patterns of children’s sedentary and vigorous physical activity throughout the week. The International Journal of Behavioral Nutrition and Physical Activity, 7(1), 88. https://doi.org/10.1186/1479-5868-7-88
- Subramanian, S. V., Kim, R., & Christakis, N. A. (2018, April 19). The “average” treatment effect: A construct ripe for retirement. A commentary on Deaton and Cartwright. Social Science & Medicine, 210, 77–82. https://doi.org/10.1016/j.socscimed.2018.04.027
- Telama, R., Yang, X., Leskinen, E., Kankaanpää, A., Hirvensalo, M., Tammelin, T., Viikari, J. S. A., & Raitakari, O. T. (2014). Tracking of physical activity from early childhood through youth into adulthood. Medicine and Science in Sports and Exercise, 46(5), 955–962. https://doi.org/10.1249/MSS.0000000000000181
- Telama, R., Yang, X., Viikari, J., Välimäki, I., Wanne, O., & Raitakari, O. (2005, April). Physical activity from childhood to adulthood: A 21-year tracking study. American Journal of Preventive Medicine, 28(3), 267–273. https://doi.org/10.1016/j.amepre.2004.12.003
- Trapeznikova, I. (2019). Measuring income inequality. IZA World of Labor. https://doi.org/10.15185/izawol.462
- Trost, S. G., Loprinzi, P. D., Moore, R., & Pfeiffer, K. A. (2011, July). Comparison of accelerometer cut points for predicting activity intensity in youth. Medicine and Science in Sports and Exercise, 43(7), 1360–1368. https://doi.org/10.1249/MSS.0b013e318206476e
- Trost, S. G., Rosenkranz, R. R., & Dzewaltowski, D. (2008, April). Physical activity levels among children attending after-school programs. Medicine and Science in Sports and Exercise, 40(4), 622–629. https://doi.org/10.1249/MSS.0b013e318161eaa5
- Tudor-Locke, C., Lee, S. M., Morgan, C. F., Beighle, A., & Pangrazi, R. P. (2006, October). Children’s pedometer-determined physical activity during the segmented school day. Medicine and Science in Sports and Exercise, 38(10), 1732–1738. https://doi.org/10.1249/01.mss.0000230212.55119.98
- U.S. Department of Health and Human Services. (2018). Physical activity guidelines for Americans (2nd ed.). U.S. Department of Health and Human Services.
- U.S. Department of Health and Human Services. (2019). The national youth sports strategy. U.S. Department of Health and Human Services.
- Vella, S. A., Cliff, D. P., Okely, A. D., Scully, M. L., & Morley, B. C. (2013, October 2). Associations between sports participation, adiposity and obesity-related health behaviors in Australian adolescents. The International Journal of Behavioral Nutrition and Physical Activity, 10(1), 113. https://doi.org/10.1186/1479-5868-10-113
- Verbestel, V., Van Cauwenberghe, E., De Coen, V., Maes, L., De Bourdeaudhuij, I., & Cardon, G. (2011, August). Within- and between-day variability of objectively measured physical activity in preschoolers. Pediatric Exercise Science, 23(3), 366–378. https://doi.org/10.1123/pes.23.3.366
- Weaver, R. G., Webster, C., & Beets, M. W. (2013, November). LET US Play: Maximizing physical activity in physical education. Strategies, 26(6), 33–37. https://doi.org/10.1080/08924562.2013.839518
- Wickel, E. E., & Eisenmann, J. C. (2007, September). Contribution of youth sport to total daily physical activity among 6- to 12-yr-old boys. Medicine and Science in Sports and Exercise, 39(9), 1493–1500. https://doi.org/10.1249/mss.0b013e318093f56a
- Widyastari, D. A., Khanawapee, A., Charoenrom, W., Saonuam, P., & Katewongsa, P. (2022, August 31). Refining index to measure physical activity inequality: Which group of the population is the most vulnerable? International Journal for Equity in Health, 21(1), 123. https://doi.org/10.1186/s12939-022-01725-1
- World Health Organization. (2014). Monitoring health inequality: An essential step for achieving health equity. Retrieved November 23, 2021, from http://apps.who.int/iris/bitstream/10665/164530/1/WHO_HIS_HSI_2015.1_eng.pdf?ua=1&ua=1
- World Health Organization. (2018). Global action plan on physical activity 2018–2030: More active people for a healthier world (1st ed.). World Health Organization.