
ABSTRACT
Purpose: This study addresses the lack of objective player-based metrics in men’s rugby league by introducing a comprehensive set of novel performance metrics designed to quantify a player’s overall contribution to team success. Methods: Player match performance data were captured by Stats Perform for every National Rugby League season from 2018 until 2022; a total of five seasons. The dataset was divided into offensive and defensive variables and further split according to player position. Five machine learning algorithms (Principal Component Regression, Lasso Regression, Random Forest, Regression Tree, and Extreme Gradient Boost) were considered in the analysis, which ultimately generated Wins Created and Losses Created for offensive and defensive performance, respectively. These two metrics were combined to create a final metric of Net Wins Added. The validity of these player performance metrics against traditional objective and subjective measures of performance in rugby league were evaluated. Results: The metrics correctly predicted the winner of 80.9% of matches, as well as predicting the number of team wins per season with an RMSE of 1.9. The metrics displayed moderate agreement (Gwet AC1 = 0.505) when predicting team of the year award recipients. When predicting State of Origin selection, the metrics displayed moderate agreement for New South Wales (0.450) and substantial agreement for Queensland (0.652). Conclusion: The development and validation of these objective player performance metrics represent significant potential to enhance talent evaluation and player recruitment.
The methods used to objectively evaluate player performance in team sporting competitions have evolved over time; from simple statistics such as box-scores (e.g. Goals, Assists, Hits) to more advanced metrics (e.g. Offensive Rating, Wins Above Replacement, Expected Goals) (Watanabe et al., Citation2021). Generally, these metrics were created to assist teams with talent identification and player market value (Apostolou & Tjortjis, Citation2019). There have been several metrics that value the overall contribution of an individual to the success of their team in sports such as American football (e.g. Quarterback Rating) (Hughes et al., Citation2015; Oliver, Citation2011; Yurko et al., Citation2018), Australian football (e.g. AFL Player Rating) (Robertson et al., Citation2016; Sargent & Bedford, Citation2013), baseball (e.g. Runs Created) (Baumer et al., Citation2013; Slowinski, Citation2010), basketball (e.g. True Shooting Percentage) (Hoffer & Pincin, Citation2020; Oliver, Citation2004) and ice hockey (e.g. Expected Goals) (Shea & Baker, Citation2012). Popularized in baseball, one of the more prominent advanced metrics used, Wins Above Replacement (WAR), calculates how many extra wins a player can earn their team compared to a player who is considered “league-average” (known as a “replacement level” player) (Slowinski, Citation2010). The WAR is seen as an important indicator to inform recruitment and contract extensions to help maintain and increase team success (Simsek et al., Citation2020).
Rugby league is a team invasion sport played primarily in Australia, New Zealand, and the United Kingdom, the ultimate aim of which is to score more points than their opponents (Woods et al., Citation2018). Points are scored through a “try” (placement of the ball on the ground inside the opponent’s goal area), worth four points, as well as “conversions,” which accompany a try or can also be scored as a result of a penalty and involves the act of kicking the ball through goalposts, worth two points. There is a noticeable absence of objective player-based metrics (Carbone et al., Citation2016). Common methods used to evaluate player performance in the National Rugby League (NRL) and the English Super League (ESL) competitions currently involve subjective methodologies such as scouting, video analysis, and coach opinion (Bennett et al., Citation2016). Subjective methods are also used to choose the “best” player of a respective season and the corresponding “team of the year” in the NRL (National Rugby League, Citation2022a, Citation2022b), as well as representative team selection such as State of Origin or the World Cup (National Rugby League, Citation2012). The lack of objective player performance metrics in the NRL is noteworthy given the presence of a salary cap, which prevents a club from exerting their superior financial leverage over clubs with more limited resources with the aim of creating a more even playing field (Davies, Citation2006). Therefore, the aims of this study were to: (1) create a collection of metrics that quantify the overall contribution of a player to the success of their team, in a way that can contextually explain these contributions and (2) evaluate the validity of these player performance metrics against traditional objective and subjective measures of performance. The development of these metrics can assist with the discovery of players that have made strong contributions to team success despite being overlooked by media, recruitment staff, and other expert opinion. Ideally, this would be in a similar vein to the Oakland Athletics baseball club from 2002 to 04 (Lewis, Citation2004) or association football clubs Olympique Lyon in the 2000s and Nottingham Forest in the late 1970s (Kuper & Szymanski, Citation2022); however, this is performed within the confines of a rugby league context. The implementation of these metrics would ideally complement expert opinion (rather than replace it) to enhance decision-making about player selection and recruitment.
Methods
This research was approved by the University of Canberra Human Research Ethics Committee (Project ID: 9274). Player match performance data were captured by Stats Perform (statsperform.com) for every National Rugby League season from 2018 to 2022; a total of five seasons. The player data were presented per match. The total number of matches used in the analysis was 928 (mean = 42 matches per player, range = 1–113, SD = 32.4). The number of samples per playing position can be found in . The dataset was divided into offensive and defensive variables. The list of variables for each dataset is presented in Supplementary Table S1. The dataset only included data from 2018 to 2022 to offset any potential effects due to rule changes, natural evolution of the game, and lack of sufficient data. The response variable “Points Scored” was created by summing the total points scored by each player (i.e. tries conversions) for each team in each game. Likewise, the response variable “Points Conceded” was created by subtracting the total points scored by the players corresponding team from the total points scored by both teams. Next, the players were grouped according to player position denoted by the data providers in the dataset (fullback, wing, center, five-eighth, halfback, prop, hooker, second row, lock, and interchange) for a particular game. The segregation by player position was necessary as each position has a distinct role, set of attributes, and expectations. For example, a halfback or five-eighth is expected to perform more play-making actions like kicking and try or line-break assists, whereas a prop would be expected to perform more defensive duties such as tackling, as well as taking several “hit-ups” and “making metres” on offense.
Next, each of the positional datasets was used to model team points scored using the offensive predictors, and team points conceded were modeled using the defensive predictors. Five machine learning algorithms were considered: 1) Principal Component Regression (a process that combines linear regression and the gathering of correlated variables into principal components (Liu et al., Citation2003)), 2) Regression Decision Tree (which evaluates each variable to find optimal cutoff values and splits the data according to these values (Gifford & Bayrak, Citation2023)), 3) Random Forest (which aggregates a large number of decision trees to provide an optimal result (Weiwei, Citation2022)), 4) Lasso Regression (which reduces the weight of variables deemed of lesser influence and importance (Yigit et al., Citation2020)) and 5) an Extreme Gradient Boost (which creates an ensemble of decision trees aiming to reduce the predictive error with each new addition (Ma et al., Citation2023)). These models were chosen as they have been commonly used in sports analytics research (Chmait & Westerbeek, Citation2021). The best performing model for each position and response variable was determined using the lowest root mean squared error (RMSE) via a 10-fold cross-validation, which was then used for the player evaluation.
To evaluate player performance, the player statistics for each team in each game were summed (to create overall team statistics per game). The player statistics were then divided by the team statistics to calculate an adjusted contribution value (e.g., if a player’s total run meters were 200 m, and the team’s total run meters were a total of 2000 m, the value for the player would be 0.1, i.e., the player has contributed 10% of the team’s total run meters). The selected models were then applied to these adjusted values to predict the number of points that would have been created and surrendered by an individual player in the hypothetical scenario that every player on the field was that individual. These metrics are called Points Created (PC) and Points Surrendered (PS), respectively. Stemming from these metrics, the mean points per game for each position were calculated for both PC and PS, and these values were then converted to win and loss values, respectively. These win and loss values were calculated by multiplying the mean positional PC per game by 2. This calculation is based on the estimation of the number of points a team (or in this case, player) will need to create to win approximately one game. The same method was applied to estimate the number of points surrendered by a team to amount to one loss.
Once the per game win and loss values were estimated, five further metrics were created. Points Created Above Mean (PCAM) determined the amount of points a player has created above the average PC value for the position they played in a game; Points Surrendered Above Mean (PSAM) was calculated in a similar way, as it refers to the number of points a player has theoretically conceded compared to the average for a player in that position. The creation of these mean-based metrics enabled a way for players of different positions to be compared based on their performance. The remaining three metrics, which were derived from PCAM and PSAM, were named Wins Created (WC), Losses Created (LC), and Net Wins Added (NWA). Wins Created was calculated by dividing the PCAM for a player in a game by the win value for that position. Similarly, LC was calculated by dividing the PSAM for a player in a game by the loss value for that position. Finally, NWA was calculated by subtracting LC from WC, giving the total estimation of the contribution by the player in a game toward an expected win. A depiction of this process is provided in , and examples of these calculations are provided in .
Figure 1. Flow chart of the metric creation process. PPG: Points per Game.
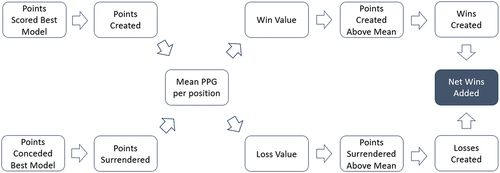
Table 1. Example calculations of match contributions. It shows two players who play different positions. Due to their positional expectations they have different Points Created/Surrendered and therefore their positional mean Points Created/Surrendered and Win/Loss Value is also different. By calculating each players’ Points Created/Surrendered Above Mean, the amount of wins/losses a player creates/surrenders in a particular game can be calculated and therefore the Net Wins a player adds in that particular game.
The validation of the metrics was conducted against three indicators of performance currently used in the NRL: (1) The total number of wins for each team in each season from 2018 to 2022, (2) the end of year player awards known as the “Dally M Team of the Year” from 2018 to 2022, and (3) the 2018–2022 State of Origin representative team selection. The “Dally M Team of the Year” is determined by independent, anonymous judges from a pool of former players, who vote on the best players in each position across several timepoints throughout the regular season (Fox Sports, Citation2023). In State of Origin, three state representative games are contested by New South Wales and Queensland and played in the middle of the regular NRL season. The coach of each state is advised by a selection panel but ultimately makes the final decision on selecting the best performing eligible players. To be eligible for state selection, a player must have played their first junior football in that state (although there are some exceptions such as which state a family member played for) (National Rugby League, Citation2012).
To validate the metrics against the total number of actual wins for each team in each season, the total expected team wins were calculated by using the total team NWA in each game, whereby the team with the greater NWA received a “win,” and the other team received a “loss.” The total expected wins according to NWA were then compared against the actual wins achieved by a team in a season by calculating the root mean squared error (RMSE).
To validate the metrics against the actual Dally M Team of the Year, the predicted Dally M Team of the Year was chosen according to the highest total NWA for the season in each position. In positions where there are two players required (Wing, Centre, Prop, 2nd Row) the two highest NWA totals were selected. The predicted Dally M Team of the Year was compared against the actual Dally M Team of the Year for the given season by calculating the Gwet’s AC1 statistic, an alternative to Cohen’s Kappa when determining inter-rater agreement in the instance where one rater is constant (Gwet, Citation2008). The proposed benchmarking guidelines to determine agreement levels are sourced from Landis and Koch (Citation1977) and are as follows: perfect (0.81–1.00), substantial (0.61–0.80), moderate (0.41–0.60), fair (0.21–0.40), and slight (0–0.20). Statistical significance was accepted at the p < .05 level.
To validate the metrics against State of Origin representative selection, the expected State of Origin teams were chosen according to the NWA per game for a player in a specific position, having met the eligibility criteria that a player must have played in at least half of their teams’ total games. This minimum number is used as a guide and was derived from the Pro Football Reference per-game requirements to qualify for per-game statistics in the NFL (Pro Football Reference, Citation2021). Other criteria included Origin eligibility, i.e., only players who were eligible to play for either New South Wales or Queensland were included for selection. The information on season team wins was sourced from Dollin et al. (Citation2023), Dally M Team of the Year winners from Dollin et al (Citation2018a, Citation2019a, Citation2020a, Citation2021a, Citation2022a), and State of Origin team selections from Dollin et al (Citation2018b, Citation2019b, Citation2020b, Citation2021b, Citation2022b). The final algorithms chosen for each position and response and their corresponding RMSE are shown in .
Table 3. Descriptive statistics included for each position in the analysis.
Table 2. Final algorithms chosen for each position and response with corresponding RMSE, (smaller is better).
The analysis was conducted using version 4.2.2 of the R programming language (R Core Team, Citation2022) in version 2023.09.0 + 463 of RStudio (RStudio Team, Citation2023). The R packages and versions used for the analysis were tidyverse 2.0.0 (Wickham, Citation2023), caret 6.0–94 (Kuhn, Citation2023), glmnet 4.1–7 (Hastie, Citation2023), e1071 1.7–13 (Meyer, Citation2023), GGally 2.1.2 (Schloerke, Citation2021) and rattle 5.5.1 (Williams, Citation2022).
Results
Team wins in a season
Of the 928 matches, 925 had a definitive winner and loser (i.e. the match didn’t end in a draw). The model accurately predicted the winner of the match in 748 of those matches (accuracy = 80.9%). depicts the distribution of the difference between the number of games a team was expected to win according to the models and the actual number of games the team won in each season between 2018 and 2022. The majority (62.5%) of instances fell within 1 win of the actual games won, and the RMSE for this comparison was 1.9, suggesting strong agreement between the expected result and the actual result. shows the relationship between the actual wins and expected wins.
Figure 2. Distribution of differences between expected wins and actual wins for NRL seasons 2018–2022.
Figure 3. Relationship between the number of expected wins and the number of actual wins for the NRL seasons 2018–2022. The dashed line is a reference line to show where points would fall if the expected wins were equal to the actual wins. Points below the reference line indicate that the model over-estimated the expected wins, and points above the reference line indicate that the model under-estimated the expected wins.
Dally M Team of the Year
shows the distribution of Dally M Team of the Year recipients and their actual finishing position when using season total Net Wins Added. The top 3 players were used as the benchmark as there are generally three nominees per positional slot (National Rugby League, Citation2023). Thirty-one of the 57 award recipients were expected to be in the top 3 in their respective positions, with a Gwet’s AC1 value of 0.505 (p < .001), suggesting “moderate agreement.” Overall, 54.4% of award winners finished in the expected Top 3, with 66.7% expected to finish in the top 5 players in their respective position.
Figure 4. Dally M Team of the Year award recipients and their expected finish among positional rivals according to Net Wins Added for NRL seasons 2018–2022.
State of Origin selection
shows the comparison between State of Origin team selections for both New South Wales and Queensland in terms of their expected ranking at the time of selection when considering the player’s Net Wins Added per game. About 49.4% of New South Wales selections were expected to be in the top 3 choices to play in that position, with 68.6% expected to be in the top 5. The Gwet’s AC1 coefficient for New South Wales was 0.45 (p < .001), indicating “moderate agreement” between the expected and actual ranking. In comparison, 69.9% of Queensland selections were expected to be among the top 3 candidates for selection, with 86.5% expected to be in the top 5. The Gwet’s AC1 coefficient for Queensland was 0.652 (p < .001), suggesting “substantial agreement.”
Figure 5. Expected ranking range of State of Origin team selection base on Net Wins Added per game for NRL seasons 2018–2022.
Discussion
This study aimed to objectively quantify the overall contribution of a rugby league player to the success of their team through the creation of a collection of novel metrics. The validity of these metrics was then evaluated against traditional indicators of player performance. On average, the metrics predicted a team’s win total within two wins in a given season. The metrics also successfully identified 54.4% of the Dally M Team of the Year award recipients, with a moderate level of agreement. In relation to State of Origin, the metrics accurately predicted 59.65% of players who would be among the leading contenders for representative selection. The level of agreement was substantial, especially for the Queensland team.
It was noticeable that predicting team wins per season demonstrated the strongest correlation between the created metrics and overall performance when compared to the other forms of validation in this study. At the end of a game, the result is mostly binary—a win or a loss. The small margin of error being less than two wins indicates that teams mostly win when they have more favorable performance statistics whilst allowing for exceptions. For example, a team could be camped on their own defensive line and performing a lot of defensive duties. Theoretically, they would not be creating points as they were not performing in an offensive capacity at this stage. However, the defensive team could score points from an intercept try which would not be accurately reflected in the metrics as it would be considered points scored “against the run of play.” This could be compared to a team dominating possession in association football but conceding a goal due to a rapidly executed counterattack.
The Dally M Team of the Year predictions performed pretty consistently across each position, with notable exceptions being the five-eighth and lock positions. The nominee for lock of the year finished among top 3 in only one of the five seasons analyzed, while the opposite was true for the five-eighth, finishing outside the top 3 only once. There are a couple of possible reasons for this. For example, a five-eighth makes up half of the main playmaking duo (alongside the halfback), and generally one or both are required to play well for a team to have success. By playing well and ensuring victory for their team, the five-eighth would be more prone to “stand out” than a wingerfor example, when applying this same rhetoric to a position like lock forward, the criteria become less clear. A lock is expected to contribute in different ways to a halfback in both attack and defense, which could skew the overall metric value. This is especially true when valuing a player’s contributions at exactly 50:50 between attack and defense to get an overall win contribution. It could be suggested that because defense doesn’t directly score you points it should be valued less than offensive contributions. The ideal weighting of attack and defense should be considered in future iterations of this metric creation process.
In relation to State of Origin team selection, the level of agreement was significantly higher for Queensland than for New South Wales. An explanation for this could be due to a smaller selection pool for Queensland. Until the Dolphins joined the competition for the 2023 season, 25% of NRL teams were based in Queensland (including the Melbourne Storm, who have feeder clubs based primarily in Queensland). This provides fewer opportunities for prospective Queenslanders to get the necessary game time to play at a level considered suitable for representative selection and may lead to lower caliber players representing Queensland in theory. On a more positive note, the smaller selection pool means that there is a lower likelihood to make the “wrong” choice about player selection, as opposed to the plethora of eligible players for New South Wales to choose from. This is exacerbated by the fact that Queensland won 40% of series held during the years included in this study and 14 of the last 18 since 2006.
The development and validation of these metrics can have significant implications for player evaluation in rugby league. They provide a more objective and data-driven approach to assessing player performance, allowing teams to make more informed decisions in talent identification and recruitment. By using these metrics, teams can identify players who may be making substantial contributions to team success but are overlooked by traditional methods. This is particularly important in leagues with a salary cap, where making efficient use of resources is crucial for maintaining competitiveness. These metrics also recognized the importance of providing context to player contributions and accounted for the distinct roles and expectations associated with different positions. Thus, ensuring that players are evaluated based on their specific contributions within the team’s dynamics. This contextual understanding is essential to enhance decision-making rather than completely replace expert opinions.
However, there are some limitations to this study that could be improved upon in future iterations of these metrics. Due to limitations with the available dataset, minutes spent on-field were not considered in these calculations. This reduced the differentiation of players who have spent different amounts of time on the field but contributed similarly over the course of a match. In future iterations, this could certainly be accounted for provided the data was available. During the model development, some of the variables that were included in the Lasso regression as features resulted in counter-intuitive model coefficients. For example, according to the model coefficients a second rower would surrender points for their team every tackle they made (+0.013), and a lock would be costing their team points when successfully completing an offload (−0.075). More “made” tackles for a team typically means that a team spends longer periods of the game in defense, and thus leads to more points being conceded (because the other team has the ball). When applying this reasoning to the player-based metrics, a player could be penalized for making more “made” tackles as it statistically relates to surrendered points, even though making tackles is important to prevent points from being conceded. However, this also holds true when the alternative to making a tackle is missing a tackle, which would lead to more points being conceded in a real-world context. On the offensive side, a completed offload is generally perceived as a positive action, as it ensures that the play continues and gives a higher probability for a team to gain a point scoring opportunity in theory. The implication by the chosen model that this is a negative action is noteworthy and should be investigated, as whilst in theory an offload is a perceived positive, certain contexts may actually determine it as a negative, as sometimes it may be better to hold on to the ball to allow the offensive team to generate a more stable attacking shape.
Another limitation involved the categorization of all Interchange players in the same group, operating under the (incorrect) assumption that all Interchange players have the same positional expectations when they eventually take the field. A solution to this could be to predict what role they played during the game when comparing their match statistics against those of the starters. Once that is developed, starters will be able to be compared to nonstarters in their perceived on-field positions. This can then lead to improved team selection practices, as bench players with higher Net Wins Added than their starting counterparts could potentially graduate to a starting role based on their performances.
Another limitation of this study was the assumption that every team’s schedule was considered as being of identical difficulty as the rest of the league. In the NRL, this is not the case. There were 16 teams in the competition in the seasons analyzed, and for every team to play each other at each other’s home ground would mean that there would be 30 games played per team. However, there are only 24 games played per team per season. Therefore, some teams may have had “easier” schedules than others (e.g., where one team might have only played the highest ranked team once rather than twice in a season, whereas another team might have played the highest ranked team twice), which can lead to the skewing of performance metrics. An improvement that could be made to the next iteration of these metrics would be the introduction of a “Strength of Schedule” multiplier. This would in effect reward players who play better against stronger teams over players who play well against weaker teams and give an indication about the players that have consistent performances regardless of who the opposition is.
Finally, this study developed metrics that can be implemented in men’s rugby league only based on the model training data being sampled from the men’s NRL. As the women’s game continues to grow it is also important that elite women’s rugby league competitions have a similar level of analysis and scrutiny, and future research should aim to develop specific metrics for women’s rugby league players.
Conclusion
The development and validation of objective player performance metrics in rugby league represents a step forward in the sport’s evolution. These metrics offer an accurate and data-driven approach to player evaluation and have demonstrated their validity in predicting team success and individual accolades. The use of such metrics has the potential to improve talent identification and decision-making processes in rugby league, providing a more level playing field for all teams and players. Further research and implementation of these metrics in the sport could bring a new era of objective player assessment and enhance the overall quality of competition in rugby league. This further research provides more intuitive models, positional prediction of nonstarters, and implementing modifiers based on strength of schedule.
Supplementary Table S1
Download MS Word (14.6 KB)Acknowledgments
The authors acknowledge Stats Perform, who collected the raw data used in this study, and the Canberra Raiders National Rugby League club, who provided access to these data via a data sharing agreement.
Disclosure statement
No potential conflict of interest was reported by the author(s).
Data availability statement
Due to the ethical and legal restrictions outlined in the above data sharing agreement supporting data is not available.
Supplementary material
Supplemental data for this article can be accessed online at https://doi.org/10.1080/02701367.2024.2373124.
Additional information
Funding
References
- Apostolou, K., & Tjortjis, C. (2019, July 15–17). Sports analytics algorithms for performance prediction. In 2019 10th International Conference on Information, Intelligence, Systems and Applications (IISA) (pp. 1–4).
- Baumer, B. S., Jensen, S. T., & Matthews, G. J. (2013). openWAR: An open source system for evaluating overall player performance in major league baseball. Journal of Quantitative Analysis in Sports, 11(2), 69–84. https://doi.org/10.1515/jqas-2014-0098
- Bennett, K. J. M., Fransen, J., Scott, B. R., Sanctuary, C. E., Gabbett, T. J., & Dascombe, B. J. (2016). Positional group significantly influences the offensive and defensive skill involvements of junior representative rugby league players during match play. Journal of Sports Sciences, 34(16), 1542–1546. https://doi.org/10.1080/02640414.2015.1122206
- Carbone, J., Corke, T., & Moisiadis, F. (2016). The rugby league prediction model: Using an elo-based approach to predict the outcome of national rugby league (NRL) matches. International Educational Scientific Research Journal, 2(5), 26–30. doi:10.21276/2455-295X
- Chmait, N., & Westerbeek, H. (2021). Artificial intelligence and machine learning in sport research: An introduction for non-data scientists. Frontiers in Sports and Active Living, 3, 363. https://doi.org/10.3389/fspor.2021.682287
- Davies, C. (2006). The use of salary caps in professional team sports and the restraint of trade doctrine. Journal of Contract Law, 22(3), 246–267. doi:10.3316/agispt.20064113
- Dollin, S., Ferguson, A., & Bates, B. (2018a). Calendar - 2018 awards [Online]. https://www.rugbyleagueproject.org/calendar/2018/awards.html
- Dollin, S., Ferguson, A., & Bates, B. (2018b). State of origin 2018 [Online]. https://www.rugbyleagueproject.org/competitions/state-of-origin-2018/summary.html
- Dollin, S., Ferguson, A., & Bates, B. (2019a). Calendar - 2019 awards [Online]. https://www.rugbyleagueproject.org/calendar/2019/awards.html
- Dollin, S., Ferguson, A., & Bates, B. (2019b). State of origin 2019 [Online]. https://www.rugbyleagueproject.org/competitions/state-of-origin-2019/summary.html
- Dollin, S., Ferguson, A., & Bates, B. (2020a). Calendar - 2020 awards [Online]. https://www.rugbyleagueproject.org/calendar/2019/awards.html
- Dollin, S., Ferguson, A., & Bates, B. (2020b). State of origin 2020 [Online]. https://www.rugbyleagueproject.org/competitions/state-of-origin-2020/summary.html
- Dollin, S., Ferguson, A., & Bates, B. (2021a). Calendar - 2021 awards [Online]. https://www.rugbyleagueproject.org/calendar/2019/awards.html
- Dollin, S., Ferguson, A., & Bates, B. (2021b). State of origin 2021 [Online]. https://www.rugbyleagueproject.org/competitions/state-of-origin-2021/summary.html
- Dollin, S., Ferguson, A., & Bates, B. (2022a). Calendar - 2022 awards [Online]. https://www.rugbyleagueproject.org/calendar/2019/awards.html
- Dollin, S., Ferguson, A., & Bates, B. (2022b). State of origin 2022 [Online]. https://www.rugbyleagueproject.org/competitions/state-of-origin-2022/summary.html
- Dollin, S., Ferguson, A., & Bates, B. (2023). NRL seasons [Online]. https://www.rugbyleagueproject.org/competitions/nrl/seasons.html
- Fox Sports. (2023). Dally M Team of the year nominees named with six warriors in contention [Online]. https://www.foxsports.com.au/nrl/nrl-premiership/nrl-2023-dally-m-team-of-the-year-nominees-when-is-the-dally-ms-coach-of-the-year-rookie-of-the-year-voting-process-news-highlights/news-story/e6c4f8113f51b7685d0e208a124ffa5f
- Gifford, M., & Bayrak, T. (2023). A predictive analytics model for forecasting outcomes in the National Football League games using decision tree and logistic regression. Decision Analytics Journal, 8, 100296. https://doi.org/10.1016/j.dajour.2023.100296
- Gwet, K. L. (2008). Computing inter-rater reliability and its variance in the presence of high agreement. British Journal of Mathematical & Statistical Psychology, 61(1), 29–48. https://doi.org/10.1348/000711006X126600
- Hastie, T. (2023). glmnet: Lasso and elastic-net regularized generalized linear models. 4.1-7 ed.
- Hoffer, A., & Pincin, J. A. (2020). Las vegas point spread values and quantifying the value of an NBA player. International Journal of Sport Finance, 15(3), 125–136. https://doi.org/10.32731/jsf.2020.a927062
- Hughes, A., Koedel, C., & Price, J. A. (2015). Positional WAR in the National Football League. Journal of Sports Economics, 16(6), 597–613. https://doi.org/10.1177/1527002515580931
- Kuhn, M. (2023). caret: Classification and regression training. 6.0-94 ed.
- Kuper, S., & Szymanski, S. (2022). Soccernomics. HarperCollins.
- Landis, J. R., & Koch, G. G. (1977). The measurement of observer agreement for categorical data. Biometrics Bulletin, 33(1), 159–174. https://doi.org/10.2307/2529310
- Lewis, M. (2004). Moneyball : The art of winning an unfair game. W. W. Norton.
- Liu, R. X., Kuang, J., Gong, Q., & Hou, X. L. (2003). Principal component regression analysis with spss. Computer Methods and Programs in Biomedicine, 71(2), 141–147. https://doi.org/10.1016/S0169-2607(02)00058-5
- Ma, B., Wang, Y., & Li, Z. (2023). Application of data mining in basketball statistics. Applied Mathematics and Nonlinear Sciences, 8(1), 2179–2188. https://doi.org/10.2478/amns.2021.2.00182
- Meyer, D. (2023). e1071: Misc functions of the department of statistics, probability theory group (Formerly: E1071), TU Wien. 1.7-13 ed.
- National Rugby League. (2012). State of origin eligibility [Online]. https://www.nrl.com/siteassets/documents/state-of-origin-eligibility-rules.pdf
- National Rugby League. (2022a). Dally M awards - about [Online]. https://www.nrl.com/hall-of-fame/dally-m-awards/about/
- National Rugby League. (2022b). Dally M awards - the voting process [Online]. https://www.nrl.com/hall-of-fame/dally-m-awards/voting-process/
- National Rugby League. (2023). NRL announce nominees for 2023 NRL Dally M awards [Online]. https://www.nrl.com/news/2023/09/24/nrl-announce-nominees-for-2023-dally-m-awards/
- Oliver, D. (2004). Basketball on paper : Rules and tools for performance analysis. Brassey’s, Inc.
- Oliver, D. (2011). Guide to the total quarterback rating [Online]. https://www.espn.com/nfl/story/_/id/6833215/explaining-statistics-total-quarterback-rating
- Pro Football Reference. (2021). Minimum requirements for football leaderboards [Online]. Retrieved July 19, 2023, from https://www.pro-football-reference.com/about/minimums.htm
- R Core Team. (2022). R: A language and environment for statistical computing. R 4.2.2 ed.
- Robertson, S., Gupta, R., & Mcintosh, S. (2016). A method to assess the influence of individual player performance distribution on match outcome in team sports. Journal of Sports Sciences, 34(19), 1893–1900. https://doi.org/10.1080/02640414.2016.1142106
- Rstudio Team. (2023). RStudio: Integrated development environment for R (Version 4.2.2). 2023.09.0+463 ed.
- Sargent, J., & Bedford, A. (2013). Evaluating Australian football league player contributions using interactive network simulation. J Sports Sci Med, 12(1), 116–121.
- Schloerke, B. (2021). GGally: Extension to ‘ggplot2’. 2.1.2 ed.
- Shea, S. M., & Baker, C. E. (2012). Calculating wins over replacement player (WORP) for NHL goaltenders. Journal of Quantitative Analysis in Sports, 8(1). https://doi.org/10.1515/1559-0410.1358
- Simsek, S., Albizri, A., Johnson, M., Curtis, T., & Weikert, S. (2020). Predictive data analytics for contract renewals: A decision support tool for managerial decision making. Journal of Enterprise Information Management, 34(2), 718–732. https://doi.org/10.1108/JEIM-12-2019-0375
- Slowinski, P. (2010). What is WAR? [Online]. https://library.fangraphs.com/misc/war/
- Watanabe, N. M., Shapiro, S., & Drayer, J. (2021). Big data and analytics in sport management. Journal of Sport Management, 35(3), 197–202. https://doi.org/10.1123/jsm.2021-0067
- Weiwei, H. (2022). Classification of sport actions using principal component analysis and random forest based on three-dimensional data. Displays, 72, 102135. https://doi.org/10.1016/j.displa.2021.102135
- Wickham, H. (2023). tidyverse: Easily install and load the ‘Tidyverse’. 2.0.0 ed.
- Williams, G. (2022). rattle: Graphical user interface for data science in R. 5.5.1 ed.
- Woods, C. T., Leicht, A. S., Jones, B., & Till, K. (2018). Game-play characteristics differ between the European Super League and the National Rugby league: Implications for coaching and talent recruitment. International Journal of Sports Science & Coaching, 13(6), 1171–1176. https://doi.org/10.1177/1747954118788449
- Yigit, A. T., Samak, B., Kaya, T., & Kahraman, C. (2020). An XGBoost-lasso ensemble modeling approach to football player value assessment. Journal of Intelligent and Fuzzy Systems, 39(5), 6303–6314. https://doi.org/10.3233/JIFS-189098
- Yurko, R., Ventura, S., & Horowitz, M. (2018). nflWAR: A reproducible method for offensive player evaluation in football. Journal of Quantitative Analysis in Sports, 15(3), 163–183. https://doi.org/10.1515/jqas-2018-0010