
Abstract
Running Records provide a standardized method for recording and assessing students’ oral reading behaviors and are excellent formative assessment tools to guide instructional decision-making. This study expands on prior Running Record reliability work by evaluating the extent to which external raters and teachers consistently assessed students’ accuracy and self-correction ratios in the context of a naturalistic lesson setting. This study was conducted using recorded lessons from 19 students, taught by 11 teachers in ten schools, who in separate lessons read two books at the same text level. Generalizability theory framework was applied to identify sources of variability in accuracy and self-correction scores and subsequently evaluate necessary conditions for reliable measurement using Running Records. Results indicated that raters were highly reliable. However, due to the impact of reading occasion, approximately eight to ten reads are needed for reliable assessment of students’ accuracy and self-correction via Running Records.
Teachers in many countries use Running Records to support responsive reading instruction (Harmey & Kabuto, Citation2018; Johnston & Afflerbach, Citation2015). While conducting her dissertation, Clay (Citation1966) developed Running Records as a method to systematically code and score oral reading behaviors for subsequent analysis. She further expanded the scoring system and published instructions for teachers to conduct their own Running Records (see Clay, Citation1972, Citation2000, Citation2019).
Clay integrated Running Records into two of her most widely known educational innovations. When she developed Reading Recovery, she relied on Running Records as the primary mechanism for teachers to monitor student progress and differentiate instruction. As part of the lessons, teachers take a Running Record while the student reads a book that was read during the prior lesson. Running Records also were used by Clay as one of the six tasks of her Observation Survey of Early Literacy Achievement (Clay, Citation2019) to identify a student’s instructional text level.
The use of Running Records has expanded well beyond Clay’s developments and now are used in many other educational contexts for instructional and research purposes (see for example, Johnston & Afflerbach, Citation2015; Kragler, Martin, & Schreier, Citation2015; Pinnell, Lyons, DeFord, Bryk, & Seltzer, 1994). In fact, teachers continue to use Running Records in both individual and small group instruction settings in order to record a child’s oral reading for later analysis, just as Clay had initially intended (Bean, Cassidy, Grumet, Shelton, & Wallis, Citation2002; Ford & Opitz, Citation2008; Kragler et al., Citation2015; Wang, Compton-Lilly, & Sánchez, Citation2020). Their wide applicability across an array of instructional settings was supported by an International Reading Association (IRA) position statement noting that excellent teachers use, among other assessment tools, Running Records to assess student progress (Santa et al., Citation2000).
A Running Record is a complex measurement process that involves the student, the teacher (i.e., the rater), the text, and the scoring and interpretation processes. As the student reads a book or some other form of continuous text, the teachers uses standard procedures to count the number of errors the child made, calculate the percentage of oral reading accuracy, and calculate the self-correction ratio (Clay, Citation2019). They also analyze each error and self-correction to determine which sources of information (meaning, structural, and/or visual) a student is using and neglecting when attempting unknown words. These analyses and the patterns that emerge provide a more complete understanding of the student’s processing and inform the teacher’s instruction (Clay, Citation2019); it is for that reason that Running Records serve as an excellent example of formative assessment (Johnston & Afflerbach, Citation2015).
Reading specialists, teachers, and researchers use the information gleaned from Running Records for a variety of purposes, ranging from formative assessment to student placement. For example, teachers may rely on Running Records to identify optimal text reading levels for individual instruction, to appropriately organize students for small group instruction, or to track students’ reading progress over time (Barone, Khairallah, & Gabriel, Citation2020; Bean et al., Citation2002; Kragler et al., Citation2015) As a result, Running Records play a role in guiding teachers’ decision-making and ultimately in determining the type of reading instruction students receive.
Running Record Score Reliability
The widespread use of Running Records for instructional and research purposes warrants an examination of the degree to which the scores and decisions reached from those scores are consistent and generalizable. If the scores lack reliability, teachers can be misinformed and make erroneous instructional and placement decisions, which can ultimately result in negative consequences for children’s early literacy development. For the researcher, lower score reliability can result in reduced statistical power (Shadish, Cook, & Campbell, Citation2002). Because the process of taking a Running Record involves the student, teacher (rater), a coding protocol, and various books or text passages at graded levels, a thorough assessment of Running Record score reliability would involve the examination of multiple sources of potential error. A complete assessment would involve computing reliability coefficients associated with intra- and inter-rater consistency, the repeatability of scores on multiple observations, and the generalizability of scores on alternate texts. Given that Running Records yield various forms of information about the student, these analyses could be conducted on accuracy and self-correction scores, as well as on reading levels.
Each of the prior reliability studies on Running Records have addressed different sources of error on various scores. Past studies fall into one of two categories; those that focus on the consistency of error (accuracy) and/or self-correction scores, and those that address the reliability of using records to find a student’s instructional level. For her dissertation research, Clay (Citation1966) found an intra-rater test-retest reliability of .98 for error (accuracy) scoring and .68 for self-correction by correlating her ratings of 46 records from four students with her ratings taken two years later while listening to the same 46 readings on audiotape. She attributed the rather low correlation for self-corrections to sound quality differences of the audiotapes, as well as fluctuations in interpretations of self-corrections and rater error. Clay also evaluated inter-rater consistency during her dissertation research by asking six raters (after being trained for an hour) to score twelve audiotaped readings, six from two students each. She found no significant differences among the seven raters, which included the ratings from the six individuals she trained and her own, on errors and self-corrections based on chi-square test results.
Decades past before additional Running Record reliability studies were published. Pinnell, McCarrier, and Button (1990) reported a person separation reliability (equivalent to coefficient alpha) of .83 for a Rasch rating scale of text reading levels. The measure was used to compare the effectiveness of various instructional interventions (Pinnell, Lyons, DeFord, Bryk, & Seltzer, 1994). Inter-rater decision consistency of determining students’ reading levels was assessed by Denton, Ciancio, and Fletcher (Citation2006). They asked two experienced raters to determine the highest reading level read at 90% or greater accuracy of 24 kindergarten and first grade students. The correlations between the students’ reading levels and distribution ranks across the two raters were .98 and .96, respectively.
Clay (Citation1966) and Denton et al. (Citation2006) focused on the rater as the key source of error in their reliability analyses. Fawson, Ludlow, Reutzel, Sudweeks, and Smith (Citation2006) took a more comprehensive approach by conducting a generalizability study to simultaneously examine multiple error sources, including the student, rater, and text. The researchers videotaped ten first-grade students, ranging from below-benchmark to above average in reading proficiency, reading two narrative text passages. Both passages were Reading Recovery level 14, which is the approximate text difficulty that an average student is expected to be able to read toward the end of first grade. Ten trained teachers took Running Records while watching the twenty videos.
Fawson et al.'s (Citation2006) generalizability analyses revealed that less than one percent of the total variability in accuracy scores were due to raters, indicating that scores were consistent across raters. The largest source of error variability was the interaction between students and passages, indicating that the relative ranking on accuracy among students varied considerably from one passage to another. Although there are no agreed-on thresholds of acceptable reliability values, Nunnally and Bernstein (Citation1994) standards of a minimum of .70 for research and at least .80 for measures used to make decisions about individuals often are cited as reasonable guidelines. Fawson et al. projected a .55 reliability coefficient for a single Running Record scored by one rater, and in order to achieve a value above .75, a teacher would have to score three readings for a student. To obtain a reliability above .80, four readings per student would be required.
Taken together, the available evidence on Running Record reliability indicates that raters tend to be rather consistent, but student performance does not seem to generalize well across alternate books or text considered to be equated in terms of difficulty. If one were to rely on the analyses provided by Fawson et al. (Citation2006), a sufficiently reliable estimate of a student’s accuracy could be obtained by the third or fourth Running Record. Yet it is important to consider the differences between the design features of Fawson et al.’s study and the typical uses of Running Records in schools that may minimize the likelihood their projections generalize to the latter settings.
Fawson et al. (Citation2006) asked students to read two passages consecutively, one immediately following the other, in a reading lab. Typically, teachers do not take Running Records on two readings in one sitting; there usually is at least a one-day gap between test-retest administrations. Thus, error associated with student performance across varying testing scenarios likely was reduced in their study. Furthermore, raters were asked to score the same two books read by ten students. Although teachers usually are well-acquainted with the books they ask students to read when taking Running Records, they often employ a much larger sample of books to do so. The extended practice afforded to the raters on two books may have increased the precision of their scoring to a level that was not indicative of more authentic Running Record applications, and it is questionable if two books represents an adequate sample size in which to infer that three or four books are necessary to reach adequate reliability levels.
It is also important to note that students in the Fawson et al. (Citation2006) study were asked to read a passage that they had not read before. Although it is not uncommon to take a Running Record on a “cold read,” such as when administering the text reading level task of the Observation Survey of Early Literacy Achievement, Running Records used to monitor student practice usually are taken on a book that the student has read previously (Clay, Citation2005). Further, Running Records typically are taken on a book or text presumed to be at or near a student’s reading level, whereas in the Fawson et al. study, the two books were both Level 14 even though students’ reading levels varied considerably. Hence, much of their data were from student readings that were off-level, and thus accuracy rates for many students may have been atypical. For these reasons, Fawson et al.’s projections may have been based on a study with limited ecological validity to authentic school uses of Running Records.
Study Purpose
The present study addresses some of the limitations of the Fawson et al. (Citation2006) study by drawing on field-based data from Reading Recovery lessons. For 19 students who were receiving the intervention, we identified situations in which their teachers asked them to read two books at the same level of difficulty over two consecutive days that were targeted at the students’ instructional levels. No two students read the same book, and no student read the same book at both testing points. Hence, there were 38 total books read by the sample. In addition to the actual Running Records taken by teachers as their students read in person, we asked trained raters to take Running Records from video-taped recordings of the readings.
We conducted generalizability analysis to examine the reliability of accuracy and self-correction scores and to estimate the degree of variance accounted for by students, raters, test-retest, and interactions between those factors. It was also of interest to examine the consistency of scores between raters who scored from video-recordings and the students' Reading Recovery teacher in person. We conducted the analysis separately for the raters alone and the raters with the teacher scores included. The following research questions were addressed:
How consistent is the performance of students across books of the same text level?
How consistent are external raters in assessing students’ accuracy and self-correction ratios?
How accurate are teachers in assessing students’ accuracy and self-correction ratios while taking a Running Record in the context of a lesson?
Method
Data Source and Participants
Running Records from video-recorded Reading Recovery lessons were used to conduct the reliability analyses. As part of a research partnership with a midwestern school district in a small city located on the outskirts of a major metropolitan area, we built a repository of 318 videos of Reading Recovery lessons from Spring 2016 on 201 students taught by 22 teachers in 16 elementary schools. All videos were recorded on an iPad, with the tablet positioned in front of the teacher and child. Both the teacher-child interaction and book were in view. Each recorded lesson included a familiar reading component where the teacher recorded a Running Record. Students would have received instruction on the Running Record book during the lesson on the previous day. The repository also included all lesson transcripts, including the Running Records taken by the teacher that were included as part of the videotaped lessons.
From the transcripts, we identified in the repository all instances where teachers administered Running Records on the same book level over two consecutive lessons. We chose those lessons because they represented opportunities to examine test-retest reliability on two different books per student on the same level of difficulty. There were 38 lessons with accompanying videos from 19 students who were taught by 11 teachers in 10 schools that met the selection criteria. Consistent with the larger dataset of 318 lessons, all teachers were White females with a range of educational attainment from completion of a bachelor’s degree (36.4%), master’s degree (9.1%), and master’s degree plus coursework (54.5%). Students were in Grade One and between the ages of six and seven. They were 56% male, primarily White (94%), and about half of them were eligible for the federal lunch program.
Raters
Accuracy and self-correction scores from the original Reading Recovery teacher Running Records, which were taken during the live lessons, were combined with accuracy and self-correction scores from three raters who took Running Records while watching the video-recordings. The raters were three graduate students in education at a Midwestern university who all had prior training and experience administering Running Records. Before scoring the 38 videos, raters completed two in-person refresher sessions led by an expert rater to establish interrater agreement. Videos that were in the same dataset but excluded from the analytic sample were used for the refresher. Those videos represented a range of texts and reading levels (3, 9, 12, 14, and 16).
During the first training session, raters received an introduction to recording and scoring Running Records from the expert rater. Raters also viewed one sample Running Record video; the video was viewed by all raters at the same time and was not stopped at any point. Then, the raters calculated number of errors, accuracy rate, number of self-corrections, and self-correction ratio independently. Raters compared scores and were led by the expert rater in a discussion of discrepancies across their ratings until consensus was reached.
During the second session, the raters collectively viewed three additional videos. They again calculated independently each students’ number of errors, accuracy rate, number of self-corrections, and self-correction ratio, then were led in a discussion of each video by the expert rater. Following completion of viewing and recording Running Records for the three consecutive videos, interrater agreement for accuracy and self-correction ratio was calculated. For percent accuracy, raters had 100% adjacent agreement (i.e., within 1%) with the expert as anchor for the three consecutive videos. For self-correction ratio, raters had 100% adjacent agreement with the anchor for two of the videos (videos 1 and 3) and 33% adjacent agreement with the anchor for one of the videos (video 2). Raters reviewed and compared notes with anchor, resolving where ratings were different. The reduced adjacent agreement in self-correction ratio for video 2 was primarily due to an issue of structural coding; that is, the raters treated a skipped line in the text as two substitutions rather than coding it as five omissions (which were subsequently self-corrected). The interrater agreement established during the independently rated refresher videos was determined to be acceptable to proceed with the study.
Procedures
The three raters observed the Running Record portion of each recorded lesson at the same time while seated apart from one another at a 10′ by 4′ table in an 18′ by 17′ conference room. The 38 videos, presented one after another in random order, were viewed by the raters using an LCD projector and a 9′ by 6′ white screen. The raters did not discuss the videos and did not share their ratings, and the distance between each rater was such that it was not possible to see each person’s score sheets.
Procedures were intended to mimic those of a live Running Record as closely as possible; consequently, each rater had a copy of the text and Running Records were recorded without stopping the video at any point. Raters also read each text before viewing the video to mimic the familiarity a teacher would have from providing instruction on that book the day prior. Since teachers in the dataset selected the texts based on each child’s individual progress, there were no duplicate books in the study. Videos were estimated to be approximately 15 minutes each, with videos viewed and Running Records completed over a total of approximately 12 hours across 4 sittings. At the conclusion of each video, raters individually computed and recorded the number of errors, number of self-corrections, accuracy rate, and self-correction ratio.
Analyses
After conducting preliminary descriptive statistics, Cronbach’s alpha was computed to assess standard reliability of accuracy and self-correction ratio across judges. Then, using the framework of generalizability (G) theory, a two-faceted nested design was employed. This design (represented as (i:p) x h) includes books (i) nested within students (p), which were crossed with raters (h). Using Mashquash and O’Connor (Citation2006) SPSS program, variance components, relative and absolute errors, generalizability coefficients, and D study coefficients were computed using the ANOVA matrix algorithm method.
Results
The average text level among the 19 students was 11.16 (sd = 3.27), and the students ranged in levels from five to 17. The average accuracy proportion according to the teachers’ Running Records were slightly lower at the first reading (M = 95.21) compared to the second reading (M = 96.68), the mean difference was not significant, t(18) = 1.19, p = .25. The same was the case for the teachers’ scores on self-corrections: the average self-correction ratio changed from .38 to .49, but the means did not differ significantly, t(18) = 1.09, p = .29.
In combination, the three raters also scored the second readings to be slightly more accurate and contained more self-corrections than the first read, but the differences were negligible. The average combined accuracy across the three raters were 95.68 and 95.99 on the first and second reads, respectively. Their combined self-correction ratio averages on the first and second reads were .44 and .46, respectively. There was little variation between raters in terms of scoring accuracy at either time point (95.32, 96.05, & 95.68 for the first read, and 95.95, 96.05, & 95.97 on the second read), and the raters’ averages were very similar to those of the teachers. There was more variation among the raters, and between the raters and teachers, in terms of scoring self-corrections for the first read (.39, .42, & .50) and the second read (.48, .42, & .47).
The student accuracy and self-correction test-retest reliability was very low as reported by the teachers and raters. For accuracy, the correlation in scores between the first and second reads across the 19 students was −.28 according to the teachers, and −.11, −.23, and .09 for the three raters. Although none of the four correlations was significant, the general trend was that students with higher accuracy values on the first read tended to have lower accuracy scores on the second read. In terms of self-corrections, the teacher-based score correlation was −.41, and the rater correlations were .11, .05, and .27. None of the correlations were significant. Thus, the lack of consistency in student performance from the first to second read portended that student test-retest reliability across books would be a major source of error in the generalizability analysis.
Judge Reliability
We computed alpha coefficients to ascertain the degree of consistency among the raters and raters plus teachers. Coefficients were computed at each of the two timepoints and overall (see ). As can be seen from the table, the values range from .89 to .95. The values were slightly larger when we included only the rater scores, but when the teacher scores were included, the coefficients remained high. The values were slightly larger for accuracy than self-correction. For the former set of scores, the values ranged from .93 to .97, whereas for the latter scores, they ranged from .89 to .92. Given the high indices of inter-rater reliability, we did not expect the judge facet to be a main source of error.
Table 1. Alpha coefficients for judges overall and by timepoint.
Generalizability Study Results
After computing summary statistics and alpha coefficients among judges, we conducted a generalizability (G) study to decompose the sources of variability in the Running Record accuracy and self-correction scores. Specifically, the analyses identified the proportion of variability in those scores that is attributable to books\timepoint, students, judges, and their interactions. G-theory is predicated on the notion that each student has a true universe score on the construct of interest. If scores generalize across levels or conditions of a facet, then the universe score is expected to be equivalent across those facets or conditions. Thus, an indicator of generalizability of scores is a lack of between level/condition variability for a given facet or interaction term. We conducted the analyses separately for the accuracy and self-correction scores, and for raters only and raters plus teachers. provides the results of the four analyses.
Table 2. ANOVA tables.
Accuracy
In a generalizability analysis, the largest source of variability among the scores should be the examinees, or in this case students, because their true scores are expected to differ. Nearly a third of variance (27.7%) in accuracy scores was attributable to the individual student for their scores from the raters only. Little to no variance (0.2%) in accuracy scores was attributable to the judge, which was expected given the high inter-rater alpha coefficients. The three raters were essentially interchangeable in their scoring of accuracy. Most of the variance (62.3%) in accuracy scores was attributable to the interaction between book\timepoint and student. Thus, students’ accuracy rate on the Running Record was largely affected by differences in the book read at each measurement occasion. No variance (0.0%) in accuracy scores was attributable to the interaction between raters and student. Thus, students’ accuracy scores were not dependent on the particular rater who recorded the Running Record. Finally, a small portion of the variance (9.9%) in accuracy scores was attributable to the three-way interaction between judge, book, and student. That value represents the error term, or the residual variance remaining at the individual rating level.
The G-study was conducted again with accuracy scores computed by the three raters and the teacher who took the initial Running Record. The general patterns were the same, though proportions of variance attributable to the various components changed slightly (see ). That is, the majority of variance (57.0%) was again attributable to the interaction between book\timepoint and student, while the remaining variance was attributable to student (i.e., the true score variance was 23.9%) and the three-way interaction between judge, book, and student (i.e., the error term; 19.1%).
Self-Correction Ratio
The general patterns of results were similar for the self-correction ratio scores, except the proportion of variance explained by the books\timepoints x student interaction was slightly lower compared to the results for accuracy. The interaction explained the greatest proportion of variance (46.6%), and thus, like accuracy, the self-correction values were most strongly impacted by differences in books read at each measurement occasion. Conversely, variance attributable to raters (1.0%) and to rater by student interactions (1.3%) were negligible. Interestingly, across all four tested models, this model had the highest proportion of variance attributable to the student (34.3%), or the more reliable estimation of students’ true score.
The fourth G-study analysis included the self-correction ratios computed by the raters and the teacher. A pattern consistent with those of previous models emerged, with the largest proportion of variance explained by differences in books\timepoint (41.9%), and little to no variance explained by differences across judges (0.6%). This model, however, had the highest proportion of residual variance of the four models (29.4%).
Design Study Results
The Design (D) study produced coefficients using the estimated variance components from the G-study. These coefficients indicated the necessary conditions to obtain reliable measurement (i.e., necessary conditions to minimize error and thus optimize reliability of ratings). The analysis focused on perhaps the most critical question for a teacher or researcher: How many Running Records on different books or text passages do I have to take to achieve a reliable estimate of a student’s true score? We therefore produced generalizability and phi coefficients as well as standard errors of measurement (SEM) estimates that would likely result if between one and 16 Running Records would be administered by one judge to a student.
The generalizability (G) coefficients serve as indicators of reliability for relative decisions one can make about individual students in comparison to other students, and therefore, can be interpreted similarly as reliability coefficients (Brennan, Citation2001). As noted by Fawson et al. (Citation2006), G-coefficients, however, account only for error sources related to differences in a student’s relative standing within a group. The phi-coefficients serve as an indicator of reliability for absolute decisions one can make about individual students. In contrast to the generalizability coefficients, phi-coefficients account for all estimated sources of error in the ratings. The SEM values serve as indicators of how much a student’s score would vary from one Running Record to another—that is, how much their accuracy would vary if they were tested repeatedly. Multiplying each SEM value by 1.96 and adding and subtracting the result from a student’s score provides 95 percent confidence intervals around the student’s score, reflecting that 95 percent of the scores would fall between the lower and upper interval values. We reported the SEMs in the original accuracy and self-correction ratio metrics. provides the estimated G- and phi-coefficients for accuracy and self-correction ratio scores by number of Running Records for one judge. The values also are presented visually in and . provides the SEM estimates across Running Records assuming single-judge scoring.
Figure 1. D-study G-coefficients by number of Records (for 1 judge).
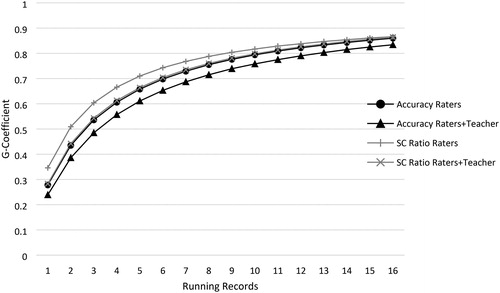
Figure 2. D-study phi-coefficients by number of Records (for 1 judge).

Table 3. D-study G(Phi) coefficients by number of Running Records (for 1 judge).
Table 4. D-study standard errors of measurement by number of Running Records (for 1 judge).
Using Nunnally and Bernsteins’s (1994) benchmarks of .70 and .80 for lower-bound sufficient reliability estimates for research- and individual-decision purposes, respectively, it can be seen in and and , that a minimum of six Running Records would be required to obtain a .70 reliability for accuracy, and about 10–11 records would be required to obtain a .80 reliability (based on the raters-only estimates). The same decision would be reached if one were to rely on the G- or phi-coefficients. If one were to base the decision on the estimates derived from combining the rater and teacher scores, one would need about eight reads to reach a reliability of .70 for accuracy, and about 13 reads to reach .80.
Because the self-correction ratio scores generalized slightly better across books1timepoints, a .70 reliability could be obtained with five Running Records, and a .80 could be reached by nine reads, basing the decision on the raters only data. If the decision were to be made on the raters and teacher scores, six and ten reads would be necessary to obtain reliability values of .70 and .80, respectively.
The SEM estimates provided in reveal that approximately the same number of Running Records would be required to reach a stable estimate of a student’s true score, which could have implications for the precision of decisions reached by a teacher. Assume a hypothetical student who has an accuracy score of 92 on a Running Record, which is widely considered the midpoint of the instructional level (ranging from 90–94 accuracy). Thus, to be 95 percent certain the student’s level is truly instructional, the SEM would need to be a value of about one, which would result in a 95% confidence interval of 90.04 to 93.96). From , it can be seen that about nine or ten reads (depending on whether the decision is based on the raters only or raters plus teacher data) would be required to decrease the SEM to near one. If the hypothetical student’s point estimate is not at the midpoint of the reading level, then more Running Records would be required to render a more accurate decision.
Discussion
Given the popularity of taking Running Records to gauge a student’s reading level and skills, and at times to make decisions about the student’s placement in supplemental services, it is imperative to elucidate the degree of Running Record score reliability. The original developer of the measurement device, Marie Clay, was keenly aware of this need, as evinced by her intra- and inter-rater reliability analysis in her dissertation work. She, as well as others (Denton et al., Citation2006; Fawson et al., Citation2006) found that trained raters indeed can be quite reliable to the point of producing nearly identical accuracy or test level values. Yet as Fawson et al. found in their generalizability analysis, rater consistency is not a concern as a primary source of error. Instead, they found that students can perform quite differently across books at the same difficulty level.
We embarked on the current study to produce additional estimates of the number of readings necessary to yield a reliable estimate of a student’s true proficiency. Fawson et al. (Citation2006) concluded that about three to four Running Records would produce .75 to .80 reliability, but their estimates were based on data from a highly-controlled situation in which raters were asked to score readings from only two books. In actual school-based settings, teachers typically draw on a much larger library of books. We set out to examine if their estimate of three to four books would hold under more typical circumstances.
We drew on video-recordings of actual Reading Recovery lessons in which teachers chose two different books at the same level for each student to read over two successive days. The teachers took Running Records as part of the intervention without any thought of a reliability analysis. We asked trained raters to also score the students’ readings while simulating as best as possible the context in which the teacher originally scored the readings. A key question we addressed was whether trained raters would score the readings similarly while watching a video-recording to the teachers who scored in a face-to-face setting with the student.
Rater Reliability
Consistent with previous findings (Clay, Citation1966; Denton et al., Citation2006; Fawson et al., Citation2006), we found very high estimates of inter-rater reliability. The values were slightly higher for scoring accuracy than self-corrections, and when the rater data was considered separately than when combined with the teacher scores. This was evidenced by the high alpha coefficients and little to no variance being attributable to judges in all four G-study models.
It is important to note that the teachers were trained by a different expert from the raters and scored the readings under different circumstances. Teachers’ scores indeed were less correlated with the raters than the raters scores were intercorrelated, but combining the teacher scores with those from the raters led to a negligible reduction in consistency. A reduction of approximately .05 reliability was found when adding the teachers’ scores with the raters. This suggested that, for the most part, judges were able to score the Running Record by video with the book as a guide similarly to a judge scoring the student reading in real time. For any given read, a trained judge likely would produce nearly the same accuracy percentage and self-correction ratio as any other trained judge, and thus, if raters are trained well, multiple judges are not necessary to produce reliable accuracy and self-corrections Running Records.
Generalizability of Readings
The different G-Study and D-Study designs addressed sources of error that would diminish score reliability. In all models, the largest source of error, and thus lack of generalizability, was the student by book\timepoint interaction. This finding was consistent across the models for accuracy and self-correction, although there was slightly more generalizability in the self-correction models. Unlike Fawson et al. (Citation2006) estimates of three to four readings to reach sufficient reliability, we found that G- and phi-coefficients did not reach .70 until about six to eight readings, and .80 by ten or more readings, depending on if measuring accuracy or self-corrections is the goal, and whether the rater or raters plus teacher data are considered. Regardless of which outcome or data are used to derive the estimates, we found that under more typical school-based settings, one may need nearly double the readings as first estimated by Fawson et al.
We are not suggesting, however, that one should not make use of Running Records until about eight readings are scored. Each score provides some information about the student’s proficiency and, if properly trained, tremendous diagnostic information can be gleaned from each singe reading that should influence the course of the next set of instructional activities geared to the student’s needs. In constructive formative assessment, one should not expect high levels of reliability on each observation—reliability can be established after repeated measures over time. Our findings reveal that high-stakes decisions for the student, such as placement in Tier 2 or Tier 3 services, should not be based on one or even a few readings, and if only one reading is taken, the Running Record score should be considered along with scores on the other tasks or other assessments.
Our analysis did not reveal, however, what accounted for the lack of generalizability across the readings. It could have been the difference in text content or format across the books that interacted with idiosyncrasies of the students. We conjecture that students had varying degrees of content knowledge or interest, and thus, found one book more interesting or more difficult than the other based on individual profiles. Their strengths and areas in need of improvement as emerging readers may have interacted with the books, in that a book may have aligned well with a student’s strengths or extenuated gaps in the skill sets. Of course, one underlying assumption is that books at the same level were accurately classified as such and essentially represent alternate forms. Any error in the book leveling process would contribute to error in student test-retest scores.
Yet it also is possible the large variance attributed to the student by book\timepoint interaction was not due to the books, but instead, was due to the lack of performance consistency in struggling readers from day to day. Students’ levels of engagement, focus, and other conventional sources of person-specific error may have been the primary reasons for the lack of score generalizability over time. It also may be a combination of book and student factors that attributed to the lack of generalizability. To isolate the primary reason, a study in which Running Records are taken on the same book over multiple test points would need to be conducted to rule out book differences, yet doing so would not create a perfect testing scenario due to varying degrees of practice effects across students.
Though raters were slightly more consistent when scoring accuracy than self-corrections, the self-correction scores were slightly more generalizable across the books\timepoints. Self-corrections occur after a student makes a reading error and represents the mental activities of the student to notice that an error has been made that needs correcting. Our findings may reveal that self-correcting transcends book differences to a greater extent than accuracy, which may be more dependent on the nuances of each book. It may also indicate, however, that self-correcting is a more durable cognitive process that is more consistent from one day to the next.
There also were some minor differences in magnitude between the G- and phi-coefficients. The G-coefficients, indicators of reliability for relative decision-making, were slightly higher across all four models than the phi-coefficients, which are indicators of reliability for absolute decision-making. These smaller differences in reliability for absolute decision-making than relative decision-making suggest that the measures operate more similarly for absolute decision-making than for relative ranking of students.
Study Limitations
Besides the fact that our study design did not allow us to isolate error due to book differences versus student inconsistency over time, there were other study limitations that diminished the strength of the inferences we were able to draw from the findings. Though the data were from authentic school-based lessons, we could only identify 19 situations in which teachers asked students to read books at the same level over two consecutive days. Hence, we relied on a relatively small data set from one school district to examine Running Record reliability.
All students were receiving Reading Recovery and thus, the Running Records were derived under conditions that were specific to the intervention protocol, which include taking a Running Record on a book that had been read in a previous lesson. Furthermore, the intervention is targeted to the lowest twenty percent of students in a school in terms of reading proficiency, so all sampled students were struggling to read. The 19 students, however, varied in reading proficiency and were asked to read books targeted at their level. It is not clear how or to what extent the sample specifications generalize to a broader population of first-grade readers. Our findings generally converge with the Fawson et al. (Citation2006) results, which were derived from a similarly small but broader array of student proficiency levels, so we speculate that our findings are not entirely limited to the population of low-performing students.
Conclusion
Taking a Running Record is an interactive process involving a student reading a body of text while being scored by a teacher or other examiner. Adding to the existing evidence on Running Record score reliability, we found that teachers or raters tend to produce quite reliable scores, assuming they are properly trained, and therefore, there is little value gained by involving more than one judge in the process. The primary source of error seems to be the interaction with the student and reading material at a given testing time. We estimate that about eight to ten readings would be required to produce a baseline of scores that together would produce an adequate degree of reliability. The same number of reads would be required to be 95 percent confident of a student's book levels if their accuracy score was at or near the middle of the level interval.
For ongoing formative assessment, the amount of error found in each Running Record is not substantially critical as long as important decisions are not based on the score from any given reading. If used to evaluate a program, or if used for some other research purpose, multiple Running Records should be implemented before a true score estimate is produced. This consideration is built into the Observation Survey of Early Literacy Achievement text reading level procedures (Clay, Citation2019), which require a minimum of four Running Records to identify the instructional level for a student (one at easy, one at instructional, and two at hard). Though we did not evaluate the Observation Survey, our results suggest that even four records may not be adequate if .70 serves as a threshold of sufficient reliability. Running Records are powerful assessment devices that provide direct, systematic observations of the reading process, but they best serve the user and student if implemented properly for each given purpose.
References
- Barone, J., Khairallah, P., & Gabriel, R. (2020). Running Records revisited: A tool for efficiency and focus. The Reading Teacher, 73(4), 525–530. doi:10.1002/trtr.1861
- Bean, R. M., Cassidy, J., Grumet, J. E., Shelton, D. S., & Wallis, S. R. (2002). What do reading specialists do? Results from a national survey. The Reading Teacher, 55(8), 736–744.
- Brennan, R. L. (2001). Generalizability theory. New York: Springer.
- Clay, M. M. (1966). Emergent reading behavior (Unpublished doctoral dissertation). University of Auckland, Auckland, NZ.
- Clay, M. M. (1972). The early detection of reading difficulties. Auckland: Heinemann.
- Clay, M. M. (2000). Running Records for classroom teachers. Portsmouth, NH: Heinemann.
- Clay, M.M. (2005). Literacy lessons designed for individuals. Portsmouth, NH: Heinemann.
- Clay, M. M. (2019). An observation survey of early literacy achievement (4th ed.). Portsmouth, NH: Heinemann.
- Denton, C. A., Ciancio, D. J., & Fletcher, J. M. (2006). Validity, reliability, and utility of the observation survey of early literacy achievement. Reading Research Quarterly, 41(1), 8–34. doi:10.1598/RRQ.41.1.1
- Fawson, P. C., Ludlow, B. C., Reutzel, D. R., Sudweeks, R., & Smith, J. A. (2006). Examining the reliability of Running Records: Attaining generalizable results. The Journal of Educational Research, 100(2), 113–126. doi:10.3200/JOER.100.2.113-126
- Ford, M. P., & Opitz, M. F. (2008). A national survey of guided reading practices: What we can learn from primary teachers. Literacy Research and Instruction, 47(4), 309–331. doi:10.1080/19388070802332895
- Harmey, S., & Kabuto, B. (2018). Metatheoretical differences between Running Records and miscue analysis: Implications for analysis of oral reading behaviors. Research in the Teaching of English, 53(1), 11–33.
- Johnston, P., & Afflerbach, P. (2015, September 15). Formative assessment used to its greatest advantage. [Blog post]. Retrieved from https://www.literacyworldwide.org/blog/literacy-daily/2015/09/17/formative-assessment-used-to-its-greatest-advantage
- Kragler, S., Martin, L., & Schreier, V. (2015). Investigating young children's use of reading strategies: A longitudinal study. Reading Psychology, 36(5), 445–472. doi:10.1080/02702711.2014.884031
- Mashquash, C., & O’Connor, B. P. (2006). SPSS, SAS, and MATLAB programs for generalizability theory analyses. Behavior Research Methods, 38(3), 542–547.
- Nunnally, J. C., & Bernstein, I. H. (1994). Psychometric theory (3rd ed.). New York: McGraw-Hill, Inc.
- Pinnell, G., McCarrier, A., & Button, K. (1990). Constructing literacy in early kindergartens: Progress report on the Kindergarten Early Literacy Project (Report No. 10).Columbus, OH: The Ohio State University.
- Pinnell, G. S., Lyons, C. A., Deford, D. E., Bryk, A. S., & Seltzer, M. (1994). Comparing instructional models for the literacy education of high-risk first graders. Reading Research Quarterly, 29(1), 8 doi:10.2307/747736.
- Santa, C. M., Williams, C. K., Ogle, D., Farstrup, A. E., Au, K. H., Baker, B. M., … Shanahan, T. (2000). Excellent reading teachers: A position statement of the International Reading Association. Journal of Adolescent & Adult Literacy, 44(2), 193–199.
- Shadish, W.R., Cook, T.D., & Campbell, D.T. (2002). Experimental and quasi-experimental designs for generalized causal inference. New York: Houghton Mifflin Company.
- Wang, Y., Compton-Lilly, C., & Sánchez, L. (2020). Formative reading assessments of Running Records and miscue analysis: Limits and possibilities for literacy learning. In C. Martin, D. Polly, & R. Lambert (Eds.). Handbook of research on formative assessment in Pre-K through elementary classrooms (pp. 327–345). Hershey, PA: IGI Global.