
Abstract
We examined the effects of two dams on longitudinal variation of riverine food webs using stable isotope and gut contents analyses along four rivers in the Hunter Valley in eastern Australia. Longitudinal 15N enrichment was observed in most invertebrate taxa and food sources but significant longitudinal variation was rare for 13C, and composition of gut contents of invertebrate taxa did not vary significantly with longitudinal position. Most invertebrates and food sources were more 15N-enriched at sites immediately downstream of the dams than expected from their upstream longitudinal position, a result not mirrored by gut contents and 13C. Enrichment of 15N downstream may be attributed to altered water quality as a result of impoundment but further research is necessary to elucidate whether physico-chemical riverine processes or trophic mechanisms are responsible. Our observations regarding the influence of dams on isotope ratios are contrary to the few existing studies, suggesting the small volumes relative to annual inflows of dams in the present study limit downstream impacts by maintaining aspects of flow variability.
Introduction
Understanding longitudinal variation in the contributions of different energy sources to river food webs is important for both ecological theory and river management (Gawne et al. Citation2007). The River Continuum Concept of Vannote et al. Citation(1980) suggests that the dominant food resources for primary consumers vary in a predictable manner from headwater streams to large rivers. Many authors suggest that allochthonous carbon, derived from terrestrial inputs, is the major source of energy in forested headwater streams (e.g. Gessner et al. Citation1999; Reid et al. Citation2008) and that the contribution of autochthonous carbon increases with river size (Finlay Citation2001; Hadwen et al. Citation2010a). However, natural longitudinal patterns of energy flow can be disrupted by the presence of dams in a river system. The Serial Discontinuity Concept (Stanford & Ward Citation2001) stresses the recovery of ecosystem processes downstream of major longitudinal disruptions with the natural addition of tributary inputs. Nevertheless, downstream recovery can also take place without major tributary contributions (e.g. Growns et al. Citation2009).
Stable isotope analysis (SIA) has commonly been used to reconstruct food webs and energy flow from microbes, plants and detritus to primary and secondary consumers (Peterson & Fry Citation1987; Hershey et al. Citation2006). In many ecosystems, individual food sources have different ratios of 13C:12C and 15N:14N; therefore, food assimilation by animals can be inferred from the isotopic signatures of their tissues (Fry Citation1991). However, when sources have similar or overlapping isotope ratios it can be difficult to estimate their relative contributions. Gut contents analysis (GCA) is also frequently used to investigate diets by revealing the food ingested during a short period prior to sampling (e.g. Whitledge & Rabeni Citation1997; Mantel et al. Citation2004; Li & Dudgeon Citation2008), whereas SIA can indicate which prey items are assimilated in the medium to long term (Perga & Gerdeaux Citation2005). Therefore, the two techniques are complementary means of assessing trophic linkages (Post Citation2002).
The effects of dams on the structure and function of river food webs are poorly known (Power & Dietrich Citation2002) and although some studies have investigated the effects, they show contrasting results. Angradi Citation(1993) observed enrichment of 13C and depletion of 15N in epilithon, enrichment of 13C and 15N in seston and a primary consumer, and enrichment of 15N in macrophytes compared to a nearby unregulated tributary. It was suggested that the changes in δ13C were due to a decreasing contribution of phytoplankton with downstream distance, but they could offer no explanation for the enrichment of 15N in macrophytes. In contrast, Angradi Citation(1994) observed depletion of 13C and 15N in seston in a downstream direction and no longitudinal variation in the isotopic composition of amphipods or fish for 25 km. Shannon et al. Citation(2001) observed enrichment of 13C in benthic algae, macroinvertebrates and fish up to 350 km downstream of Glen Canyon Dam but no longitudinal trends in δ15N for the same groups. Doi et al. Citation(2008) used isotope signatures of phytoplankton to suggest that they contributed to the downstream food webs for up to 10 km. Overall, while these studies evaluated differences in energy flow between regulated and unregulated rivers, they did not generally account for potential longitudinal patterns in stable isotope composition. Therefore, in order to evaluate natural variability aside from the effect of dams at various downstream locations, it is important to account for longitudinal variation in food-web dynamics simultaneously in regulated and natural, unregulated rivers.
In this study, we predicted that the presence of dams would affect invertebrate diets and the isotopic composition of invertebrates, and potential food sources in two regulated rivers. To assess this we used both SIA and GCA to determine the effects of dams on the longitudinal variation in δ13C and δ15N isotopic composition of food sources, primary consumers (and their gut contents) and invertebrate predators in regulated and unregulated rivers. We compared sites immediately downstream of dams with two unregulated rivers and unregulated sites upstream of the dams to determine whether dams influenced longitudinal variation in food-web dynamics.
Methods
Study sites
We studied four tributaries of the Hunter River in New South Wales, Australia: the Allyn, the Chichester, the Paterson and the Williams rivers (. These rivers rise on the Barrington Plateau at approximately 1500 m altitude and flow in a generally southeasterly direction. The region has primarily Carboniferous sedimentary and volcanic geology and a warm temperate climate (mean annual temperature of 18°C), with median annual rainfall of 1061–1278 mm concentrated in the austral summer (∼40% falling in January–March) but with high inter-annual variability. The upper reaches of each river lie in relatively undisturbed catchments in either a national park or state forest, whereas grazing and dairy production are the major land uses along the lower reaches. The riparian vegetation in the lower reaches is dominated by native species including river bottlebrush (Callistemon sieberi), river oak (Casuarina cunninghamiana) and spiky mat rush (Lomandra spp.) as well as exotic species including willows (Salix spp.) and giant reed (Arundo donax).
Figure1. Location of collection sites; numbers indicate reaches referred to in the text.
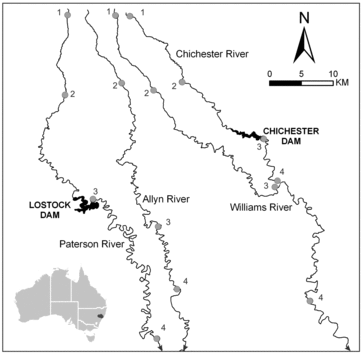
Two dams were included in the study: Chichester Dam (built in 1921, 43 m height, 21 × 106 m3 capacity) on the Chichester River which supplies water for domestic consumption and Lostock Dam (1971, 38 m height, 20 × 106 m3 capacity) on the Paterson River which supplies water for agricultural purposes (mainly irrigation). Both dams have a small operational capacity relative to annual inflow volume, so storage levels rarely fall below 80% and spills are frequent. They can develop thermal and oxygen stratification (particularly in summer because of their depth and consistently high storage levels) and discharge cold water to downstream river reaches through hypolimnetic outlets.
Four sites, each a 100 m reach, were chosen on each of the Chichester, the Paterson and the Williams rivers and three on the Allyn River (, ). One site was selected in the sub-alpine headwaters of each river at 1300 to 1480 m altitude, except for the Allyn River where difficult terrain prevented access. A second site was established within the national park or state forest on the slope reaches of each river at 240–350 m. Athird site was located immediately downstream of the Chichester and Lostock dams on the Chichester and the Paterson rivers, respectively, and at similar altitudes on the Allyn and the Williams rivers. A fourth site was established on each river at the most downstream accessible location with both pools and riffles. The fourth site on the Williams River was considered to be unaffected by the Chichester Dam because 80% of its catchment area was unregulated.
Table1. Characteristics of sites identified in .
Field sampling
We collected invertebrates and potential food sources at each site between November 2008 and March 2009. All sites were only sampled once between those months and all material was collected on the same day at each site. New leaf growth of the dominant riparian vegetation was collected by hand. Biofilm samples were collected from the pools and riffles by scrubbing rocks in a 10-L bucket filled with filtered river water and the resulting suspension being filtered through a 250-μm mesh sieve with biofilm retained by a 25-μm mesh net. Benthic organic matter was collected by washing sediment with river water and retaining organic material on graded sieves as coarse particulate organic matter (CPOM, 2–5 mm) and fine particulate organic matter (FPOM, 0.25–2 mm). Samples of filamentous algae, if present, were collected by hand from rocks.
Macroinvertebrates were collected from pools and riffles at each site with a 250-μm mesh dip net and by handpicking from rocks taken from the river bed. Representatives of the most abundant taxa at each site were immediately preserved in ethanol for GCA. Samples for SIA were stored in plastic zip-lock bags and immediately placed on ice for at least 8 hours. This procedure allowed the invertebrates to void their guts, removing unassimilated material. Samples were frozen at −20°C upon return to the laboratory prior until further processing.
Gut contents analysis
GCA followed the methods of Chessman Citation(1986). Preserved invertebrates were identified to the lowest possible taxon using keys in Hawking Citation(2000) and dissected individually under a stereomicroscope. A maximum of 10 individuals per taxa per site were examined, selected where possible to span a range of body sizes. Each specimen was washed with distilled water and, if necessary, adhering debris was removed with a small brush and forceps. Invertebrates were then dried with tissue and the thorax and abdomen were slit with fine forceps and needles. The anterior half of the digestive tract was removed, and its contents were expelled into a droplet of distilled water on a microscope slide and distributed as uniformly as practical. A cover slip was placed over the droplet which was then scanned at magnifications of 100x–400x under a compound microscope.
Food items were classified into seven categories: unidentifiable fine organics, fungi, planktonic algae, non-filamentous benthic algae (mostly diatoms), filamentous algae, plant material (wood and leaf fragments) and animals (invertebrate fragments). Inorganic material was not included in the analysis. The food categories observed in each digestive tract were ranked in the order of increasing abundance, assessed subjectively according to the area of the slide covered. Points were then awarded to each category by expressing its rank as a proportion of the sum of the ranks of all categories in the same specimen. The gut contents of 503 invertebrates from 30 taxa were examined but several of these were collected from only one or a few sites. Sixteen taxa were sufficiently abundant and distributed amongst enough sites to be included in the analysis (.
Table2. Average percentage (±1 S.E.) of the total points for seven food categories in 16 invertebrate taxa.
Stable isotope analysis
Leptocerid cases and shrimp exoskeletons were removed prior to isotope analysis. All samples were dried at 60°C for 24–48 hours, ground to a powder with a glass rod and porcelain dish, and pelletised in tin capsules. Pelletised samples were analysed for stable isotopes with a continuous flow-isotope ratio mass spectrometer (Eurovector EA3000, Milan, Italy) at Griffith University, Brisbane, Australia. The ratios (R) of the heavy isotope 13C to the light isotopes 12C and 15N to 14N were expressed in parts per thousand, relative to standards (Pee Dee belemnite limestone and atmospheric nitrogen, respectively) in delta notation according to the following equation:
Spatial patterns in consumer stable isotopes were analysed for the following invertebrate taxa or groups: Paratya australiensis, Hydropsychidae, Leptoceridae, Ephemeroptera nymphs and predators (Gyrinidae, Odonata and Megaloptera).
Statistical analysis
Differences in the gut contents between the selected taxa were tested with analysis of similarities (ANOSIM) and the Bray–Curtis dissimilarity measure (Clarke Citation1993) in the PRIMER program (Clarke & Gorley Citation2006). This was done in order to group those with similar diets for longitudinal analysis, which was necessary because of the patchy distributions of individual species. Dietary items that contributed most to significant differences were identified with similarity percentages (SIMPER) in PRIMER.
We used linear regression to assess the longitudinal changes in the importance of the gut contents of common species or groups of species with similar diets. The gut contents data (points per food category) were averaged for all individuals of a species or group at each site. Principal components analysis was used to summarise the variability in the gut contents across all sites, excluding those immediately downstream of the dams. The first principal component of the gut contents for each species or group was regressed against the distance of each site from the source of the river. If a significant longitudinal relationship was not observed, ANOSIM was used to test whether the gut contents of invertebrates collected immediately downstream of the dams were significantly different from those at the remaining sites.
Longitudinal changes in δ13C and δ15N of the invertebrate groups and potential food were also assessed with linear regression. The δ13C or δ15N values of the invertebrate groups and food at each site, excluding the sites downstream of the dams, were regressed on distance from the source of the river. If a significant relationship was observed between the distance from the source and δ13C or δ15N of an invertebrate group or food; the data were plotted with 95% confidence limits. We inferred that the dams affected the isotopic composition if the δ13C or δ15N values lay outside the confidence limits of the regression line. Where no significant longitudinal variation could be established we compared the δ13C or δ15N values between the sites immediately downstream of the dams and the remaining sites with one-way analysis of variance.
The contribution of potential food sources to primary consumers was assessed for each river reach and sites below the dams using the MixSIR mixing model (Semmens & Moore Citation2008). This algorithm carries out Bayesian analysis using sampling importance resampling and is able to explicitly account for uncertainty in the isotope source and fractionation values (Moore & Semmens Citation2008; Semmens et al. Citation2009; Jackson et al. Citation2009). Fractionation constants were estimated from the literature and were set at 0.4 ± 1.20 ‰ (μ ± S.D.) and 2.3 ± 1.61 ‰ for δ13C and δ15N, respectively (McCutchan et al. Citation2003).
Results
Gut contents analysis
The shrimp Paratya australiensis was collected at all sites except those in reaches 1 and 2 on the Chichester River and reach 1 on the Paterson and the Williams rivers (). Its gut contents consisted mainly of unidentifiable organic matter and unicellular benthic algae and contained small amounts of the remaining food types, excluding planktonic algae (). The first principal component explained 60% of the variation of the shrimp diet data and there was no significant longitudinal trend in the gut contents of P. australiensis (linear regression, F < 1.0, p > 0.10) and no difference between the sites immediately downstream of the dams and the remaining sites (ANOSIM, rho = −0.07, p = 0.82).
The baetid mayfly nymph Edmundsiops spp. was collected from all four rivers but only at five sites (). Its gut contents consisted mainly of unidentifiable organic matter and unicellular benthic algae, but a small amount of filamentous algae was also present (). The gut contents of Edmundsiops spp. were similar to those of the leptophlebid mayfly Austrophlebioides spp. at sites not immediately below the dams (rho = −0.04, p = 0.71), but significantly different from those of the leptophlebiid mayfly Nousia spp. (rho = 0.37, p = 0.003). The gut contents of the two leptophlebiid species were also significantly different (rho = 0.41, p < 0.001). SIMPER analysis identified that unicellular benthic algae (38%), unidentified fine organic material (26%) and vascular plant material (22%) contributed to the dissimilarity between Austrophlebioides spp. and Nousia spp. The gut contents of Austrophlebioides spp. contained more unicellular benthic algae and unidentified fine organic material and less vascular plant material than Nousia spp. Therefore, Edmundsiops spp. and Austrophlebioides spp. but not Nousia spp. were combined to allow sufficiently wide spatial representation for analysis of patterns in the mayfly diets. The first principal component explained 85% of the variation of the diet data and there was no significant longitudinal change in the gut contents of Edmundsiops spp. plus Austrophlebioides spp. (F = 0.12, p > 0.10) and no difference between the sites immediately downstream of the dams and the remaining sites (rho = −0.10, p = 0.97).
Hydropsychid caddisflies occurred at approximately half of the sites (), with gut contents differing significantly among species (rho = 0.30, p < 0.001). Pair-wise comparisons indicated that the gut contents of Diplectrona spp. were significantly different from those of the remaining species. SIMPER analysis identified that vascular plant material (28%), animal fragments (21%) and unicellular benthic algae (21%) contributed to the dissimilarity between the gut contents of Diplectrona spp. and the other species. The gut contents of Diplectrona spp. contained more animal and vascular plant material and less unicellular benthic algae. With combined data for all species except Diplectrona spp., the first principal component explained 87% of the variation of the diet data and there was no significant longitudinal trend in the gut contents (F = 0.34, p > 0.10) and no difference between sites immediately downstream of dams and the remaining sites (rho = 0.04, p = 0.12).
Leptocerid caddisflies were collected from all reaches except the headwater sites (). There was no significant difference in the gut contents of the species (rho = 0.08, p = 0.06). The first principal component explained 66% of the variation of the diet data but there was no significant longitudinal pattern in the gut contents of all the species combined (F = 1.7, p > 0.10) or difference between sites immediately downstream of dams and the remaining sites (rho = −0.06, p = 0.83).
Stable isotopes
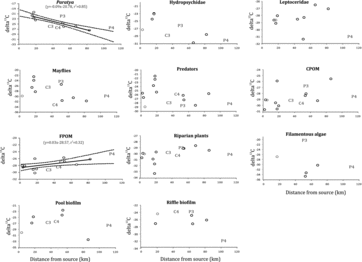
Significant longitudinal changes were observed in δ13C of P. australiensis and FPOM () but not in the other invertebrate groups and potential food sources. The δ13C values of P. australiensis decreased with increasing distance from the source (F = 18.4, p < 0.01) whereas those of FPOM increased with increasing distance from the source (F = 11.1, p < 0.01). The δ13C values of P. australiensis in reaches 3 and 4 downstream of the dams fell outside the confidence limits of the regression but in different directions, indicating no consistent dam effects. There were also no consistent dam effects on the δ13C values for FPOM at the downstream sites. The δ13C value for the filamentous algae was significantly higher downstream of the Lostock Dam than at the remaining sites (F = 11.8, p < 0.05, ) but δ13C values of other invertebrates and food sources did not differ significantly between the dam and no-dam sites (F < 2.0, p > 0.05).
Figure2. Scatterplots of mean δ13C values against the distance from the source. Regression lines with lower and upper 95th percentile confidence limits are shown for significant relationships. C3, P3, C4 and P4 refer to reaches 3 and 4 on the Chichester and the Paterson rivers, respectively.
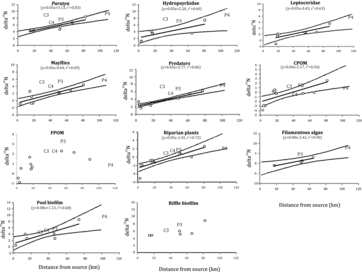
δ15N values increased with increasing distance from the water source for all invertebrate groups, CPOM, riparian plants, pool biofilm and filamentous algae (F > 17.0, p < 0.01, ). The δ15N values at reaches 3 and 4 on the Chichester River and reach 3 on the Paterson River, all within 9 km of the dams, lay above the regression confidence limits, implying significantly higher δ15N, in all cases except CPOM and pool biofilm. Incontrast, the δ15N values of those biota and potential food sources at reach 4 on the Paterson River, 56 km from the dam, fell within the confidence limits, implying the dam effect had no effect this far downstream. The δ15N values of FPOM were significantly higher at the dam sites than elsewhere (F = 6.1, p < 0.05, ). In contrast, there was no significant difference in the δ15N values of riffle biofilms between dam and no-dam sites (F = 0.7, p > 0.10).
Figure3. Scatterplots of mean δ15N values against the distance from the source. Regression lines with lower and upper 95th percentile confidence limits are shown for significant relationships. C3, P3, C4 and P4 refer to reaches 3 and 4 on the Chichester and the Paterson rivers, respectively.
Mixing model
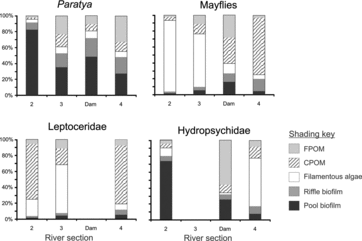
The contribution of the autochthonous sources (filamentous algae and biofilms) to the diet of P. australiensis decreased with increasing river size and was similar at dam sites compared with the same river section (section 3) on the unregulated rivers (). Similarly, allochthonous contributions to the diet of mayflies increased with increasing river size, principally due to a decrease in the filamentous algae contributions. However, the contribution of the food sources at sites downstream of the dams was different from the same section of river on the unregulated rivers. There were no consistent longitudinal patterns in the contributions of the various food sources for either Leptoceridae or Hydropsychidae.
Figure4. Median percent contribution of five potential food sources to the diets of four primary consumers in three separate river sections and sites immediately downstream of dams.
Discussion
Most invertebrate groups and potential food sources in our study rivers had significant longitudinal trends in δ15N and there was 15N enrichment downstream of the dams that exceeded expectations from the dams’ longitudinal position relative to other sites. The observation of enrichment is supported by Maxwell Citation(2010), who observed enrichment of 15N in biofilm downstream of the Chichester and Lostock dams. The processes that govern the ratios of nitrogen isotopes are complex (Hoegberg Citation1997; Nestler et al. Citation2011) but increased anthropogenic nitrogen inputs to aquatic systems often result in enrichment of 15N in biota (e.g. Costanzo et al. Citation2001). Consequently, the longitudinal 15N enrichment in our rivers may have been the result of increased agricultural land-use in their lower reaches. However, this mechanism is unlikely as Miyajima et al. Citation(2009) found no effect of land use or geology on longitudinal 15N enrichment of suspended particulate nitrogen or nitrates. Udy and Bunn Citation(2001) found 15N enrichment of aquatic macrophytes but not riparian plants at sites with greater catchment clearing. Our results for riparian plants are also in contrast with previous findings for terrestrial plants, which generally show δ15N depletion with decreasing altitude (e.g. Sah & Brumme Citation2003; Liu & Wang Citation2010).
Longitudinal changes in δ15N may be caused by several mechanisms, including isotope fractionation during in-stream nitrogen removal by denitrification and assimilation, in-stream nitrification generating isotopically different nitrogen relative to upstream sites, and external loading of isotopically different nitrogen from upstream sources (Miyajima et al. Citation2009). Information on these processes is not available for the four rivers in the present study and, consequently, the mechanisms underlying their longitudinal 15N enrichment require further investigation. Many studies suggest that dams are net exporters of nitrogen and other authors have also demonstrated enriched 15N in the biota downstream of dams (Moore et al. Citation1992; Xu et al. Citation2005; Beutel Citation2006; Duda et al. Citation2010). It is likely that the enrichment of 15N that we observed downstream of the dams is due to reservoir processes releasing isotopically enriched nitrogen compounds to downstream reaches.
In contrast to our results for δ15N, we could not detect systematic longitudinal variation in the δ13C values of the majority of invertebrates and potential food sources or effects of dams on these variables. The lack of spatial variation in δ13C is supported by our observed lack of spatial variation in the gut contents of the primary invertebrate consumers. However, we observed a decreasing contribution of autochthonous food sources to the diet of P. australiensis, which was supported by a trend of 13C depletion with increasing distance from source. The lack of longitudinal variation in δ13C values in the majority of invertebrates, CPOM, FPOM and riparian plants is consistent with the findings of Finlay Citation(2001) and Hadwen et al. Citation(2010a). However, the lack of longitudinal trends in δ13C of epilithon in the present study is in agreement with the findings of Hadwen et al. Citation(2010a) but in contrast to those of Finlay Citation(2001). The absence of longitudinal trends in biofilm δ13C in our rivers may have been due to high variability in the δ13C values among species of algae and other biota that make up the biofilm (Hadwen et al. Citation2010b). An alternative explanation is that the factors that influence fractionation of δ13C by algae, such as carbon supply and photosynthetic rates, may be too spatially or temporally (sampling took place over several months) variable across our rivers to generate consistent longitudinal patterns.
The minimal influence of dams on the δ13C values of potential food sources and biota in this study is in contrast to other studies that have demonstrated enrichment or depletion of 13C in biota downstream of dams (Angradi Citation1993, Citation1994; Shannon et al. Citation2001; Doi et al. Citation2008). The influence of the Lostock and Chichester dams on downstream δ13C values may be minor because they are small dams that spill frequently with hypolimnetic water that is infrequently released. The effects of dams on river hydrology and, therefore, ecology, vary according to the structural features of the impoundment, the purpose of the dam and how it is operated (Armitage Citation1984; Finlayson et al. Citation1994). The lack of a consistent effect of dams on 13C in the literature may reflect differing management of the dams in previous studies. However, the inconsistent effect suggests that there may be numerous mechanisms operating to influence carbon isotope dynamics and therefore δ13C values of biota.
In conclusion, longitudinal increases in 15N enrichment were observed from the headwaters to the lowland reaches of our study rivers in the majority of invertebrate groups and potential food sources, but little systematic spatial variation in gut contents or δ13C signatures was noted. Additionally, most invertebrate groups and food sources were 15N enriched immediately downstream of the dams, but the impoundment of water did not appear to influence either the gut contents of primary consumers or δ13C signatures of invertebrates and potential food. The observed 15N enrichment downstream of the dams was most likely due to the effects of reservoir processes on water chemistry and further research is required to elucidate the mechanisms responsible for the observed longitudinal trends in δ15N. Our observations regarding the influence of dams on isotope composition and energy flow are contrary to the few previous similar studies, perhaps because the dams in the present study have small operational capacities relative to annual inflows, resulting in reduced downstream impacts of regulated flow regimes relative to the size of the reservoirs in the other studies. We recommend that future studies incorporate multiple dams of different sizes or operational rules to test this hypothesis.
Acknowledgements
We thank Mark Dahm, David Hoey, David Ryan and Mark Simons for field assistance, and Rene Diocares at Griffith University for analysing the stable isotope samples. Dr Darren Ryder and anonymous reviewers are thanked for comments on the manuscript.
Funding
This study was jointly funded by the Land and Water Australia Innovation Grant Scheme and the New South Wales Offices of Water and Environment and Heritage.
References
- Angradi T. 1993. Stable carbon and nitrogen isotope analysis of seston in a regulated Rocky Mountain river, USA. Regulated Rivers: Res Manag. 8:251–270.
- Angradi T. 1994. Trophic linkages in the lower Colorado River: multiple stable isotope evidence. JNorth Am Benthological Soc. 13:479–495.
- Armitage PD. 1984. Environmental changes induced by stream regulation and their effect on lotic macroinvertebrate communities. In: Lillehammer AL, Saltveit SJ, editors. Regulated rivers. Oslo: Universitetsforlaget; p. 139–165.
- Beutel M. 2006. Inhibition of ammonia release from anoxic profundal sediments in lakes using hypolimnetic oxygen. Ecological Eng. 28:271–279.
- Chessman BC. 1986. Dietary studies of aquatic insects from two Victorian rivers. Aust J Mar Freshwater Res. 37:129–146.
- Clarke KR. 1993. Non-parametric multivariate analyses of changes in community structure. Aust J Ecol. 18:117–143.
- Clarke KR, Gorley RN. 2006. PRIMER v6: user manual/tutorial. Plymouth (UK): PRIMER-E.
- Costanzo SD, O’Donohue MJ, Dennison WC, Loneragan NR, Thomas M. 2001. A new approach for detecting and mapping sewage impacts. Mar Pollut Bull. 42:149–156.
- Doi H, Chang K, Ando T, Imai H, Nakano S, Kajimoto A, Katano I. 2008. Drifting plankton from a reservoir subsidize downstream food webs and alter community structure. Oecologia. 156:363–371.
- Duda JJ, Coe HJ, Morley SA, Kloehn KK. 2010. Establishing spatial trends in water chemistry and stable isotopes (δ15N and δ13C) in the Elwha River prior to dam removal and salmon recolonization. River Res Appl. 27:1169–1181.
- Finlay JC. 2001. Stable-carbon-isotope ratios of river biota: implications for energy flow in lotic food webs. Ecology. 82:1052–1064.
- Finlayson BL, Gippel CJ, Brizga SO. 1994. Effects of reservoirs on downstream habitat. Water. August: 15–20.
- Fry B. 1991. Stable isotope diagrams of freshwater food webs. Ecology. 72:2293–2297.
- Gawne B, Merrick C, Williams DG, Rees G, Oliver R, Bowen PM, Treadwell S, Beattie G, Ellis I, Frankenberg J, Lorenz Z. 2007. Patterns of primary and heterotrophic productivity in an arid lowland river. River Res Appl. 23:1070–1087.
- Gessner MO. Chauvet E, Dobson M. 1999. A perspective on leaf litter breakdown in streams. Oikos. 85:377–384.
- Growns I, Reinfelds I, Williams S, Coade G. 2009. Longitudinal effects of a water supply reservoir (Tallowa Dam) on downstream water quality, substrate and riffle macroinvertebrate assemblages in the Shoalhaven River, Australia. Mar Freshwater Res. 60:594–606.
- Hadwen WL, Fellows CS, Westhorpe DP, Rees GN, Mitrovic SM, Taylor B, Baldwin DS, Silvestera E, Croome R. 2010a. Longitudinal trends in river functioning: patterns of nutrient and carbon processing in three Australian rivers. River Res Appl. 26:1129–1152.
- Hadwen WL, Spear M, Kennard MJ. 2010b. Temporal variability in benthic algal δ13C signaturesinfluences assessments of carbon flows in stream food webs. Hydrobiologia. 651:239–251.
- Hawking JH. 2000. A preliminary guide to keys and zoological information to identify invertebrates from Australian inland waters. 2nd ed. Wodonga: Murray-Darling Freshwater Research Centre.
- Hershey AE, Fortino K, Peterson BJ, Ulseth AJ. 2006. Stream food webs. In: Lamberti G, Hauer R, editors. Methods in stream ecology. San Diego: Academic Press/Elsevier; p. 637–659.
- Hoegberg P. 1997. Tansley review no. 95. 15N natural abundance in soil–plant systems. New Phytologist. 137:179–203.
- Jackson AL, Inger R, Bearhop S, Parnell A. 2009. Erroneous behaviour of MixSIR, a recently published Bayesian isotope mixing model: a discussion of Moore & Semmens (2008). Ecology Lett. 12:1–5.
- Li AOY, Dudgeon D. 2008. Food resources of shredders and other benthic macroinvertebrates in relation to shading conditions in tropical Hong Kong streams. Freshwater Biol. 53:2011–2025.
- Liu X, Wang G. 2010. Measurements of nitrogen isotope composition of plants and surface soils along the altitudinal transect of the eastern slope of Mount Gongga in southwest China. Rapid Commun Mass Spectrom. 24:3063–3071.
- Mantel SK, Salas M, Dudgeon D. 2004. Foodweb structure in a tropical Asian forest stream. J North Am Benthological Soc. 23:728–755.
- Maxwell S. 2010. The effects of river regulation and response of invertebrates to a pulse flow release in the upper Hunter catchment, NSW [ PhD thesis]. Armidale: University of New England.
- McCutchan JH, Lewis WM, Kendall C, McGrath CC. 2003. Variation in trophic shift for stable isotope ratios of carbon, nitrogen, and sulphur. Oikos. 102:378–390.
- Miyajima T, Yoshimizu C, Tsuboi Y, Tanaka Y, Tayasu I, Nagata T, Koike I. 2009. Longitudinal distribution of nitrate (δ15N and δ18O) in two contrasting tropical rivers: implications for instream nitrogen cycling. Biogeochemistry. 95:243–260.
- Moore JW, Semmens BX. 2008. Incorporating uncertainty and prior information into stable isotope mixing models. Ecol Lett. 11:470–480.
- Moore P, Reddy K, Graetz D. 1992. Nutrient transformations in sediments as influenced by oxygen supply. J Environ Qual. 21:387–393.
- Nestler A, Berglund M, Accoe F, Duta S, Xue D, Boeckx P, Taylor P. 2011. Isotopes for improved management of nitrate pollution in aqueous resources: review of surface water field studies. Environ Sci Pollut Res. 18:519–533.
- Perga ME, Gerdeaux D. 2005. Are fish what they eat all year round? Oecologia. 144:598–606.
- Peterson BJ, Fry B. 1987. Stable isotopes in ecosystem studies. Annu Rev Ecol Syst. 18:293–320.
- Post DM. 2002. Using stable isotopes to estimate trophic position: models, methods, and assumptions. Ecology. 83:703–718.
- Power ME, Dietrich WE. 2002. Food webs in river networks. Ecological Res. 17:451–471.
- Reid DJ, Quinn GP, Lake PS, Reich P. 2008. Terrestrial detritus supports the food webs in lowland intermittent streams of south-eastern Australia: a stable isotope study. Freshwater Biol. 53:2036–2050.
- Sah SP, Brumme R. 2003. Altitudinal gradients of natural abundance of stable isotopes of nitrogen and carbon in the needles and soil of a pine forest in Nepal. J For Sci. 49:19–26.
- Semmens BX, Moore JW. 2008. MixSIR: a Bayesian stable isotope mixing model. Available from: http://www.ecologybox.org
- Semmens BX, Moore JW, Ward EJ. 2009. Improving Bayesian isotope mixing models: a response to Jackson. Ecol Lett. 12:6–8.
- Shannon J, Blinn D, Haden G, Benenati E, Wilson K. 2001. Food web implications of 13C and 15N variability over 370 km of the regulated Colorado River, USA. Isotopes Environ Health Stud. 37:179–191.
- Stanford JA, Ward JV. 2001. Revisiting the serial discontinuity concept. Regulated River: Res Manage. 17:303–210.
- Stein JL, Hutchinson MF, Stein JA. 2007. Statewide modelling of natural flow and upstream water allocations – report to Water Resources Division, NSW Department of Natural Resources. Canberra (Australia): Australian National University, The Fenner School of Environment and Society.
- Udy JW, Bunn SE. 2001. Elevated delta N-15 values in aquatic plants from cleared catchments: why? Mar Freshwater Res. 52:347–351.
- Vannote RL, Minshall GW, Cummins KW, Sedell JR, Cushing CE. 1980. The river continuum concept. Can J Fish Aquatic Sci. 37:130–137.
- Whitledge GW, Rabeni CF. 1997. Energy sources and ecological role of crayfishes in an Ozark stream: insights from stable isotopes and gut analysis. Can J Fish Aquatic Sci. 54:2555–2563.
- Xu J, Xie P, Zhang M, Yang H. 2005. Variation in stable isotope signatures of seston and a zooplanktivorous fish in a eutrophic Chinese lake. Hydrobiologia. 541:215–220.