
Abstract
Winter can be a stressful period for stream-dwelling salmonid populations, often resulting in reduced growth and survival. Stream water temperatures have been identified as a primary mechanism driving reductions in fitness during winter. However, groundwater inputs can moderate water temperature and may reduce winter severity. Additionally, seasonal reductions in prey availability may contribute to decreased growth and survival, although few studies have examined food webs supporting salmonids under winter conditions. This study employed diet, stable isotope, and mark-recapture techniques to examine winter (November through March) feeding, growth, and condition of brown trout Salmo trutta in a groundwater-dominated stream (Badger Creek, Minnesota, USA). Growth was greater for fish ≤ 150 mm (mean = 4.1 mg g−1 day−1) than for those 151–276 mm (mean = 1.0 mg g−1 day−1) during the winter season. Overall condition from early winter to late winter did not vary for fish ≤150 mm (mean relative weight (Wr) = 89.5) and increased for those 151–276 mm (mean Wr = 85.8 early and 89.4 late). Although composition varied both temporally and by individual, brown trout diets were dominated by aquatic invertebrates, primarily Amphipods, Dipterans, and Trichopterans. Stable isotope analysis supported the observations of the dominant prey taxa in stomach contents and indicated the winter food web was supported by a combination of allochthonous inputs and aquatic macrophytes. Brown trout in Badger Creek likely benefited from the thermal regime and increased prey abundance present in this groundwater-dominated stream during winter.
Introduction
Winter can be a stressful time for stream-dwelling salmonids, as evidenced by reduced growth rate, condition, and survival (Quinn & Peterson Citation1996; Schultz & Conover Citation1999; Post & Parkinson Citation2001). In particular, winter ice formation can be a significant stressor for stream-dwelling trout. Surface and anchor ice can decrease the amount of available habitat for trout through reductions in physical space and the formation of ice dams (Chisholm et al. Citation1987; Brown et al. Citation2011). Biro et al. Citation(2004) found that overwinter mortality of age-0 fish (60–80%) due to depleted lipid reserves was a primary limiting factor for rainbow trout, Oncorhynchus mykiss, recruitment. Winter conditions often cause stream-dwelling salmonids to alter behaviors as well as habitat preferences and can lead to reductions in foraging and general activity levels (Huusko et al. Citation2007).
The brown trout, Salmo trutta, is a stream-dwelling salmonid that inhabits a range of habitats encompassing a wide variety of physical variation in winter stream conditions. As such, brown trout populations can experience a range of winter severity dependent on the physical characteristics of a particular stream. Brown trout in the Credit River, Ontario (Canada), and the River Dodder (Ireland) experienced depressed growth rates and reductions in condition over winter (Cunjak & Power Citation1987; Cunjak et al. Citation1987; Kelly-Quinn & Bracken Citation1990). Age-0 brown trout had significantly reduced monthly survival rates during winter than during summer (0.65 vs. 0.99) in a small southeastern Norwegian stream (Lund et al. Citation2003).
In contrast, some studies suggest winter may be no more stressful for brown trout than other seasons. Survival rates of stream-dwelling brown trout in winter were equal to or greater than other seasons in 11 of 16 cases reviewed by Carlson et al. Citation(2008). Similarly, brown trout experienced positive growth and low over-winter mortality in three groundwater-dominated streams in southeastern Minnesota (Dieterman & Hoxmeier Citation2011; Dieterman et al. Citation2012). Although winter severity appears to vary, differences in stream thermal regime have the potential to influence the degree to which brown trout may be affected in winter.
Reductions in growth and condition during winter are generally attributed to the effects of decreased temperature on brown trout physiology with a minimum temperature of approximately 3.6°C required for growth (Elliott et al. Citation1995). Water temperatures in surface water-dominated streams closely track air temperatures and often drop below 3.6°C in temperate locales during winter (Pilgrim et al. Citation1998). However, the temperature of groundwater is approximately equal to mean annual air temperature (Erickson & Stefan Citation2000). Groundwater input has a buffering effect on stream thermal regime, and can maintain water temperatures within acceptable ranges for brown trout growth even when air temperatures drop below freezing (Power et al. Citation1999; O’Driscoll & DeWalle Citation2004, Citation2006; Krider et al. Citation2013). The elevated winter temperatures of groundwater-dominated streams may allow brown trout to maintain higher activity levels and more efficient functioning of metabolic processes.
Although water temperature may directly affect fish during winter, reductions in prey availability and quality (e.g., terrestrial invertebrate and aquatic invertebrate emergence and drift) may have additional implications for brown trout growth and condition. Summer diets of brown trout frequently include a significant proportion of terrestrial invertebrates (Kelly-Quinn & Bracken Citation1990; Bridcut & Giller Citation1995; Kawaguchi & Nakano Citation2001), but these prey are often unavailable to trout during the winter. Aquatic invertebrates comprise the bulk of stream trout diets during winter (Cunjak et al. Citation1987; Kelly-Quinn & Bracken Citation1990) but aquatic invertebrate abundance can be reduced during the winter season (Newman & Waters Citation1984; Gislason Citation1985; Rundio & Lindley Citation2008). Dieterman et al. Citation(2004) suggested differences in annual growth among brown trout populations in groundwater-dominated southeastern Minnesota streams were driven by differences in prey availability. Thus, declines in aquatic invertebrate availability have the potential to negatively affect stream trout foraging and growth.
The presence of seasonally available aquatic invertebrate species can increase the relative abundance of aquatic invertebrates in groundwater-dominated streams relative to surface-water dominated streams during winter (Bouchard & Ferrington Citation2009). The contributions of these seasonally available aquatic invertebrates to winter groundwater-dominated stream food webs are not well understood, but an increase in the relative abundance of potential prey may benefit brown trout within these systems.
Analysis of stomach contents has traditionally been used to examine trophic relationships, which allows for quantification of the contribution of specific prey taxa. However, stomach contents offer only a snapshot (dependent on stomach evacuation rate) of long-term patterns in diet. Conversely, stable isotope analysis (SIA) offers a time-integrated method of examining trophic relationships between consumers and their prey by examining ratios of stable carbon (δ13C) and nitrogen (δ15N) isotopes incorporated into the consumer's tissue (Peterson & Fry Citation1987). δ13C is commonly used to determine energy sources in fishes (Peterson & Fry Citation1987) because δ13C signatures of prey are passed on to predators with a predictable enrichment of approximately 0.4‰. Thus, δ13C can be used to track energy flow through the food web and compare the relative importance of various prey taxa. Trophic level can be inferred via δ15N with about a 3.4‰ increase in δ15N typically observed between predators and prey (Vander Zanden et al. Citation1997). The combination of taxonomically specific diet data from stomach contents with energy flow information from SIA provides a more complete picture of an organism's position in the food web (Chipps & Garvey Citation2002).
The goal of this study was to evaluate the effects of winter conditions (here defined as November through March) on a brown trout population in a groundwater-dominated stream. Brown trout growth and condition were chosen as metrics to examine the effects of winter. Additionally, brown trout diet and relative position in the winter aquatic food web were quantified to examine potential mechanisms, affecting growth and condition. The objectives of this study were to (1) quantify and compare patterns of brown trout growth and condition during the winter season in a groundwater-dominated stream, (2) quantify the contributions of aquatic invertebrates to brown trout diets during winter using stomach contents and SIA, and (3) quantify the relative position of brown trout within the winter aquatic food web of a groundwater-dominated stream using SIA. Diet composition and growth were tracked using uniquely marked individuals, allowing relationships between diet and growth to be examined.
Methods
Study site
Badger Creek is a groundwater-dominated tributary (i.e., receives enough groundwater input to significantly alter stream thermal regime and prevent over-winter freezing) of the Root River, located in southeastern Minnesota, USA (Krider et al. Citation2013). The region is characterized by karst geology, including a large number of groundwater-dominated streams that support cold-water fish assemblages. Brown trout are the most abundant fish species in Badger Creek, but native brook trout Salvelinus fontinalis and slimy sculpin Cottus cognatus are also present. The sampling site consisted of a 125-m reach of stream containing multiple pools, riffles, and runs located in a forested headwater section of Badger Creek. Stream wetted width was approximately 3 m and mean depth was <1 m. Stream water temperature (7–9°C) was measured hourly from November 2011 through March 2012 by a remote logger device (HOBOTM, Onset Computer Corporation, http://www.onsetcomp.com) and remained within ranges suitable for brown trout growth throughout the winter (Elliott et al. Citation1995). The logger device was positioned 20 cm below the surface at the head of a pool in the approximate middle of the sampling reach.
Fish collection, growth, and condition
Brown trout were collected from Badger Creek on 19 November 2011 (early winter; 131 fish) and 15 March 2012 (late winter; 139 fish) using a backpack electrofisher (Smith Root® LR-20B, http://www.smith-root.com). Fish were placed in in-stream holding pens, anesthetized with an immobilizing dose of tricaine methanesulfonate (MS 222; Argent Chemical Laboratories, http:// www.argent-labs.com), weighed (±1 g) and measured for total length (TL, ±1 mm). All fish collected on 19 November were tagged in the anterior portion of the body cavity with 9 mm passive integrated transponder (PIT) tags (Biomark Inc., http://www.biomark.com) to track growth (mg g−1 day−1) and condition between sampling events. Relative weight (Wr) compares the weight at length of a fish to a regionalized standard for that species and was used as an index of fish condition. Values between 80 and 100 are generally considered acceptable for healthy populations (Anderson & Neumann Citation1996). Condition was only analyzed for fish ≥140 mm TL because of limitations of the standard weight equations for lotic brown trout established by Milewski and Brown Citation(1994).
Diet analysis
Gastric lavage was used on 30 fish per sampling date to examine diet composition. The subsample of 30 fish was selected randomly on 19 November, but 23 fish with PIT tags were preferentially selected on 15 March to quantify diet and growth. Stomach contents were preserved in 95% ethanol in the field, and later processed in the laboratory. Aquatic invertebrates were identified to family or genus and counted. Dry weight of aquatic invertebrates in the diet were estimated with equations from Benke et al. Citation(1999) and Méthot et al. Citation(2012). Mean morphological measurements of aquatic invertebrates (body length, shell width) were calculated from subsamples of 20 individuals per taxon randomly selected from brown trout diets and used to estimate dry weight. Dry weight estimates were multiplied by taxa counts to obtain dry weight composition of diet for each fish.
Stable isotope analysis
The ability of SIA to integrate consumer diet history over a broad time interval can provide a comprehensive food web depiction when used with stomach contents. Growth rates can affect assimilation and turnover rates of 13C and 15N (Church et al. Citation2009) and the specific tissue to use for SIA must be carefully considered. Use of SIA in winter has been rare because of the potential for low tissue turnover rates. Muscle and fin tissue have 13C and 15N turnover rates > 140 days half-life, whereas mucus is especially suited to slow growth conditions because of more rapid turnover rate (∼30 days half-life) and continual regeneration (Church et al. Citation2009; Hanisch et al. Citation2010). Thus, use of mucus and fin tissue with differing turnover rates allow for temporal comparisons of brown trout diet. The faster turnover rate of mucus reflects consumption during winter, whereas the slower turnover rate of fin tissue reflects material consumed within winter, autumn, and late summer.
Pectoral fin tissue and mucus were collected following Church et al. Citation(2009) from the subsample of 23 fish subjected to gastric lavage on 15 March for SIA. Additionally, SIA was conducted for 20 individuals on 15 March from each of the five most common prey taxa observed on 19 November, and samples of allochthonous (leaf litter) and autochthonous (Spirogyra sp., Nasturtium sp.) primary producers collected throughout the sampling reach.
Prior to analysis, fish fin, invertebrate, and plant samples were rinsed with deionized water, placed in individual aluminum trays and dried at 55°C for 72 h. After drying, samples were homogenized into a fine powder with a stainless steel rod, and stored in individually labeled glass scintillation vials. Subsamples were weighed for SIA and placed into individual tin capsules. Fish mucus was prepared according to the process outlined in Church et al. Citation(2009). A single, composite sample was prepared for each aquatic invertebrate and plant taxon from individuals collected throughout the sampling reach, whereas fish fin and mucus samples were analyzed individually. Samples were sent to the University of California Davis Stable Isotope Facility (http://stableisotopefacility.ucdavis.edu/index.html) and analyzed for δ13C and δ15N using a PDZ Europa ANCA-GSL elemental analyzer interfaced to a PDZ Europa 20–20 isotope ratio mass spectrometer (Sercon Ltd., http://www.sercongroup.com). A subset of samples were analyzed at the University of Minnesota Stable Isotope Laboratory (http://www.geo.umn.edu/orgs/sil/index.html) using a Costech 4010 Elemental Analyzer interfaced to a Finnigan MAT252 Mass Spectrometer (Costech Analytical Technologies Inc., http://www.costechanalytical.com) as a quality control measure.
Statistical analysis
Growth, condition, and diet were compared for small (≤ 150 mm) and large (151–276 mm) brown trout. These size categories correspond to age 0 and age 1+ fish collected from similar streams in the region (Dieterman et al. Citation2012). Growth rate was measured directly for PIT-tagged individuals by calculating the change in mass between sampling events and compared between small and large brown trout with a Student t-test. The relationships between growth and dry weight of prey consumed, as well as growth and brown trout TL, were examined with linear regression. The differences of Wr for small and large brown trout were compared between early and late winter with a paired t-test.
Diet composition was examined by size class and sampling date and non-metric multidimensional scaling (NMS) was used to examine patterns in diet composition by number. Nine variables (size class, sample period, and mean consumption of Chironomidae, Gammarus, Physella, Limnephilidae, Glossosoma, Tipulidae, and other invertebrates consumed) were used in the NMS ordination.
δ15N and δ13C for small and large brown trout were analyzed separately by tissue (mucus and fin) and compared with an ANOVA (model: N or C = size class). NMS was performed in PC-ORD (V. 6.0, http://people.oregonstate.edu/∼mccuneb/pcord.htm). All other analyses were performed in Program R (V 2.15.1, http://www.r-project.org/). Statistical significance was declared at α = 0.05. Although sample size for some treatment groups was small (n = 10–12), data were evaluated for normality before analyses were conducted with a series of Shapiro-Wilks normality tests (Shapiro & Wilk Citation1965). All treatment groups were normally distributed.
Results
Growth, condition, and water temperature
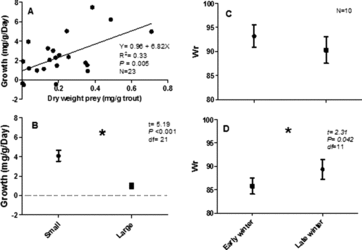
Growth during the winter was measured for the 23 fish recaptured during the late sampling event. Both small (n = 11) and large (n = 12) brown trout grew throughout the winter season and there was a negative relationship between growth and TL (). There was a positive relationship between growth and dry weight of prey consumed by fish on the March sampling date ((a)). Small brown trout (mean = 4.09 mg g−1 day−1) grew significantly faster than large brown trout (mean = 1.00 mg g−1 day−1; t22 = 5.19, p < 0.001; (b)). Overall condition from early winter to late winter did not vary for small brown trout (mean Wr = 89.5, (c)) and increased for large brown trout (mean Wr = 85.8 early, 89.4 late; t11 = 2.31, p = 0.042; (d)). Water temperature was within the range suitable for brown trout growth throughout the study (minimum temp = 5.5°C, maximum temp = 11.1°C, mean temp = 7.8°C).
Figure 1. Relationship between growth rate (mg g−1 day−1) and total length (TL) of brown trout recaptured in Badger creek on 15 March 2012.
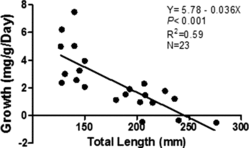
Figure 2. Results from marked and recaptured fish in Badger Creek: (a) relationship between growth rate (mg g−1 day−1) and dry weight (mg g trout−1) of prey consumed, (b) mean growth rates of large (150–276 mm TL) and small (≤150 mm TL) brown trout, mean relative weight (Wr) of (c) small (≤150 mm TL) and (d) large (>150–276 mm TL) brown trout in early winter and late winter. An * indicates a significant difference (p < 0.05).
Diet analysis
Brown trout diets in Badger creek were dominated by aquatic invertebrates but small numbers of fish (cannibalized brown trout, n = 2) and terrestrial invertebrates (i.e., annelid worms) were also present (). Only 1.6% of all sampled fish had empty stomachs. Brown trout diet composition varied temporally, but was similar between size classes. NMS (stress = 11.02; instability < 0.001; iterations = 71) explained significant variation along the first two axes (axis 1, r2 = 0.468; axis 2, r2 = 0.191; ). Significant variables for axis 1 included sample period (r = −0.76), Chironomidae consumed (r = −0.75), other invertebrates consumed (r = −0.61), Glossosoma consumed (r = −0.68), and Limnephilidae consumed (r = 0.345). Significant variables for axis 2 included Glossosoma consumed (r = 0.66), and Chironomidae consumed (r = −0.56).
Table 1. Mean prey number (n) and mg dry weight (DW; ± 1 SE) of stomach contents for small (≤150 mm) and large (>151–276 mm) brown trout in Badger Creek on 19 November 2011 (November) and 15 March 2012 (March).
Figure 3. Non-metric multidimensional scaling ordination of diet composition for small (≤150 mm) and large (151–276 mm) brown trout in Badger Creek. Closed squares represent large fish in early winter; closed circles represent small fish in early winter. Open squares represent large fish in late winter; open circles represent small fish in late winter.
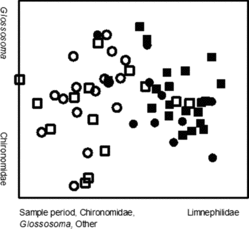
Figure 4. Carbon nitrogen bi-plot of mean (± 1 SD) δ13C and δ15N signatures for small (≤150 mm TL) and large (151–276 mm TL) brown trout, and integrated δ13C and δ15N signatures for common invertebrate prey taxa, and primary producers for (a) fin tissue and (b) mucus samples.
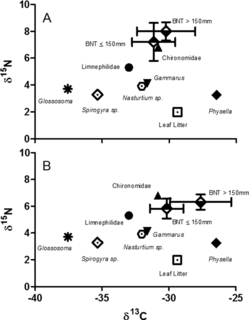
Stable isotope signatures of brown trout varied by tissue type and size class and supported the overall patterns observed in gastric lavage samples (). Leaf litter had higher δ13C (−29.4‰) compared to Spyrogyra (−35.3‰) and Nasturtium spp. (−32.0‰). Aquatic invertebrate δ13C indicated reliance on leaf litter and/or Nasturtium sp., with the exception of Glossosoma, which had low values (−37.6‰) consistent with an algal-based diet in headwater streams (Finlay Citation2001). The similarity of brown trout δ13C to Gammarus, Chironomidae, Physella, and Limnephilidae δ13C suggests the importance of these taxa to brown trout diets, whereas the dissimilar δ13C of Glossosoma suggests lesser importance. δ15N and δ13C between large (mean δ15N = 7.9‰, δ13C = −30.2‰) and small (mean δ15N = 7.2‰, δ13C = −31.1‰) brown trout were not significantly different for fin tissue samples. However, δ13C values were significantly different for large (mean δ13C = −27.6‰) and small (mean δ13C = −30.2‰) brown trout mucus samples (F1,23 = 10.61, p < 0.01) indicating a greater reliance on more enriched prey during winter (e.g., Physella) by large brown trout. Large (mean δ15N = 6.3‰) and small (mean δ15N = 5.8‰) brown trout δ15N values were not significantly different suggesting both size classes occupy similar trophic levels.
Discussion
Growth, condition, and diet
Both small and large brown trout in Badger Creek fed and grew throughout the winter season. Dieterman et al. Citation(2012) also observed overwinter growth (0.1 mm day−1) in three groundwater-dominated southeastern Minnesota streams. In contrast, brown trout did not grow overwinter in the Credit River, a Canadian tributary to Lake Ontario (Cunjak & Power Citation1987), and in a tributary of the River Dodder, Ireland (Kelly-Quinn & Bracken Citation1988). Brown trout in West Brook (Massachusetts, USA) also experienced little or no growth between September and March (Carlson et al. Citation2007). Dissimilar stream temperature regimes in Badger Creek, the Credit River, and West Brook may explain differences in growth. Water temperature in Badger Creek remained significantly warmer (minimum temperature >5.9°C) throughout the winter than in the Credit River (minimum temperature 0.1°C) and West Brook (minimum temperature <0.0°C). Water temperatures were not recorded in the River Dodder, but mean January air temperature was 3.9°C during the study. Although elevated water temperatures prevented ice formation in Badger Creek, Cunjak and Power Citation(1987) documented surface ice cover of up to 22% in the Credit River during their study period. The prevention of ice formation in Badger Creek may have benefited brown trout by eliminating associated reductions in available habitat and foraging opportunities.
Growth in large brown trout may slow as they approach maximum size. Brown trout up to 388 mm were collected from the sampling reach during this study. The largest individual used in our analyses was 276 mm, whereas the majority of large brown trout were between 150 and 250 mm. Growth rates for large brown trout in Badger Creek may have decreased as trout approached their maximum size; however, the largest fish used in analyses was only ∼70% of the TL of the largest fish captured from within the sampling reach.
Mature brown trout invest substantial amounts of energy into gamete production, and sexual maturation may have influenced growth and condition of large fish in our study. Brown trout in southeastern Minnesota typically spawn in October, and the majority of redds are constructed by early November (Stefanik & Sandheinrich Citation1999; Doug Dieterman, Minnesota DNR, unpublished data). Late spawning between sampling events may have reduced growth rates of some mature fish because of gamete production and increased activity levels. However, variation in growth rates of large brown trout was considerably less than in small (immature) brown trout, suggesting that most large brown trout had similar resources available for growth.
Condition of brown trout in Badger Creek remained stable or increased during winter for small and large fish (late winter mean Wr = 90.3 for small and 89.4 for large fish). In contrast, brown trout experienced a substantial decrease in condition by the end of winter in the Credit River (Cunjak et al. Citation1987) and River Dodder (Kelly-Quinn & Bracken Citation1990) where stream thermal regimes approached freezing. As an autumn spawning species, mature brown trout condition should be reduced following spawning. Surprisingly, no significant change in condition was observed for small brown trout, and large brown trout increased condition between sampling dates in Badger Creek. The ability of brown trout to maintain condition and recoup potential body mass losses from spawning may have reduced demand on energy reserves and provided trout with an advantage to continue growth in spring.
Diets of both small and large brown trout were dominated by aquatic invertebrates, although the abundance of specific taxa varied by trout size class and sampling date. Empty stomachs were rare in our study (1.6%), but rates as high as 15% were observed in the River Dodder during winter, suggesting possible differences in prey availability (Kelly-Quinn & Bracken Citation1990). Brown trout often display size selectivity, preferentially feeding on larger prey items (Newman & Waters Citation1984). In Badger Creek, large-bodied taxa (Gammarus, Limnephilidae, Tipulidae and Physella) comprised the majority of prey consumed by dry weight during both early and late winter. However, smaller bodied prey such as Glossosoma and Chironomidae were often abundant in the diet, especially during late winter. Small and large brown trout consumed a greater abundance of small-bodied prey items in March than in November.
The increase in small-bodied prey in brown trout diets during late winter may reflect shifts in aquatic invertebrate abundances between early and late winter. An increase in the abundance of small-bodied prey items may have increased their attractiveness to foraging brown trout, and large emergences of Chironomidae were observed before and during March sampling. Alternatively, stream trout can affect the aquatic invertebrate community's abundance and composition through predation pressure (Lepori et al. Citation2012). Brown trout predation pressure may have reduced the abundance of large-bodied prey taxa during winter in Badger Creek, forcing brown trout to consume greater numbers of small-bodied prey. Notably, although brown trout showed a substantial increase in the relative number of Glossosoma and Chironomidae consumed in late winter, these taxa contributed little dry weight in the diet because of their small size.
The significant relationship between growth and the mass of prey consumed may indicate that prey availability in winter has the potential to constrain brown trout growth in Badger Creek. Bioenergetics modeling of brown trout populations in southeastern Minnesota suggested that prey quality and availability may limit growth in groundwater-dominated streams (Dieterman et al. Citation2004). Dry weights of prey used in this analysis were obtained from diet samples collected on a single sampling date, whereas growth rates incorporate changes in mass from November through March. The ability of a snapshot of the diet to represent brown trout consumption over the entire time period during which growth was measured is a legitimate concern. Additionally, the lack of prey density estimates did not allow comparisons between prey availability and consumption in early and late winter. However, the relationship between prey consumption and overwinter growth is an interesting observation that warrants further investigation.
Stable isotope analysis and winter food web
The stable isotope analyses generally supported the results of stomach content observations. Brown trout diets in Badger Creek were dominated by aquatic invertebrates during winter, primarily by taxa using allochthonous- or aquatic macrophyte-based food sources. The relatively enriched brown trout δ13C (−30.1‰ to −27.6‰) indicate Gammarus (−31.6‰), Chironomidae (−30.8‰), and Physella (−26.5‰) may be important prey taxa. Glossosoma do not appear to contribute significantly to brown trout diet, as evidenced by the δ13C of Glossosoma (−37.6‰) and the low biomass of Glossosoma consumed by brown trout (mean dry weight = 0.4 mg) compared to Gammarus (mean dry weight = 5.14 mg) or Physella (mean dry weight = 3.09 mg). Although Glossosoma are often abundant in small streams, they are typically not primary taxa in predator diets, as their stone cases may render them less vulnerable to predation (McNeely et al. Citation2007).
δ13C of the selected prey taxa and brown trout suggest that energy in the Badger Creek food web may have been derived from a combination of autochthonous and allochthonous sources, primarily leaf litter (−29.4‰) and aquatic macrophytes (Nasturtium spp.; −32.0‰). Watercress (Nasturtium spp.) was abundant throughout the sampling site during the early winter and late winter sampling events, and contributed to primary production for the winter aquatic food web. Autochthonous algal growth (Spirogyra; –35.3‰) likely played a lesser role in the Badger Creek food web as consumer δ13C was more enriched than would be expected from an algal-based diet. Groundwater input within the site may have contributed to aquatic macrophyte growth by maintaining higher water temperatures and preventing the formation of ice cover, which allowed light to reach aquatic macrophytes during winter.
Brown trout often become piscivorous as they grow, sometimes as early as 150 mm TL (Jonsson et al. Citation1999; Garman & Nielsen Citation1982). Although only two fish (both cannibalized brown trout) were found in the 60 diet samples, the large amount of energy supplied by a single instance of piscivory makes the relative importance of fish prey to brown trout diets difficult to determine from stomach content data alone. If piscivory were an important component of brown trout diet in Badger Creek there should have been more than one trophic level of separation between brown trout and primary consumers, but brown trout δ15N indicated one trophic level (∼3.4‰) or less separation above Gammarus, Glossosoma, Limnephilidae, Chironomidae, and Physella. Additionally, there was no difference in δ15N between small and large brown trout, which would accompany an ontogenetic shift to piscivory. δ15N of brown trout from Badger Creek supported the stomach content observation that piscivory was rare, and aquatic invertebrates were the primary prey source for small and large brown trout.
Two tissue types with differing turnover rates for C and N allowed for temporal comparisons of diet of large and small brown trout. The faster turnover rate of mucus (half-life ≅30 days) reflects consumption occurring during winter, whereas the slower turnover rate of fin tissue (>140 days) reflects material consumed in late summer, autumn and winter (Church et al. Citation2009). Large brown trout had more enriched mucus δ13C than small brown trout, but δ15N was not significantly different between size classes or tissue types. The enrichment of mucus δ13C suggests diets of large and small brown trout may have diverged during winter, possibly due to Physella being more prominent in late winter diets of large brown trout. Alternatively, the differences may reflect the importance of other taxa that were not collected for SIA (e.g., Tipulidae), or a combination of Physella and other aquatic invertebrate taxa. As no corresponding increase in Physella consumption was observed in late winter stomach contents, a shift to Tipulidae or other unidentified taxa is better supported by the data. Although higher trophic level prey taxa have been observed in brown trout diets in other southeastern Minnesota streams (e.g., sculpin, Rana spp., fish eggs; W. French, unpublished data), these prey likely did not contribute substantially to brown trout diets in Badger Creek, as there was no corresponding enrichment in brown trout δ15N.
Conclusions
Although winter can be stressful for brown trout in some systems, trout in groundwater-dominated streams may benefit from stabilized annual temperature regimes and increased prey availability. Fish mucus was a useful tissue to evaluate temporal variation in SIA signatures during a period of reduced growth, especially when combined with fin tissue, which has a slow turnover rate. Brown trout in a groundwater-dominated stream continued to feed, maintained or increased their condition, and grew during the winter. Allochthonous inputs and aquatic macrophytes were the most significant sources of primary production in the winter aquatic food web of Badger Creek, supporting the majority of aquatic invertebrates and brown trout. These findings illustrate the need for further research of dynamics of trout and aquatic invertebrates of groundwater-dominated streams in winter, particularly the effects of varying amounts of groundwater input on trout population dynamics and aquatic winter food webs.
Acknowledgements
We thank the following for assistance in the field: Jane Mazack, Jenna McCullough, Jessica Miller, Lori Krider, Pat Sherman, Catherine DeGuire (University of Minnesota) and Dan Spence (MN DNR). We thank three anonymous reviewers for their beneficial comments on a previous version of this manuscript. All animals used in this study were handled according to animal use and care guidelines established by the University of Minnesota IACUC committee. Funding for this study was provided by Environment and Natural Resources Trust Fund administered by the Legislative Citizens Committee for Minnesota Resources, and the Kalamazoo Valley Chapter of Trout Unlimited. Any use of trade names is for descriptive purposes only and does not imply endorsement by the US Government.
References
- Anderson RO, Neumann RM. 1996. Length, weight, and associated structural indices. In: Murphy BR, Willis DW, editors. Fisheries techniques. Bethesda, MD: American Fisheries Society; p. 447–482.
- Benke AC, Huryn AD, Smock LA, Wallace JB. 1999. Length-mass relationships for freshwater macroinvertebrates in North America with particular reference to the southeastern United States. J North Am Benthol Soc. 18:308–343.
- Biro PA, Morton AE, Post JR, Parkinson EA. 2004. Over-winter lipid depletion and mortality of age-0 rainbow trout (Oncorhynchus mykiss). Can J Fish Aquat Sci. 61:1513–1519.
- Bouchard RW, Ferrington LC. 2009. Winter growth, development, and emergence of Diamesa mendotae (Diptera: Chironomidae) in Minnesota Streams. Environ Entomol. 38:250–259.
- Bridcut EE, Giller PS. 1995. Diet variability and foraging strategies in brown trout (Salmo trutta): an analysis from subpopulations to individuals. Can J Fish Aquat Sci. 52:2543–2552.
- Brown RS, Hubert WA, Daly SF. 2011. A primer on winter, ice, and fish: what fisheries biologists should know about winter ice processes and stream-dwelling fish. Fisheries. 36:8–26.
- Carlson SM, Hendry AP, Letcher BH. 2007. Growth rate differences between resident native brook trout and non-native brown trout. J Fish Biol. 71:1430–1447.
- Carlson SM, Olsen EM, Vollestad LA. 2008. Seasonal mortality and the effect of body size: a review and an empirical test using individual data on brown trout. Funct Ecol. 22:663–673.
- Chipps SR, Garvey J. 2002. Assessment of food habits and feeding patterns. In: Guy CS, Brown ML, editors. Analysis and interpretation of freshwater fisheries data. Bethesda, MD: American Fisheries Society; p. 473–514.
- Chisholm IM, Hubert WA, Wesche TA. 1987. Winter stream conditions and use of habitat by brook trout in high-elevation Wyoming streams. Trans Am Fish Soc. 116:176–184.
- Church MR, Ebersole JL, Rensmeyer KM, Couture RB, Barrows FT, Noakes DLG. 2009. Mucus: a new tissue fraction for rapid determination of fish diet switching using stable isotope analysis. Can J Fish Aquat Sci. 66:1–5.
- Cunjak RA, Curry A, Power G. 1987. Seasonal energy budget of brook trout in streams: implications of a possible deficit in early winter. Trans Am Fish Soc. 116:817–828.
- Cunjak RA, Power G. 1987. The feeding and energetics of stream-resident trout in winter. J Fish Biol. 31:493–511.
- Dieterman DJ, Hoxmeier RJH. 2011. Demography of juvenile and adult brown trout in streams of southeastern Minnesota. Trans Am Fish Soc. 140:1642–1656.
- Dieterman DJ, Hoxmeier RJH, Staples DF. 2012. Factors influencing growth of individual brown trout in three streams of the upper Midwestern United States. Ecol Freshwat Fish. 21:483–493.
- Dieterman DJ, Thorn WC, Anderson CS. 2004. Application of a bioenergetics model for brown trout to evaluate growth in Southeast Minnesota. Investigational Report 513. St. Paul, MN: Minnesota Department of Natural Resources.
- Elliott JM, Hurley MA, Fryer RJ. 1995. A new, improved growth model for brown trout, Salmo trutta. Funct Ecol. 9:290–298.
- Erickson T, Stefan H. 2000. Linear air/water temperature correlations for streams during open water periods. J Hydrol Eng. 5:317–321.
- Finlay JC. 2001. Stable-carbon-isotope ratios of river biota: implications for energy flow in lotic food webs. Ecology. 82:1052–1064.
- Garman GC, Nielsen LA. 1982. Piscivority by stocked brown trout (Salmo trutta) and its impact on the nongame fish community of Bottom Creek, Virginia. Can J Fish Aquat Sci. 39:862–869.
- Gislason JC. 1985. Aquatic insect abundance in a regulated stream under fluctuating and stable diel flow patterns. North Am J Fish Manage. 5:39–46.
- Hanisch JR, Tonn WM, Paszkowski CA, Scrimgeour GJ. 2010. δ13C and δ15n signatures in muscle and fin tissues: nonlethal sampling methods for stable isotope analysis of salmonids. North Am J Fish Manage. 30:1–11.
- Huusko A, Greenberg L, Stickler M, Linnansaari T, Nykänen M, Vehanen T, Koljonen S, Louhi P, Alfredsen K. 2007. Life in the ice lane: the winter ecology of stream salmonids. River Res Appl. 23:469–491.
- Jonsson N, Næsje TF, Jonsson B, Saksgård R, Sandlund OT. 1999. The influence of piscivory on life history traits of brown trout. J Fish Biol. 55:1129–1141.
- Kawaguchi Y, Nakano S. 2001. Contribution of terrestrial invertebrates to the annual resource budget for salmonids in forest and grassland reaches of a headwater stream. Freshwat Biol. 46:303–316.
- Kelly-Quinn M, Bracken JJ. 1988. Brown trout, Salmo trutta L., production in an Irish coastal stream. Aquacult Res. 19:69–95.
- Kelly-Quinn M, Bracken JJ. 1990. A seasonal analysis of the diet and feeding dynamics of brown trout, Salmo trutta L., in a small nursery stream. Aquacul Res. 21:107–124.
- Krider LA, Magner JA, Perry J, Vondracek B, Ferrington LC Jr. 2013. Air-water temperature relationships in the trout streams of Southeastern Minnesota's Carbonate-Sandstone landscape. J Am Water Resour Assoc. 0(0):1–12. DOI: 10.1111/jawr.12046
- Lepori F, Benjamin JR, Fausch KD, Baxter CV. 2012. Are invasive and native trout functionally equivalent predators? Results and lessons from a field experiment. Aquat Conserv Mar Freshwat Ecosyst. 22:787–798.
- Lund E, Olsen EM, Vøllestad LA. 2003. First-year survival of brown trout in three Norwegian streams. J Fish Biol. 62:323–340.
- McNeely C, Finlay JC, Power ME. 2007. Grazer traits, competition, and carbon sources to a headwater-stream food web. Ecology. 88:391–401.
- Méthot G, Hudon C, Gagnon P, Pinel-Alloul B, Armellin A, Poirier AT. 2012. Macroinvertebrate size–mass relationships: how specific should they be? Freshwat Sci. 31:750–764.
- Milewski CL, Brown ML. 1994. Proposed standard weight (Ws) equation and length-categorization standards for stream-dwelling brown trout (Salmo trutta). J Freshwat Ecol. 9:111–116.
- Newman RM, Waters TF. 1984. Size-selective predation on Gammarus pseudolimnaeus by trout and sculpins. Ecology. 65:1535–1545.
- O’Driscoll MA, DeWalle DR. 2004. Stream – air temperature relationships as indicators of groundwater inputs. Watershed Update (AWRA Hydrology and Watershed Management Technical Committee) 2, no. 6 (November–December).
- O’Driscoll MA, DeWalle DR. 2006. Stream – air temperatures relations to classify stream – ground water interactions in a karst setting, central Pennsylvania, USA. J Hydrol. 329:140–153.
- Peterson BJ, Fry, B. 1987. Stable isotopes in ecosystem studies. Annu Rev Ecol Syst. 18:293–320.
- Pilgrim J, Fang X, Stefan H. 1998. Stream temperature correlations with air temperatures in Minnesota: implications for climate warming. J Am Water Resourc Assoc. 34:1109–1121.
- Post J, Parkinson E. 2001. Energy allocation strategy in young fish: allometry and survival. Ecology. 84:1040–1051.
- Power G, Brown RS, Imhof JG. 1999. Groundwater and fish – insights from northern North America. Hydrol Process. 13:401–422.
- Quinn TP, Peterson NP. 1996. The influence of habitat complexity and fish size on over-winter survival and growth of individually marked juvenile coho salmon (Oncorhynchus kisutch) in Big Beef Creek, Washington. Can J Fish Aquat Sci. 53:1555–1564.
- Rundio DE, Lindley ST. 2008. Seasonal patterns of terrestrial and aquatic prey abundance and use by Oncorhynchus mykiss in a California Coastal Basin with a Mediterranean Climate. Trans Am Fish Soc. 137:467–480.
- Schultz ET, Conover DO. 1999. The allometry of energy reserve depletion: test of a mechanism for size-dependent winter mortality. Oecologia. 119:474–483.
- Shapiro SS, Wilk MB. 1965. An analysis of variance test for normality (complete samples). Biometrika. 52:591–611.
- Stefanik EL, Sandheinrich MB. 1999. Differences in spawning and emergence phenology between stocked and wild populations of brown trout in southwestern Wisconsin streams. North Am J Fish Manage. 19:148–164.
- Vander Zanden MJ, Cabana G, Rasmussen JB. 1997. Comparing trophic position of freshwater fish calculated using stable nitrogen isotope ratios (δ15N) and literature dietary data. Can J Fish Aquat Sci. 54:1142–1158.