
Abstract
Aquatic community body size distributions are highly predictable with decreasing abundance and increasing body size. This basic relationship has led to significant increases in our understanding of the internal regulation processes of aquatic communities. However, most of our understanding of the patterns of community size structure is derived from large aquatic systems with little known about the dynamics of small lakes. Processes that promote predictable, or deterministic, community size structure likely differ with levels of biodiversity and disturbance patterns, both of which frequently co-vary with ecosystem size. Here we examine the influence of lake size, fish species richness, and natural disturbance regime on fish community size structure in six small lakes (<200 ha) on Beaver Island, Michigan, USA. Fish communities in three of the six lakes exhibited a deterministic size structure and it appears that disturbance regime is the most obvious barrier to developing and/or maintaining stable and predictable community size structure. In this study, lakes with less than 10 species and lakes experiencing periodic winterkills exhibited stochastic size structure. Lake size did not show any clear relation to fish community size structure. Collectively our results shed some light on the conditions that promote (or do not promote) deterministic size structure.
Introduction
The fish assemblages of large freshwater and marine systems often show deterministic distributions of individuals among body size classes. That is, across all species and individuals there is a predictable decrease in abundance with increasing body size that is ultimately rooted in the laws of thermodynamics but more specifically are due to gape limitations, metabolic constraints, and competition for limited resources (Kerr & Dickie Citation2001; Brown & Gillooly Citation2003; White et al. Citation2007). Marine fisheries management is increasingly using community body size distributions, also known as community size spectra (CSS), to guide long-term management (Jennings Citation2005; Boldt et al. Citation2012; Garcia et al. Citation2012). The metrics (slope and elevation) that accompany CSS have been shown to be good indicators of both natural and anthropogenic changes in aquatic systems (Jennings Citation2005; Petchey & Belgrano Citation2010; Murry & Farrell Citation2014). Community size structure and its metrics may differ across environmental gradients, particularly in relation to system size and habitat complexity (Duplisea Citation2000; Holmgren & Appelberg Citation2000; Emmrich et al. Citation2011). Moreover, questions of environmental constraints on the formation of community size structure such as ecosystem size, species richness, and disturbance regimes have not been adequately addressed.
Sheldon et al. (Citation1972) were the first to recognize the very predictable and consistent (i.e., deterministic) size structure of marine plankton communities. Kerr and Dickie (Citation2001) synthesized much of the literature through the 1980s and 1990s into a formal energetic-based theory called the biomass size spectrum (). A size spectrum describes the distribution of individuals or biomass among discrete body size classes. Size spectra differ widely in form, but in aquatic studies are generally visualized as log–log plots of abundance (or normalized biomass) versus body size (White et al. Citation2007). Body size may be represented by mass, total length (TL) or equivalent spherical diameter (commonly used in plankton studies).
Figure 1. Theoretical depiction of an aquatic community size spectrum (CSS). Slope and midpoint height will be dependent on system and food web characteristics.
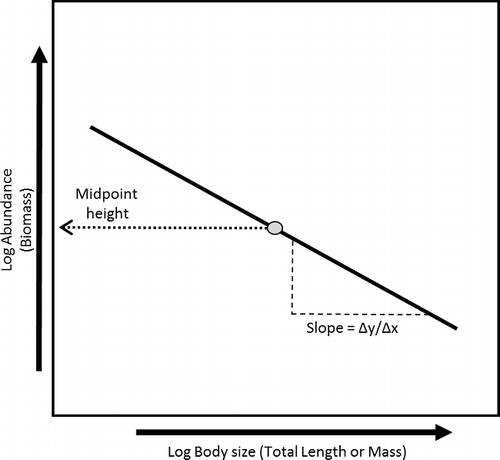
Size spectra integrate top–down and bottom–up processes, simplifies food web structure, and produces two metrics (elevation and slope) that describe food web attributes. The metrics produced by size spectra can be easily interpreted, which has led to its use as an indicator of system health (Jennings Citation2005; Garcia et al. Citation2012). The slope of the CSS serves as an indicator of food web efficiency (i.e., a more negative slope is less efficient than a shallower more positive slope), while the spectral elevation (centred y-intercept) is a proxy of food web capacity in terms of total biomass or abundance (Sweeting et al. Citation2009; Boldt et al. Citation2012; Murry & Farrell Citation2014). These metrics have been used in the detection of disturbances or perturbations (Jennings Citation2005; Sweetings et al. Citation2009; Petchey & Belgrano Citation2010; Murry & Farrell Citation2014).
Small northern temperate lakes (<200 ha) are very different from the large systems (e.g., marine systems) in which the majority of fish size spectra work has been conducted. Major differences include energy source diversity, habitat heterogeneity, total energy available, species richness, functional diversity, and ecological redundancy (Gasith & Hasler Citation1976; Tonn & Magnuson Citation1982; Post et al. Citation2000). Only recently have researchers begun to examine the fishery size spectra of smaller aquatic systems (Emmrich et al. Citation2011). Variation in species diversity in large systems (>500 ha) does not seem to affect size spectra slopes (Sprules Citation2008); however, the vast differences in the ecology of small lakes requires further investigation.
Commercial harvest is one of the most common disturbances in marine systems and is a common perturbation examined through size spectra approaches (Rice & Gislason Citation1996; Graham et al. Citation2005; Jennings Citation2005; Sweeting et al. Citation2009; Boldt et al. Citation2012: Garcia et al. Citation2012). In contrast, small lakes rarely support commercial fisheries but tend to be impacted by a wider array of perturbations including: surrounding land use changes, nutrient loading, fish stocking, recreational fishing and boating (anthropogenic effects), and natural disturbances such as winterkills and summer droughts. Because there is only limited research on small lake fish size spectra (e.g., Emmrich et al. Citation2011), it is largely unknown how CSS will respond to such disturbances. For this reason, the objectives of this study were: (1) to determine if fish communities of small lakes (<200 ha) have a predictable (i.e., deterministic) size structure; (2) to evaluate the degree of variation in small lake community size structure; and (3) to evaluate the influence of lake size, biodiversity, and disturbance regimes on fish CSS parameters.
Methods
Site description
Beaver Island is located in northeast Lake Michigan approximately 51.5 km from Charlevoix, MI, which is the closest mainland point that offers ferry or plane access to the island (). The island is approximately 21 km long and 10 km wide with an area of 144.45 km2. There are seven inland lakes on the island, of which six were sampled (Egg, Barney, Greene's, Fox, Font, and Geneserath; ) in 2009. The lakes differ greatly in habitat, especially in broad terms such as lake area, mean and maximum depth, vegetative cover, and substrate types (Clement et al. Citation2014). Similarly, the water chemistry of the lakes differs (described by Harris et al. Citation2011); however, it is unlikely that water chemistry has affected the distributions of the largely tolerant species inhabiting these lakes. Egg lake and Greene's lake are both slightly acidic bog lakes (lack in- and out-flows and are surrounded by areas of wetlands) and experience periodic winterkills (personal communication, Dr James Gillingham, Emeritus professor, Biology Department, Central Michigan University; Director of CMU Biological Station 1985–2009). The seventh lake, Round Lake, is ephemeral and was not sampled because it was dry in 2009 when this research was conducted.
Figure 2. Map of the Laurentian Great Lakes with Beaver Island MI, USA and the sampled inland lakes with the name below the lake.
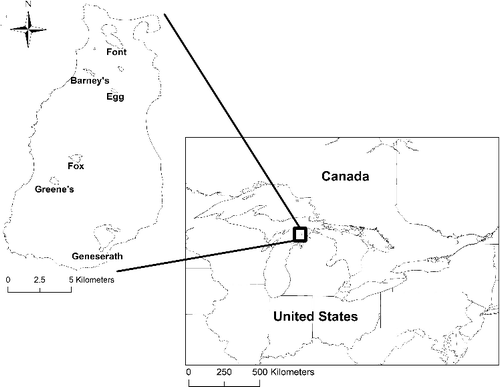
Table 1. Area (ha) and perimeter (m) of each lake sampled. Gear effort was proportional to lake perimeter. Trap nets were set over night. GLCWC is the 4.8 mm mesh trap net.
Fishing gear and sample collection
Each lake was sampled once during summer (25 June through 8 August 2009) for three to seven consecutive days. Fish were surveyed to obtain estimates of species relative abundance (catch per unit effort, CPUE) and the distribution of fish body sizes (TL, mm). Fish were sampled with shallow water trap nets and a deep water trap net. The two shallow water trap nets that were used differed only in height; they both had 4.8 mm mesh, 1 m wide frames, and 7.3 m long leads. The smaller of the two nets, 0.5 m tall frames, were fished in habitats <0.5 m deep, while the taller nets, with 1 m tall frames were fished in habitats >0.5 m but <1.5 m deep. The deep water trap net was used in habitats >1.5 m but <4 m deep and had 25.4 mm mesh and a 22.86 m long lead (Clement et al. Citation2014). These gears were chosen because they could sample all habitats and were found to capture the most species and most size classes in the sampled lakes without overlap of size classes (Clement et al. Citation2014). Identification and enumeration were made to the species-level and the TLs (mm) of all fish were measured except for small (<100 mm), highly abundant species which were sub-sampled. Sub-sampling was done by measuring the first 25 haphazardly selected individuals of a species from each net and then counting and releasing the rest of that species. This was repeated for subsequent net sets until 100 individuals of a species were measured.
Data analysis
Fish were assigned to one of twenty-five 25-mm size classes (Wilson et al. Citation2010) that varied in size from 51–650 mm (sub-sampled fish were assigned proportionally). Twenty-five mm size classes were chosen to maximize the number of size class data points for the body size versus abundance (i.e., size spectra) regressions while also maintaining a reasonable number of fish within each size class. Mean TL and CPUE were calculated for each size class. To calculate CPUE, all data from the same gear type were combined and then divided by the total number of net nights. The CPUE for each gear were added to obtain total CPUE for each lake. Mean TL and CPUE were log2 transformed to linearize the data (Jennings & Dulvy Citation2005; Emmrich et al. Citation2011). Body size data were centred (mean TL across all size classes was subtracted from the mean of each size class) to avoid correlation of the spectral slopes and elevations (Daan et al. Citation2005).
Simple linear regression was used to assess whether lakes exhibited deterministic community size structure. Specifically, we predicted a negative linear relationship between log2 mean TL and log2 CPUE consistent with larger systems. An analysis of variance slope test was used to test for significant differences in lake-specific size spectra slopes.
Results
There were 23,770 fish captured among all lakes during this study. The highest abundance of fish was captured in Font Lake (10,807) and the fewest were captured in Fox Lake (243, ). Lake Geneserath was the most species-rich lake (19 species), while Greene's Lake had only two species: yellow perch (Perca flavescens) and brown bullhead (Ameiurus nebulosus). Lake Geneserath had the largest size range (51–630 mm) with 20 TL size classes present, while Egg Lake had the smallest TL range (51–115 mm) spanning only 3 size classes.
Table 2. Total number of species caught in each lake as well as total number of all fish captured in all gears.
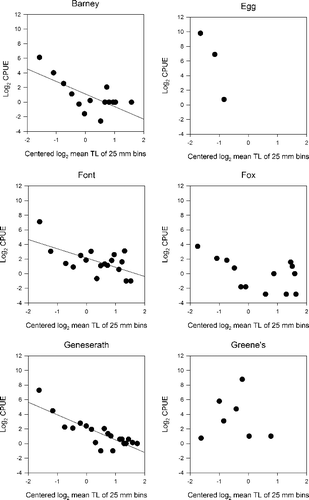
Barney Lake, Font Lake, and Lake Geneserath were the only lakes with statistically significant slopes (α = 0.05; ; ). The lake-specific slopes did not differ among the lakes with deterministic structure (F3,64 = 0.83, p = 0.485). Similarly, spectral elevations were relatively similar and had overlapping 95% confidence intervals; but qualitatively the spectral elevation increased with lake area (). In contrast, the fish assemblages of Egg and Greene's Lakes appeared to be stochastically structured. Egg and Greene's Lakes have had recent and recurring (at decadal scale) winterkills, had the lowest measured species richness (4 species and 2 species respectively), and were among the smallest of lakes in terms of area (fourth and sixth of six lakes). Fox Lake was intermediate in community size structure organization. Visually (), there is an appearance of deterministic size structure, but alpha would need to be relaxed to 0.1 and regression parameter (i.e., slope and intercepts) estimates are not different than zero ().
Table 3. Linear regression results for size spectra analysis for all lakes. An α = 0.05 was used to discern significance of regression models. More negative slope means that energy transfer from size classes is less efficient. SC denotes the number of size classes in the lake. There were a total of 25 potential size classes, in 25 mm increments ranging from 51–650 mm.
Figure 3. Size spectra regression analysis of each lake using centred log2CPUE and the log2 mean total length for all fish in each 25 mm size class. Only Font, Barney and Lake Geneserath displayed significant regression models (p-value < 0.007) and deterministic size structure.
Discussion
These data suggest that fish communities of small lakes (<200 ha) can exhibit deterministic size structure; however, there appears to be possible thresholds in terms of species richness and disturbance regimes. Higher species richness (usually associated with greater ecological redundancy) promotes stability by moderating the effects of environmental stochasticity (McGrady-Steed et al. Citation1997). The three lakes showing deterministic size structure had the highest species richness, typically had high habitat heterogeneity (depth and substrate variation), relatively large areas, and experienced no known major disturbances in recent times. This is in stark contrast to the three lakes that showed stochastic community size structure and which are known to have periodic winterkills (Egg and Greene's Lakes) and subsequently low fish diversity or had been poisoned and re-stocked in the past (Fox Lake). Natural disturbance regime and to a lesser extent species richness appear to have a stronger relation to community size structure than ecosystem size in this study.
Most of the previous studies of size spectra pertaining to fish have been done in large systems. There are few studies in which lakes have been studied and even fewer on small (<200 ha) lakes (De Leeuw et al. Citation2003; Emmrich et al. Citation2011). For this reason, sampling of smaller, understudied lakes increases the scope of data available to assess CSS dynamics. Emmrich et al. (Citation2011) found that lake area was positively correlated to the number of size classes in their size spectra. In our study, lakes exhibiting significant size spectra ranged in size between 14.3 (Barney Lake) and 192 ha (Lake Geneserath) and two of the lakes with non-significant size spectra (stochastic community size structure) were within this range (Greene's Lake at 23.9 ha and Fox Lake at 30.9 ha). This suggests that within the context of small inland lakes (<200 ha) ecosystem size was not an underlying driver of community structure; however, it may have been a secondary contributing factor.
There is relatively little information available on how species richness influences fish community size distributions, particularly in small lakes (Duplisea Citation2000; Gaedke et al. Citation2004; Sprules Citation2008). It is possible that even single species lakes show a predicable size structure as long as there is competition for limited food resources and size-based predation. However, communities with fewer species become more susceptible to environmental stochasticity decreasing the likelihood of developing stable deterministic structure. Species richness in the inland lakes of Beaver Island ranged from 2 to 19 species and a deterministic size structure was observed in all lakes with 10 or more species present, although in our study low species richness is likely a direct artefact of the disturbance regime.
Sprules (Citation2008) found that size spectra slopes between Lake Ontario and Lake Malawi did not differ greatly even though Lake Malawi has substantially greater species diversity than Lake Ontario. This suggests that species diversity has little effect on size spectra slope in large systems, or beyond some yet undetermined number of species. Similarly, Gaedke et al. (Citation2004) found that diversity of plankton had little effect on the shape of size spectra in a large (730 ha), shallow eutrophic lake. Contrary to the aforementioned studies, Duplisea (Citation2000) suggested that size spectra of the Baltic Sea benthos may be altered when one or two ecologically important species are reduced in abundance; these results suggest that as species richness decreases the likelihood of single (ecologically important) species population dynamics having a strong influence on CSS increases, as will the variability in size structure (i.e., tend toward stochastic structure).
Interestingly, Fox Lake was the third largest lake, had seven species ( and ), but the size structure of the lake was only marginally deterministic. Fox Lake was larger than Barney Lake (that was deterministically structured) suggesting that lake size did not contribute to its unpredictable structure. It is notable that Fox Lake was poisoned (rotenone) in 1961 and was restocked with a variety of species between 1961 and 1962. Of the eight species that survived over time and were present in this lake, only one of them is a strictly small bodied species (central mudminnow Umbra limi) and none of the species found are strict/exclusive planktivores. Furthermore, the majority of available prey fish for consumption by piscivorous species were all medium or large bodied spine finned fishes (). This missing food web link (i.e., small bodied soft-rayed fin species) may be an ecologically important species similar to that seen by Duplisea (Citation2000). Of the three lakes that showed deterministic size structure there was always at least one relatively abundant soft-rayed fin prey species and multiple planktivores. Alternatively, the lack of statistical ‘fit’ may be an artefact of the number of individuals sampled. Though effort was extensive (eight total netnights, ), we only captured 250 fish, whereas in all other lakes there were over 600 individuals sampled. Fish density in Fox Lake was simply low but fewer individuals could affect the precision of the sampled distribution.
Table 4. Species and their relative abundances captured for each lake.
CSS have been shown to be sensitive to commercial fishing (Jennings & Blanchard Citation2004; Shin et al. Citation2005; Sweeting et al. Citation2009) and nutrient pollution (Cottingham Citation1999). Lakes that are highly impacted by natural disturbances such as winterkills have not been studied, but we have found that they have characteristics of stochastic size structure. Both Egg Lake and Greene's Lake experienced at least decadal scale winterkills and/or summer droughts and demonstrated stochastic fish community size structure.
Greene's Lake is a shallow lake that experiences periodic winterkills. There are no stream refuges in Greene's Lake which would allow for the survival of species intolerant of low oxygen conditions. Likely due to the low winter oxygen levels and lack of refuge areas, there were only two species captured, P.flavescens and A.nebulosus. These two species can be heavily omnivorous as well as piscivorous and likely cannibalistic (Clady Citation1974). Predation and cannibalism are processes that promote deterministic size structure, whereas omnivory may reduce body size related competition and may contribute to stochastic community size structure. Winterkills would also reduce community biomass to below the carrying capacity of the system and release energetic constraints. Therefore, the presence of only two species was likely caused by the periodic winterkills and subsequently contributed to the stochastic size structure in Greene's Lake.
Egg Lake also experienced winterkills which most likely caused the low diversity of species (n = 4; again, in this observational study, it is difficult to isolate low biodiversity effects from disturbance effects). All four species caught in Egg Lake were small bodied, soft rayed non-piscivorous fish. Egg Lake is part of a large wetland complex, allowing refugia for small bodied fish. The CSS slope of this lake was extremely steep, which could have been caused by winterkills removing the largest individuals in the system. The removal of the largest individuals by winterkills is a similar disturbance to commercial fishing (seen in large systems) removing the largest individuals which also increases the steepness of the spectral slope (Graham et al. Citation2005; Sweetings et al. Citation2009; Wilson et al. Citation2010). The steepness of the slope could also have been a result of increased avian (e.g., herons and kingfishers) and possibly mammalian (e.g., mink) predation. The impact of heavy predation by avian or mammalian predators is likely not seen in other lakes because of the size of those lakes as well as the increased refuge areas from those types of predators. Wading avian predators have been shown to affect the size distributions of some fish because of size-selective feeding (Britton & Moser Citation1982; Trexler et al. Citation1994). Compounding these two possible causes of steeper slopes could be unchecked population growth due to the release from fish predation that would inflate the survival and abundance of smaller fish. Natural disturbance and low species diversity are likely the key lake characteristics inhibiting deterministic fish community size structure.
Acknowledgements
We would like to thank E. Calabro for his assistance in the field. We would also like to thank the staff at the Central Michigan University Biological Station for their support; J. Clevenger and T. Galarowicz for their field advice and use of equipment. Finally, we thank the anonymous peer reviewer whose comments improved our manuscript.
Disclosure statement
The findings and conclusions in this article are those of the authors and do not necessarily represent the views of the U.S. Fish and Wildlife Service.
Additional information
Funding
References
- Boldt JL, Bartkiw SC, Livingston PA, Hoff GR, Walters GE. 2012. Investigation of fishing and climate effects on the community size spectra of Eastern Bering Sea fish. Trans Am Fish Soc. 141:327–342.
- Britton RH, Moser ME. 1982. Size specific predation by herons and its effect on the sex-ratio of natural populations of the mosquito fish Gambusia affinis baird and girard. Oecologia. 53:146–151.
- Brown JH, Gillooly JF. 2003. Ecological food webs: high-quality data facilitate theoretical unification. Proc Natl Acad Sci USA. 100:1467–1468.
- Clady MD. 1974. Food habits of yellow perch, smallmouth bass and largemouth bass in two unproductive lakes in northern Michigan. Am Midl Nat. 91:453–459.
- Clement TA, Murry BA, Pangle K, Uzarski DG. 2014. Effectiveness of fishing gears to assess fish assemblage size structure in small lake ecosystems. Fish Manag Ecol. 21:211–219.
- Cottingham KL. 1999. Nutrients and zooplankton as multiple stressors of phytoplankton communities: evidence from size structure. Limnology Oceanography. 44:810–827.
- Daan N, Gislason H, Pope JG, Rice JC. 2005. Changes in the North Sea fish community: evidence of indirect effects of fishing?. ICES J Marine Sci. 62:177–188.
- De Leeuw JJ, Nagelkerke LAJ, Van Densen WLT, Homgren K, Jansen PA, Vijverberg J. 2003. Biomass size distributions as a tool for characterizing lake fish communities. J Fish Biol. 63:1454–1475.
- Dickie LM, Kerr SR, Boudreau PR. 1987 Size-dependent processes underlying regularities in ecosystem structure. Ecological Monogr. 57:233–250.
- Duplisea DE. 2000. Benthic organism biomass size-spectra in the Baltic Sea in relation to the sediment environment. Limnology Oceanography. 45:558–568.
- Emmrich M, Brucet S, Ritterbusch D, Mehner T. 2011. Size spectra of lake fish assemblages: response along gradients of general environmental factors and intensity of lake-use. Freshwater Biol. 56:2316–2333.
- Gaedke U, Seifried A, Adrian R. 2004. Biomass size spectra and plankton diversity in a shallow eutrophic lake. Int Rev Hydrobiologia. 89:1–20.
- Garcia SM, Kolding J, Rice J, Rochet M–J, Zhou S, Arimoto T, Beyer JE, Borges L, Bundy A, Dunn D, Fulton EA, Hall M, Heino M, Law R, Makino M, Rijnsdorp AD, Simard F, Smith ADM. 2012. Reconsidering the consequences of selective fisheries. Science. 335:1045–1047.
- Gasith A, Hasler AD. 1976. Airborne litterfall as a source of organic matter in lakes. Limnology Oceanography. 21:253–258.
- Graham NAJ, Dulvy NK, Jennings S, Polunin NVC. 2005. Size-spectra as indicators of the effects of fishing on coral reef fish assemblages. Coral Reefs. 24:118–124.
- Harris AT, Woolnough DA, Zanatta DT. 2011. Insular lake island biogeography: using lake metrics to predict diversity in littoral zone mollusk communities. J North Am Benthological Soc. 30:997–1008.
- Holmgren K, Appelberg M. 2000. Size structure of benthic freshwater fish communities in relation to environmental gradients. J Fish Biol. 57:1312–1330.
- Jennings S. 2005. Indicators to support an ecosystem approach to fisheries. Fish Fish. 6:212–232.
- Jennings S, Blanchard JL. 2004. Fish abundance with no fishing: predictions based on macroecological theory. J Anim Ecol. 73:632–642.
- Jennings S, Dulvy NK. 2005. Reference points and reference directions for size-based indicators of community structure. ICES J Marine Sci. 62:397–404.
- Kerr SR, Dickie LM. 2001. The biomass spectrum: a predator–prey theory of aquatic production. New York (NY): Columbia University Press.
- McGrady-Steed J, Harris PM, Morin PJ. 1997. Biodiversity regulates ecosystem predictability. Nature. 390:162–165.
- Murry BA, Farrell JM. 2014. Resistance of the size structure of the fish community to ecological perturbations in a large river ecosystem. Freshwater Biol. 59:155–167.
- Petchey OL, Belgrano A. 2010. Body-size distributions and size-spectra: universal indicators of ecological status? Biol Lett. 6:434–437.
- Post DM, Pace ML, Hairston NG, Jr. 2000. Ecosystem size determines food-chain length in lakes. Nature. 405:1047–1049.
- Rice J, Gislason H. 1996. Patterns of change in the size spectra of numbers and diversity of the North Sea fish assemblage, as reflected in surveys and models. ICES J Marine Sci. 53:1214–1225.
- Sheldon RW, Prakash A, Sutcliffe WH, Jr. 1972. The size distribution of particles in the ocean. Limnology Oceanography. 17:327–340.
- Shin Y-J, Rochet M-J, Jennings S, Field JG, Gislason H. 2005. Using size-based indicators to evaluate the ecosystem effects of fishing. ICES J Marine Sci. 62:384–396.
- Sprules WG. 2008. Ecological change in Great Lakes communities – a matter of perspective. Can J Fish Aquatic Sci. 65:1–9.
- Sweetings CJ, Badalamenti F, D'Anna G, Pipitone C, Polunin NVC. 2009. Steeper biomass spectra of demersal fish communities after trawler exclusion in Sicily. ICES J Marine Sci. 66:195–202.
- Tonn WM, Magnuson JJ. 1982. Patterns in the species composition and richness of fish assemblages in Northern Wisconsin lakes. Ecology. 63:1149–1166.
- Trexler JC, Tempe RC, Travis J. 1994. Size-selective predation of sailfin mollies by two species of heron. Oikos. 69:250–258.
- White EP, Ernest SKM, Kerkhoff AJ, Enquist BJ. 2007. Relationship between body size and abundance in ecology. Trends Ecol Evol. 222:323–330.
- Wilson SK, Fisher R, Pratchett MS, Graham NAJ, Dulvy NK, Turner RA, Cakacaka A, Polunin NVC. 2010. Habitat degradation and fishing effects on size structure of coral reef fish communities. Ecol Appl. 20:442–451.