
Abstract
Climate change will undoubtedly influence stream ecosystems by affecting water temperature, discharge, and riparian vegetation phenology. It has been suggested that increasing the extent of riparian buffers may help to mitigate these impacts and contribute to ecosystem resilience. Measures of stream metabolism are one way to examine the changes in ecosystem function as they respond to climate change and management strategies used to respond to these impacts. In this study we examine the influence of riparian vegetation (open vs. forest) and season on ecosystem metabolism in a small stream in MN, USA. The stream was heterotrophic regardless of the type of riparian vegetation but the presence of a forested buffer depressed gross primary production (GPP) and also resulted in lower (less negative) ecosystem respiration (ER) and net ecosystem production (NEP). We also found significant daily and seasonal variation in GPP, ER, and NEP. Stream metabolism was more variable in the fall than in the summer. The study design was complicated by the fact that there were differences in groundwater dynamics between the two locations; the forested location was a losing stream while the open location was a gaining stream. Despite the fact that groundwater input likely influenced the oxygen dynamics of the open location, the impact of the forest buffer outweighed the impact of groundwater. The presence of a forested riparian corridor resulted in decreased GPP likely through the attenuation of light. The low O2 groundwater input at the open location likely biased measures of ER and NEP. Modifying stream corridors with increased forest vegetation to offset the impacts of climate change will likely result in less in-stream primary production and a shift to a more heterotrophic system. This shift will undoubtedly influence many ecosystem functions in-stream systems.
Introduction
Stream function is influenced by large-scale ecological processes, including changing land use patterns and climate change (Woodward et al. Citation2010; Jankowski et al. Citation2014). Stream metabolism is an important indicator of the biological activity of a stream and, thus, of changes in ecosystem functions (Young et al. Citation2008; Hoellein et al. Citation2013). Quantifying metabolism includes measures of both autotrophic production (e.g., algal growth) and heterotrophic production (respiration of particulate and dissolved organic matter inputs). It is influenced by a host of factors, including channel hydraulics and transient storage, sediment characteristics, photosynthetically active radiation (PAR), temperature, nutrient availability and the biomass of primary producers and consumers (Tank et al. Citation2010; Beaulieu et al. Citation2013). Seasonal variation in these drivers adds additional complexity to an already intricate metabolic system.
Channel hydraulics influence gross primary productivity (GPP) and ecosystem respiration (ER) directly through modulation of water velocity (González-Pinzón et al. Citation2014), shear stress, and sediment instability (Holmes et al. Citation1998; Uehlinger & Naegeli Citation1998; Gordon et al. Citation2004), which may affect producers, and with stream size and the size and permeability of sediments underlying a stream channel affecting metabolism through impacts on transient storage and groundwater inputs (Mulholland et al. Citation1997; Hall & Tank Citation2005). The calculation of stream metabolism can also be influenced by channel hydraulics with turbulence influencing gas exchange rates (Dodds et al. Citation2013) and oxygen-poor groundwater inputs causing net ecosystem production (NEP) to appear significantly lower than actual rates.
Nutrient availability also influences stream metabolism and nutrient concentrations vary greatly depending on land use, location, climate, and geology (Peterjohn & Correll Citation1984; Mulholland et al. Citation2001). In surveys of whole ecosystem metabolism in streams across several biomes, Mulholland et al. (Citation2001) found that soluble reactive phosphorus (SRP) influences GPP. However, Rier and Stevenson (Citation2006) found that when phosphorus and nitrogen are present above a critical mass, changes in these nutrients have minimal effects on GPP. In addition, studies of single streams more commonly find that nutrient concentrations have no relationship or a negative relationship with metabolism (Roberts et al. Citation2007) due to low nutrient uptake rates. Nutrient uptake rates may better correlate with metabolism than nutrient concentration alone (Hoellein et al. Citation2007). Availability of particulate and dissolved organic matter (DOM) are sources of carbon and energy for all stream ecosystems, with DOM a primary source that fuels respiration (Giling et al. Citation2014).
Seasonality influences stream metabolism through variation in PAR, inorganic nutrient levels, temperature and differential organic inputs (Roberts & Mulholland Citation2007). In summer, PAR is generally higher, correlating with higher GPP as compared to the fall season. The cross-site synthesis study of Mulholland et al. (Citation2001) found that GPP was primarily influenced by PAR. Demars et al. (Citation2011) also found that temperature was highly correlated with rates of respiration and litter breakdown. Breakdown is influenced by microbial abundance, dissolved nutrients, dissolved oxygen, acidity, latitude, and macroinvertebrate community composition (Irons et al. Citation1994).
Climate change will have large impacts on freshwater communities and ecosystems (Woodward et al. Citation2010; Hill et al. Citation2014). Most fluvial systems currently are net heterotrophic and globally provide 0.32 Pg C/year (Battin et al. Citation2008) through the mineralization of organic matter to CO2 by aquatic consumer respiration (Mayorga et al. Citation2005). Increasing temperatures could cause aquatic ecosystems to have greater rates of metabolism and, thus, CO2 output (Butman & Raymond Citation2011; Yvon-Durocher et al. Citation2011). Many streams are already displaying significant increases in water temperature (Kaushal et al. Citation2010) and in some streams modifications of stream flow are predicted to significantly alter stream ecosystems (Marcarelli et al. Citation2010). Riparian systems may play a role in mitigating climate change impacts on streams since they evolved under conditions of environmental and hydrological variability (Seavy et al. Citation2009; Catford et al. Citation2012) and, thus, may be pre-adapted for changing conditions. Scientists have recognized that maintaining ecosystem resilience to climate change may depend on riparian ecosystem functions and their adaptation to changing conditions (Palmer et al. Citation2008, Citation2009; Davies Citation2010). Riparian vegetation's role in shielding water bodies from the sun may keep water cooler and provide thermal refuges for species that require them (Kaya et al. Citation1977; Thomas et al. Citation2015). McTammany et al. (Citation2007) indicate that shading caused by reforestation could likely be an important mechanism in the recovery of stream metabolism affected by historical agriculture. While these positive impacts are important, Wahl et al. (Citation2013) suggest that the positive effects of the restoration of riparian corridors may be insufficient to deal with the degradation of stream ecosystems from urbanization and modern agricultural practices.
In this study, we examined the impact of riparian vegetation on ecosystem metabolism of a small stream in Valley Creek, MN by contrasting summer and fall metabolic rates in sites with open and closed forest canopies. We hypothesized that GPP would be higher at a location in Valley Creek that had minimal forest canopy compared to a location where the riparian corridor was dominated by deciduous trees, mainly because of increased PAR in the less forested site. We also hypothesized that GPP would decrease at the more open location as compared to the forested location from summer through fall as PAR decreases while GPP would increase in the forested location as leaf fall occurs because of increasing PAR. Since the stream is small we hypothesized that overall the stream would be heterotrophic with relatively high ER and thus a negative NEP.
Methods
Study area
The North Branch of Valley Creek is a second order stream that drains 15.1 km2 in Washington County, MN, emptying into the St. Croix River (). The watershed's landscape is 43% forest, 16% cultivated crops, 14% hay and pasture, 13% shrub, scrub and herbaceous vegetation, 9% developed land and 3% each open water and wetlands (based on the 2011 National Land Cover Database, Jin et al. Citation2013). The watershed includes the best trout stream in the Minneapolis-St. Paul metropolitan area with brown trout (Salmon trutta), rainbow trout (Oncorhynchus mykiss) and native brook trout (Salvelinus fontinalis) being present (Zapp & Almendinger Citation2001).
Figure 1. Map of North Branch of Valley Creek, MN, USA, showing study locations.
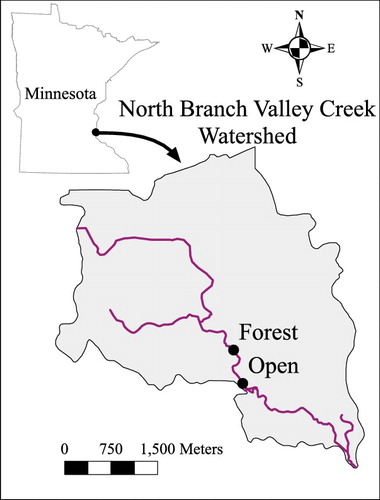
Two sites were utilized for this study: one relatively more forested and the other an open wetland. The forest location utilized in this study was approximately 700 m upstream of the open location. There were no major tributaries between the sites, although small gullies in the wetland added water to the stream during periods of high precipitation. We measured average stream width and depth for 100 m stretches in the two locations once and found that the forested location was wider and shallower (∼6 m wide and 0.15 m deep) than the open location (∼4.5 m wide and 0.25 m deep). While at the open site the stream passed through a wetland, it maintained a confined channel with relatively steep sides (∼1–2 m high) and contained no emergent vegetation in the stream channel. The open site vegetation included Joe-Pye weed (Eutrochium sp.), purple-stemmed Angelica (Angelica purpurea), thistle (Cirsium sp.), Canada goldenrod (Solidago canadensis), and various grasses. The forest site included a variety of tree species including American elm (Ulmus americana), silver maple (Acer saccharinum), ash (Fraxinus sp.) and box elder (Acer negundo). Other vegetation at the forested site included buckthorn (Rhamnus cathartica), Virginia waterleaf (Hydrophyllum virginianum), gooseberry (Ribes sp.) and buttercup (Ranunculus sp.).
This study took place during the summer (July–August) and fall (September–October) of 2014. Leaf fall in the forested site began in late September and was completed by late October.
Biological, chemical, and physical data collection
We took a variety of measurements to characterize differences between the sites. We collected macroinvertebrates by taking three Surber samples (0.093 m2 each) from each location on 2 October 2014 and identifying insect larvae to family and other organisms to order (Bouchard, Citation2004). From these data we calculated macroinvertebrate density, family richness, the Shannon-Weaver index of diversity and a modified family biotic index. Family biotic indexes were taken from Hilsenhoff (Citation1987) and modified with data from Bode et al. (Citation1996, Citation2002).
We collected sediment samples with a 5 cm corer taken from the Surber samples, dried them at 65°C, and passed them through a series of six sieves (63, 125, 250, 500, 1,000, and 2,000 µm). We weighed the subsamples and calculated the average sediment size using Gradistat (Blott & Pye Citation2001).
Discharge was measured at each site 3 times during the fall (September–October) using the area-velocity method (Kuserk Citation1989) with a Marsh-McBirney Flo-Mate® Model 2000 flow meter to detect whether there were difference between the two sites. Discharge data were also available from a Washington Co. Conservation District site approximately 5 m upstream of the forest location. Discharge is measured every hour at this site. The shear stress at each location was measured once on October 9, 2014 using two methods. At three sites within each location we assessed shear stress using Fliesswasserstammtisch (FST) hemispheres (Statzner & Müller Citation1989) and by calculating it from velocity profiles (Gordon et al. Citation2004).
During the fall period of this study, we deployed nutrient diffusing substrates to measure periphyton production (Pringle & Triska Citation2006) and test whether nutrient limitation may be related to GPP. We deployed four replicates each of control, nitrogen (N), phosphorus (P) and N + P enriched media using the methods of Toetz (Citation1999) at each location for two time periods (11–25 Sep and 25 Sep–9 Oct). This method uses 100 mL vials, filled with agar and capped with fused silica discs. The phosphorus treatments consisted of 0.1M KH2PO4 and the nitrogen treatments consisted of 0.5M NaNO3. Chlorophyll a content of each sample was determined with a Turner Aquaflour® Model 8000 Fluorometer using EPA Method 445.0 for extraction (Arar & Collins Citation1997). We also measured levels of nitrate (cadmium reduction method) and soluble phosphorus (ascorbic acid method) on unfiltered water samples twice during the fall period using a Hach® Model DR890 spectrophotometer.
We deployed weather stations (HOBO® model H21, Onset Computer Corporation, http://www.onsetcomp.com) that recorded air temperature, relative humidity, barometric pressure and photosynthetic active radiation (PAR) every 15 minutes at both sites on the stream bank within one meter of the stream. The weather station at the forest site was not functioning the last 2 weeks of the study. We measured water level with an automated water level logger (HOBO® model U20 water level logger, Onset Computer Corporation, http://www.onsetcomp.com) with a logging interval of 15 minutes. We measured hydraulic head by installing 3 mini-piezometers per site (Baxter et al. Citation2003). We placed the mini-piezometers (0.7 cm diameter, 1.1 m below the sediment water interface, screen length 4.3 cm) in the center of the stream. Since there was groundwater influx into the open site we performed pump tests twice and calculated hydraulic conductivity (Bouwer Citation1989; http://www.groundwatersoftware.com/) and water influx rates (Baxter et al. Citation2003). The water influx rates are likely only rough estimates of groundwater influx since a great deal of variability may be found among mini-piezometers installed in streams and they do not account for bank seepage and horizontal flow into the stream (Cey et al. Citation1998). The oxygen concentration of the groundwater was measured twice (11 September and 9 October) at the open site by pumping water from the mini-piezometers into a flow cell connected to a sonde fitted with an optical DO probe (YSI® model 6600 sonde, YSI, Inc., http://www.ysi.com).
To assess the degree of groundwater input at the open site, we used the sodium chloride (conservative solute) continuous injection method (Webster & Valett Citation2006) to measure the change in discharge within this location on October 30, 2014. We took conductivity measures at 50 and 100 m downstream of the injection site and calculated the stream discharge at each site. The difference in discharge was taken as the input of groundwater in the 50 m stretch between the sites on this date.
Measurements of stream metabolism
We used the single-station, open channel method of assessing stream metabolism (Odum Citation1956). This method relies on examining the daily variation in oxygen concentration in a stream. From these data, calculations of GPP (mg O2 L−1 d−1), – ER (mg O2 L−1 d−1), and NEP (mg O2 L−1 d−1) can be made. The following equations describe these relationships:
(1)
(2) where C = concentration of oxygen (mg/L), Cs = concentration of oxygen at saturation (mg/L), k = reaeration coefficient (/min) and GWA = oxygen accrual from ground water (mg O2/L/day, Odum Citation1956). Generally, ER is assumed to be constant throughout the day and is assessed as the difference in actual oxygen concentration (C) and the potential oxygen saturation (Cs) during the dark periods of the day. Often GWA is assumed to be zero (Odum Citation1956). However, more recent studies have suggested even a small amount of groundwater input can substantially impact metabolism calculations (Hall & Tank Citation2005). Inputs of low O2 groundwater makes GPP appear smaller and ER appear larger; Hall and Tank (Citation2005) provide equations to calculate stream metabolism with a groundwater correction factor. The reaeration coefficient, k, depends on a number of factors including the water velocity, depth and turbulence. There have been a number of studies that have compared several methods of estimating k (Aristegi et al. Citation2009; Riley & Dodds Citation2013). Kosinski (Citation1984) and Aristegi et al. (Citation2009) compared many of these methods and indicated that the choice of method depends on factors such as the size of the stream and budget and time constraints. The single station method integrates stream metabolism for a stream reach that is approximately 3v/k, where v is the water velocity (m/min) and k is the reaeration coefficient (min−1, Chapra & Di Toro Citation1991). Thus, if two sites are to be compared on the same stream they must be at least 3v/k meters apart to insure metabolism at the downstream site is not influenced by the upstream site (Reichert et al. Citation2009).
In Valley Creek dissolved oxygen measurements were taken every 10 minutes using automated D.O. probes (HOBO® model U26 data logger, Onset Computer Corporation, http://www.onsetcomp.com). Almeida et al. (Citation2014) demonstrated that optical sensors such as these were the most accurate sensors for measuring stream metabolism. Triplicate loggers were placed at both the open and forest sites during the period 24 July–18 August 2014 and 14 September–8 October 2014. We used multiple loggers to account for logger variability. There was little difference in the oxygen levels measured with the triplicate loggers and thus we used the average of the three sensors in our calculations. The Excel-based Rivermet® tool was used to calculate GPP, ER and NEP (Izagirre et al. Citation2007). We modified the tool to use the concentration of O2 at saturation from local measurements, based on temperature measures from the O2 data loggers and barometric pressure from the weather station, rather than saturation based on predictions from temperature alone. The Rivermet® tool uses the Hornberger and Kelly (Citation1975) nighttime regression method to determine k. For calculations of GPP, and NEP in Rivermet® estimates of respiration are temperature corrected using the method of Erlandsen and Thyssen (Citation1983).
Calculation of stream metabolism and statistical analyses
Measurements of stream metabolism (GPP, ER and NEP) were made on a volumetric basis (mg O2/L). While many studies report ecosystem metabolism on an areal basis (mg O2/m2), we did not have sufficient information to reliably estimate average stream depth on a daily basis. Our depth measures were based on a single point and not on the average stream depth. Likewise, we would have preferred to correct the O2 levels at the open site for groundwater input. However, since we only have measures for groundwater input and groundwater O2 levels for two dates in the fall we felt correcting all O2 measures with these limited data was unwarranted.
To examine the major components of our hypotheses, that the amount of riparian vegetation and season would influence the various components of stream metabolism we conducted two-way analyses of variance (ANOVAs) with daily values of stream metabolism (GPP, ER or NEP) as the dependent variable and location and season and their interaction as independent variables. Also to test whether the variances in these variables were the same across seasons and locations, we used Levene's test of homoscedasticity. We tested whether the reaeration coefficients varied between seasons and locations, again using a two-way ANOVA with k as the dependent variable and location, season and their interaction as independent variables. In order to understand which physical variables (PAR, water temperature, water depth and discharge) were related to any seasonal or location differences we used multiple regression of the physical variables on stream metabolism variables (GPP, ER, and NEP). Since values of ER and NEP become more negative as respiration increases, we converted these to positive values for the regression analysis. We also examined whether the variability in the physical variables also varied among season and locations, again with Levene's test. All statistical analyses were carried out using JMP® Pro version 11.0 (SAS, Inc., http://www.sas.com).
Results
Site comparisons
Despite the fact that the two sites were only 700 m apart, there were significant differences in the physical, chemical and biological characteristics of the sites. We assessed the difference in the hydrological characteristics of the sites and found that, based on three measurements in the fall, the discharge was on average 4.3% higher at the open site than the forest site (). Part of this difference in discharge is likely due to groundwater input. The stream at the forest site is a losing stream, while it is a gaining stream at the open site (). The hydraulic conductivity, measured twice with a pump test at the open site, ranged from 0.16 to 0.24 cm/sec. The differences in hydrological characteristics were also displayed in differences in average sediment size and shear stress between sites. The open location had finer sediments, a greater range of shear stress, and greater shear stress than the forest location ().
Table 1. Comparison of physical, biological and chemical characteristics of the two study locations on North Branch Valley Creek, Afton, MN, USA. Values in brackets are standard deviations.
Figure 2. Graph showing vertical hydraulic gradient from July through October at North Branch of Valley Creek, MN, USA. Negative values indicate a losing stream and positive values indicate a gaining stream. Data were not collected in October at the Forested site.
Water temperature and daily PAR varied among locations and seasons. A two-way ANOVA of PAR showed significant effects of season, location and their interaction (Season: F1,94 = 8.1, p < 0.0001; Location: F1,94 = 256, p < 0.0001; Interaction: F1,94 = 10.0, p = 0.002). PAR was greater in the open location than the forest location () and while PAR decreased at the open location from summer to fall, it increased from summer to fall at the forest location. PAR at the forest location in the fall was only slightly higher than PAR in the forest during summer (1.2%) but we are missing the last two weeks of PAR data from forest when light increased. In the previous three years we had collected PAR data at the 2 sites and PAR in forest site for the fall period (September–October) was 15% higher than in the summer (July–August) period. A two-way ANOVA of mean daily water temperature similarly showed significant effects of season and location, but not their interaction (Season: F1,101 = 551, p < 0.0001; Location: F1,101 = 4.8, p < 0.03; Interaction: F1,101 = 1.2, p = 0.28). As expected water temperature is lower in the fall than in the spring, but somewhat unexpectedly the water temperature is lower at the open location than in the forest location.
We assessed periphyton production during two periods within the fall sampling time. We conducted an ANOVA with Chl a cm−2 d−1 as the dependent variable and location, time period, treatment, and their interactions as the independent variables. There was no significant effect of treatment (control, N, P and N + P) on periphyton production rates (chl a cm−2 wk−1, F3, 62 = 0.73, p = 0.54) and no significant interaction terms. However, both location and time period were significant (Location: F1,62 = 11.99, p = 0.001; Time period: F1,62 = 14.62, p = 0.0004). The periphyton production was higher in the forest site than the open site for both time periods and the production was higher in the second time period (25 September–8 October) than in the first time period (September 11–September 25, ).
While the macroinvertebrate density, richness, and evenness were all higher in the forested site than in the open () these differences were not significant (density: t2 = 2.17, p = 0.16; richness: t2 = 1.75, p = 0.21; evenness: t2 = 1.2, p = 0.31). However, the mean biotic indices of macroinvertebrates found in the open site were higher than those of macroinvertebrates found in the forested site but, again, these differences were not statistically significant (t2 = 1.73, p = 0.10). The lack of statistically significant results was largely due to the small sample sizes involved (3 samples per location). Power analyses indicated that at least 8–19 samples would be required to detect a significant difference in density, richness or evenness, while 47 samples would be required to detect a difference in the biotic index.
Stream metabolism
We calculated the potential stream reach integration length (i.e., the length over which the oxygen meters were influenced by metabolism) for the downstream open location as 468 m (3v/k, where the maximum average velocity we measure over the sampling period was 0.65 m/s and the average k was 0.25/min). Thus the rates of oxygen change at the downstream open location were unlikely influenced by metabolism at the upstream forested location. Oxygen levels varied daily, with percent oxygen saturation always high (usually > 93%) and daily changes in percent oxygen averaging approximately 4% (). In the summer the percent oxygen saturation is generally higher at the forest location but this difference declines during the fall period.
Two-way ANOVAs with location and season (summer = July and August; fall = September and October) showed that location and season significantly influence GPP, ER and NEP but the interaction effects were not significant (for GPP: location, F1,99 = 7.9, p = 0.006; season, F1,99 = 17.8, p < 0.0001; interaction, F1,99 = 0.06, p = 0.81; for ER: location, F1,99 = 13.2, p = 0.0004; season, F1,99 = 33.0, p < 0.0001; interaction, F1,99 = 0.17, p = 0.68; for NEP: location, F1,99 = 13.3, p = 0.0004; season, F1,99 = 33.4, p < 0.0001; interaction, F1,99 = 0.18, p = 0.67). The GPP varied between locations and seasons (), with some negative values being calculated, indicating that on some days GPP was below the level of detection. In general GPP was higher at the open location than the forest location, while both ER and NEP were greater (i.e., more negative) at the open location than the forest location. Thus, the stream is heterotrophic in both locations. Also GPP increased at both locations from the summer to the fall and both ER and NEP increased from summer to fall. A two-way ANOVA showed that the reaeration coefficient k was higher in the fall than in the summer, but there was no difference between locations or the interaction between location and season (location, F1,99 = 3.7, p = 0.6; season, F1,99 = 25.1, p < 0.0001; interaction, F1,99 = 0.11, p = 0.74).
Figure 3. Percent oxygen saturation (taken at 10 minute intervals) for two locations in Valley Creek, MN, USA. Upper panel represents the summer sampling period and lower panel represents the fall sampling.
Figure 4. Temporal changes in daily measures of stream metabolism (measured as mg O2/L/day) at two locations in Valley Creek, MN, USA. Top panel represents gross primary production, middle panel represents ecosystem respiration, and the bottom panel represents net ecosystem production.
There were also differences in the daily variability in all measures of stream metabolism (GPP, ER and NEP) among seasons and locations (Levene test – GPP: F3, 96 = 9.2, p < 0.0001; ER: F3, 96 = 9.1, p < 0.0001; NEP: F3, 96 = 9.2, p < 0.0001). In all cases, the variability was greater in the fall than in the summer and greater in the open location than the forest location. Significant differences in variability were also found for mean daily water temperature and level, with temperature variability greater for the fall than the summer at both locations and variation in mean daily water level being greater in the fall than the summer but only at the open location, (Levene test with Bonferroni correction for multiple comparisons – Water temperature, Open: F1,49 = 28.2, p < 0.0001; Water temperature, Forest: F1,47 = 23.7, p < 0.0001; Water level, Open: F1,49 = 10.7, p = 0.0023). There was no significant difference in variability between seasons in daily PAR or daily stream discharge (measured at the forest location). However the variability in PAR was greater in the open location than the forest location in both seasons (Levene test with Bonferroni correction for multiple comparisons – Summer: F1,46 = 42.4, p < 0.0001; Fall: F1,38 = 23.0, p < 0.0001).
We examined the correlation of GPP, NEP and ER with a number of environmental factors including PAR, water temperature, water depth and discharge. Multiple regression showed that only two of these factors were correlated with GPP (r2 = 0.24): a positive correlation with total daily PAR (F1,88 = 5.7, p = 0.02) and a negative correlation with mean daily water temperature (F1,88 = 14.8; p = 0.0002). These two factors were also correlated with ER (r2 = 0.32): a positive correlation with PAR (F1,88 = 6.2, p = 0.02) and negative correlation with water temperature (F1,88 = 33.3, p < 0.0001). Similarly NEP (r2 = 0.32) was positively correlated with PAR (F1,88 = 5.7, p = 0.02) and negatively correlated with water temperature (F1,88 = 34.1, p < 0.0001).
We estimated the impact of groundwater input at the open location on NEP and GPP in the fall using the method of Hall and Tank (Citation2005). We used the difference in discharge over a 50 m stretch of the stream based on the salt discharge method. The increase in discharge between these sites was 5.77 m3 m−2 d−1. Based on our pump tests on September 11 and September 25 2014, the average groundwater discharge was 5.11 m3 m−2 d−1 (4.06 and 6.16 m3 m−2 d−1, respectively – ). While we do not have measures of the change in groundwater discharge over the sampling period, the vertical hydraulic gradient was fairly consistent over this time (). Groundwater oxygen levels were lower than surface water. Based on two measurements the average groundwater oxygen content was 6.36 mg O2/L (6.73 mg O2/L on 11 September and 5.89 mg O2/L on 9 October) compared to an average surface water oxygen content of 10.14 mg O2/L (10.23 mg O2/L on 11 September and 10.05 mg O2/Lon 9 October). Using the groundwater O2 content value and a groundwater discharge rate of 5.77 m3 m−2 d−1, we calculated a mean bias (ER uncorrected for groundwater/ER corrected) for the fall period (when we assessed groundwater input and groundwater oxygen levels) of 1.12 indicating that our measures of ER at the open location were greater than if they were corrected for groundwater input. For GPP the mean bias was 0.57, indicating that our estimates of GPP at the open site may be lower than if they were corrected for groundwater inputs. These results suggest that primary production may be even greater and ER may be lower (less negative) in the open location than the forest location.
Discussion
Both spatial and temporal variation in stream metabolism have been well documented (e.g. Beaulieu et al. Citation2013; Dodds et al. Citation2013; Griffiths et al. Citation2013; Yates et al. Citation2013; González-Pinzón et al. Citation2014; Hotchkiss & Hall Citation2014; Roley et al. Citation2014), including the interaction between these factors depending on the type of riparian zone of the stream (Roberts et al. Citation2007). We found spatial variation in stream metabolism in Valley Creek, as hypothesized, with GPP, ER and NEP being lower at the forested location versus the open location. Birkel et al. (Citation2013) described similar impacts of riparian vegetation on stream metabolism (lower GPP, ER and NEP in a forested location). Despite the variation, the stream was heterotrophic at both locations. Smaller streams are often found to be heterotrophic (e.g. King & Cummins Citation1989; Battin et al. Citation2008). GPP was higher in the open location and often near zero at the forest location, especially in the summer, while NEP and ER were greater (more negative) at the forest site. These results support our initial hypotheses. In those cases where GPP was negative, we found that the regression equations used to calculate the reaeration coefficient (Hornberger & Kelly Citation1975) were not significant, which might account for the negative values. Caffery et al. (Citation2014) indicate that many researchers discard negative GPP measures. Caffery et al. (Citation2014) suggest that negative GPP values may be due to periods of low metabolism below the effective level of detection and that excluding these values may overestimate metabolism. Thus, we included these values in our analysis. GPP was positively correlated with PAR, mainly because of the higher GPP in the open location, even though water temperature was lower in the open location, likely due to groundwater input (Simmons et al. Citation2014). The groundwater impact on water temperature at the open site was also likely responsible for the negative correlation between water temperature and GPP. The positive relationship of PAR with GPP even with a negative relationship between water temperature and GPP supports the idea that PAR has a greater control on GPP than water temperature (Mulholland et al. Citation2001; Bernot et al. Citation2010; Huryn et al. Citation2014). GPP was not correlated with water depth or discharge. Benson et al. (Citation2013) found that GPP was maximal at intermediate discharge levels and thus a simple correlation may not be evident. Benson et al. (Citation2013) and attributed this to a balance being struck between positive impacts of delivering nutrients and the negative impacts of scouring and reduced light availability due to enhanced turbidity. It is also possible using the discharge measures taken from above the forest location do not adequately reflect discharge at the open site due to groundwater inputs. Lamberti et al. (Citation1995) showed that GPP decreased with increasing grazer abundance and, thus, since our forest site has a higher total abundance of macroinvertebrates including grazers it is possible that grazing pressure resulted in a lower GPP.
Nutrient availability and GPP are tightly coupled in many systems (Hall & Tank Citation2003; Cohen et al. Citation2013; Huryn et al. Citation2014). In our study we examined periphyton growth in the fall using nutrient diffusing substrates to test nutrient limitation in relation to GPP. Since there was no significant difference among treatments, nutrient limitation does not seem to be occurring. Sanderson et al. (Citation2009) showed that 31.5% of the streams they studied showed no nutrient limitation on periphyton production using the same methods we used. Similarly Nelson et al. (Citation2013) found in one of two ecoregions in California they studied, increasing nutrient content did not result in increased chlorophyll a production. The potential causes for the lack of response to increased nutrients could be sufficient nutrients in the stream, other limiting factors such as light, temperature, or disturbance and the presence of invertebrate grazers. Frankforter et al. (Citation2010) found a correlation between GPP and nutrient availability at only a few sites. Rier and Stevenson (Citation2006) found that above 150 μg/L, dissolved inorganic nitrogen (DIN) had little to no effect on periphyton growth. We found the average nitrate-N component of DIN at the open site to be 445 μg/L and 565 μg/L at the forest site, suggesting that the DIN of the stream was already beyond the point where adding more would have had a significant effect on periphyton growth. The same Rier and Stevenson study found that above 20 μg/L, soluble reactive phosphate (SRP) had little to no effect on periphyton growth. Given that we found the average SRP at the open site to be 47 μg/L and the average at the forest site to be 34 μg/L we can also conclude that adding phosphorus should not have played a significant role in periphyton growth.
Both ER and NEP were positively correlated with PAR but negatively correlated with water temperature. The negative relationship with water temperature is unexpected since metabolic rates generally increase with increasing temperature. Demars et al. (Citation2011) found that increased temperature was positively correlated with GPP and ER and had a greater impact on ER than GPP. In our study, increased temperature was negatively correlated with ER and GPP with the correlation also being higher for ER compared to GPP (r2 = 0.32 vs. 0.24). Jankowski et al. (Citation2014) discussed the factors that might influence the temperature sensitivity of ER and showed that the temperature sensitivity of ER was greatly influenced the quantity and quality of organic carbon substrates. The negative correlation between temperature and ER could be an artifact of the groundwater input at the open site. The open site has lower water temperature than the forest site but ER is higher. The input of low O2 from groundwater could make it appear that ER is higher and this would be associated with cooler temperatures. There was no correlation between ER and NEP with water depth or discharge even though other studies showed that increased scour of the streambed leads to a reduction in respiration (Atkinson et al. Citation2008; O'Connor et al. Citation2012). Young et al. (Citation2008) point out the ER would not likely be correlated with PAR since respiration may be most influenced by heterotrophic organisms, although Benson et al. (Citation2013) indicate that ER was positively related to PAR in their arctic streams since much of the respiration is likely due to metabolism by autotrophs. The positive correlation between PAR and ER and NEP could simply be due to the greater levels of ER and NEP in the open location, which again could be artifacts of low O2 groundwater inputs.
Temporal variability as well as spatial variability in-stream metabolism was evident in Valley Creek. Roberts et al. (Citation2007) noted 4 levels of temporal variability in-stream metabolism: interannual, seasonal, day-to-day and episodic (storm-related). Our study clearly showed both day-to-day and seasonal variability in-stream metabolism. Daily variation in GPP, ER and NEP was higher in the fall than in the summer and higher in the open than the forest location. Wilby et al. (Citation2014) found greater variability in-stream temperature with intermittent groundwater inputs, and lower variability in shaded versus open locations mainly due to difference in incident solar radiation. At Valley Creek the variance in GPP, NEP and ER was greater at the open location, regardless of season. For GPP this may be related to the greater variability in PAR at the open site. But at both locations the variance in these measures of stream metabolism was greater in the fall than in the summer. We found that mean daily water temperature was more variable in the fall than in the spring at both locations and that mean daily water level was more variable in the fall than the summer at the open site. This suggests that while the variability in light may be related to variability in GPP, variability in overall metabolism (GPP, ER, and NEP) may relate to water temperature.
Seasonal variation in GPP, ER and NEP was also evident in this study. While the increase in GPP was expected for the forest location because of increasing PAR associated with leaf fall (e.g., Burrell et al. Citation2014) this was not expected for the open site since PAR declined from summer. Earlier light measurements taken in November 2012 and 2013 at the open location in Valley Creek, showed that light levels at the water surface in the center of the stream were almost 20% lower than where the PAR meter was stationed (about 1 m from the stream on the shore and 1–2 m above the stream surface). It is possible that the steep stream sides and wetland vegetation was shading the open site until the fall when vegetation died back. Our measures of periphyton production, which were only taken in the fall, support the idea that GPP increases within the fall period. Paradoxically, periphyton production in the fall was greater in the forest location than the open location even though GPP was greater in the open location. There are a number of possible reasons for a lack of correlation between GPP and periphyton production. There is a higher shear stress and smaller sediment size at the open site that could lead to greater sediment transport and scouring. Atkinson et al. (Citation2008) showed that sediment scour decreases both periphyton production but they also found that this lead to lower GPP. O'Connor et al. (Citation2012) found that even small storm pulses can induce partial bed mobilization resulting in increased turbidity and a reduction in GPP. Hondzo et al. (Citation2013) demonstrated that shear stress had a more significant impact on GPP than ER.
There was increased ER and NEP (i.e. more negative) in the fall compared to the summer at both sites. This was expected in the forest location due to increased leaf fall providing a carbon source for increased respiration. Roberts and Mulholland (Citation2007) and Roberts et al. (Citation2007) noted ER was highest in the spring due to autotrophic respiration and fall due to decomposition of leaves.. Hall and Beaulieu (Citation2013) suggest that using the slope of the quantile regression of GPP versus ER provides a reasonable estimate of the fraction of ER that is attributable to autotrophs. However, they also indicated that there needs to be a reasonable range of GPP values to adequately estimate this proportion. Our range of GPP was insufficient to meet the adequacy standard (personal communication from Robert O. Hall, University of Wyoming, 5 May 2015). The higher levels of ER and NEP at the open location in the fall, could be due to the import of organic matter from the upstream forest location or from the surrounding wetland or both. The possibility mentioned above that shading of the open site may be partially responsible for the lower GPP in the summer compared to the fall would support the idea of fall organic input to the open site from the surrounding vegetation. It is also possible that the higher GPP noted at both sites in the fall could be due to a greater reaeration coefficient found in the fall which could inflate the estimates of GPP.
It is clear that groundwater input had a significant impact on our measures of stream metabolism at the open site. The hydraulic conductivity of 0.16–0.24 cm/sec was similar to values found by Wenck and Associates (Citation2014) at nearby sites (0.11–0.36 cm/sec). A number of studies have found that groundwater input generally biases measures of ER especially if the levels of groundwater input is high and groundwater O2 levels are low (McCutchan et al. Citation2002; Hall & Tank Citation2005). However, groundwater input can have a smaller impact on estimates of GPP (Hall & Tank Citation2005). Hall and Tank (Citation2005) suggested using the groundwater discharge per area (Q/A) as a measure the rate of groundwater input. Our estimated ratio of 5.77 m/day is lower than the unusually high ratio of 16 m/day in the Hall and Tank (Citation2005) study but according to their discussion, our ratio is higher than some other studies. Hall and Tank (Citation2005) calculated a bias of 0.71 for GPP, compared to our rough estimate of 0.57 and a bias of 1.63–1.66 for ER compared to 1.12 for our estimate. The lower bias in our study is likely due to the lower amount of groundwater input and the higher O2 levels in the groundwater at our location compared to the Hall and Tank (Citation2005) study. Unfortunately our groundwater data are limited in terms of both the seasonal variation in groundwater input and O2 level. In the fall, the average ER was 1.37 times higher at the open site than at the forest site. So even if the 1.12 bias estimate were applied to all measures of ER at the open location, ER would still be higher than in the forest location. The average GPP was 1.69 times higher in the open location than the forest location in the fall. If the bias estimate of 0.57 were applied the difference in GPP between the open and forest locations would be even greater. We also have no measures of the DOC in groundwater that might also influence the rate of ER (Demars et al. Citation2011). Variations in any of these could be partially responsible for the differences in the level and variability of O2 seen at the open site. Wilby et al. (Citation2014) found a significant impact of intermittent groundwater inputs on stream temperature variability that could have impacts on stream metabolism. Clearly groundwater inputs are influencing water temperatures and O2 levels at the sediment-water interface at the open site. It is possible that the lower O2 and temperature levels are responsible for the lower density and diversity of macroinvertebrates with higher pollution tolerance scores are found here compared to those at the forest site where there is no groundwater input.
We found that a variety of factors likely had significant impacts on stream metabolism. At the largest scale we examined, the presence of a forested riparian corridor clearly had the largest impact on GPP, ER and NEP. Temporally, season had an impact on the level of metabolism and on the degree of daily variation in metabolism. Groundwater inputs also significantly influenced metabolism, but seemed to have a lesser impact than the amount of riparian vegetation. As Young et al. (Citation2008) noted, there are a number of factors that influence both GPP and ER, but some factors have greater impacts than others. For example, they point out studies that show that variation in discharge has a greater impact on GPP than ER since scour tends to influence primary producers but has a lower impact on ER since most respiration takes place in the hyporheic zone. The complexity of the interactions at various spatial and temporal scales that influence stream metabolism will make predictions on the impacts of changing land use and climate on stream ecosystem function quite difficult. More research is needed in order to assess what changes in land use management and adaptation to climate change are likely to be most effective.
Acknowledgements
We undertook this research project as part of a Fall 2014 Aquatic Ecology class at Macalester College, which provided financial support. Our thanks go to the Belwin Conservancy for access to Valley Creek and colleagues from EREN (Ecological Research as Education Network: http://erenweb.org) for the inspiration to conduct this project. Thanks also to Erik Anderson, Water Resource Specialist, Washington Conservation District for providing discharge data and Jim Almendinger of the St. Croix Watershed Research Station for providing information about Valley Creek. Jack Webster of Virginia Polytechnic Institute and State University and Robert Runkel of the USGS gave advice about the salt discharge method, Robert O. Hall, University of Wyoming for providing advice on interpreting measures of autotrophic respiration, Vittorio Addona from Macalester College for assisting with quantile regressions and Ken Moffett also from Macalester College for designing and building sampling equipment. We also thank the anonymous reviewers that provided remarks that significantly improved this manuscript.
Disclosure statement
No potential conflict of interest was reported by the authors.
References
- Almeida GH, Boëchatb IG. 2014. Gückerb B. Assessment of stream ecosystem health based on oxygen metabolism: which sensor to use? Ecol Eng. 69:134–138.
- Arar EJ, Collins GB. 1997. In vitro determination of chlorophyll a and pheophytin a in marine and freshwater algae by fluorescence. Cincinnati (OH): National Exposure Research Laboratory Office of Research and Development U.S. Environmental Protection Agency. (EPA publication; method no. 445.0). [cited 2014 Nov 21]. Available from: http://www.epa.gov/microbes/documents/m445_0.pdf
- Aristegi L, Izagirre O, Elosegi A. 2009. Comparison of several methods to calculate reaeration in streams, and their effects on estimation of metabolism. Hydrobiologia. 635:113–124.
- Atkinson LB, Grace MR, Hart BT, Vanderkruk KEN. 2008. Sediment instability affects the rate and location of primary production and respiration in a sand-bed stream. J North Am Benthological Soc. 27:581–592.
- Battin TJ, Louis A. Kaplan LA, Findlay S, Hopkinson CS, Marti E, Packman AI, Newbold JD, Sabater F. 2008. Biophysical controls on organic carbon fluxes in fluvial networks. Nat Geoscience. 1:95–100.
- Baxter C, Hauer FC, Woessner W. 2003. Measuring groundwater–stream water exchange: new techniques for installing minipiezometers and estimating hydraulic conductivity. Trans Am Fisheries Soc. 132:493–502.
- Beaulieu JJ, Arango CP, Balz DA, Shuster WD. 2013. Continuous monitoring reveals multiple controls on ecosystem metabolism in a suburban stream. Freshwater Biol. 58:918–937.
- Benson ER, Wipfli MS, Clapcott JE, Hughes NF. 2013. Relationships between ecosystem metabolism, benthic macroinvertebrate densities, and environmental variables in a sub-arctic Alaskan river. Hydrobiologia. 701:189–207.
- Bernot MJ, Sobota DJ, Hall RO, Mulholland PJ, Dodds WK, Webster JR, Tank JL, Ashkenas LR, Cooper LW, Dahm CN, et al. 2010. Inter-regional comparison of land-use effects on stream metabolism. Freshwater Biol. 55:1874–1890.
- Birkel C, Soulsby C, Malcolm I, Tetzlaff D. 2013. Modeling the dynamics of metabolism in montane streams using continuous dissolved oxygen measurements. Water Resour Res. 49:5260–5275.
- Blott SJ, Pye K. 2001. Gradistat: a grain size distribution and statistics package for the analysis of unconsolidated sediments. Earth Surface Processes and Landforms. 26:1237–1248.
- Bode RW, Novak MA, Abele LE. 1996. Quality assurance work plan for biological stream monitoring in New York State. Albany (NY): NYS Department of Environmental Conservation; 89p.
- Bode RW, Novak MA, Abele LE, Heitzman DL, Smith AJ. 2002. Quality assurance work plan for biological stream monitoring in New York State. Albany (NY): NYS Department of Environmental Conservation; 115p.
- Bouchard RW. 2004. Guide to aquatic invertebrates of the Upper Midwest. St. Paul: University of Minnesota.
- Bouwer H. 1989. The Bouwer and Rice slug test–an update. Ground Water. 27:304–309.
- Burrell TK, O'Brien JM, Graham SE, Simon KS, Harding JS, McIntosh AR. 2014. Riparian shading mitigates stream eutrophication in agricultural catchments. Freshwater Sci. 33:73–84.
- Butman D, Raymond PA. 2011. Significant efflux of carbon dioxide from streams and rivers in the United States. Nat Geoscience 4:839–842.
- Caffery JM, Murrell MC, Amacker KS, Harper JW, Phipps S, Woodrey MS. 2014. Seasonal and inter-annual patterns in primary production, respiration, and net ecosystem metabolism in three estuaries in the northeast Gulf of Mexico. Estuaries and Coasts. 37 (Suppl 1):S222–S241.
- Catford JA, Naiman RJ, Chambers LE, Roberts J, Douglas M, Davies P. 2012. Predicting novel riparian ecosystems in a changing climate. Ecosystems. doi:10.1007/s10021-012-9566-7.
- Cey EE, Rudolph DL, Parkin GW, Aravena R. 1998. Quantifying groundwater discharge to a small perennial stream in southern Ontario, Canada. J Hydrology. 210:21–37.
- Chapra S, Di Toro D. 1991. Delta method for estimating primary production, respiration, and reaeration in streams. J Environ Eng. 117:640–655.
- Cohen MJ, Kurz MJ, Heffernan JB, Martin JB, Douglass RL, Foster CR, Thomas RJ. 2013. Diel phosphorus variation and the stoichiometry of ecosystem metabolism in a large spring-fed river. Ecol Monogr. 83:155–176.
- Davies PM. 2010. Climate change implications for river restoration in global biodiversity hotspots. Restoration Ecol. 18:261–268.
- Demars BOL, Manson JR, Ólaffson JS, Gíslason GM, Gudmundsóttir R, Woodward G, Reiss J, Pichler DE, Rasmussekn JJ, Friberg N. 2011. Temperature and the metabolic balance of streams. Freshwater Biol. 56:1106–1121.
- Dodds WK, Veach AM, Ruffing CM, Larson DM, Fischer JL, Costigan KH. 2013. Abiotic controls and temporal variability of river metabolism: multi year analyses of Mississippi and Chattahoochee River data. Freshwater Sci. 32:1073–1087.
- Erlandsen M, Thyssen N. Modelling the community oxygen production in lowland streams dominated by submerged macrophytes. In: Lauenroth WK, Skogerboe GV, Flug M, editors. Analysis of ecological systems: state of the art in ecological modelling. Amsterdam: Elsevier; 1983. p. 855–860.
- Frankforter JD, Weyers HS, Bales JD, Moran PW, Calhoun DL. 2010. The relative influence of nutrients and habitat on stream metabolism in agricultural streams. Environ Monit Assess. 168:461–479.
- Giling DP, Grace MR, Thomson JR, Mac Nally R, Thompson RM. 2014. Effect of Native Vegetation Loss on Stream Ecosystem Processes: Dissolved Organic Matter Composition and Export in Agricultural Landscapes. Ecosystems. 17:82–95.
- González-Pinzón R, Haggerty R, Argerich A. 2014. Quantifying spatial differences in metabolism in headwater streams. Freshwater Sci. 33:789–811.
- Gordon ND, McMahon TA, Finlayson BL, Gippel CJ, Nathan RJ. 2004. Stream hydrology: an introduction for ecologists. 2nd ed. West Sussex: John Wiley and Sons.
- Griffiths NA, Tank JL, Royer TV, Roley SS, Rosi-Marshall EJ, Whiles MR, Beaulieu JJ, Johnson LT. 2013. Agricultural land use alters the seasonality and magnitude of stream metabolism. Limnol Oceanogr. 58:1513–1529.
- Hall RO, Beaulieu JJ. 2013. Estimating autotrophic respiration in streams using daily metabolism data. Freshwater Sci. 32:507–516.
- Hall RO, Tank JL. 2003. Ecosystem metabolism controls nitrogen uptake in streams in Grand Teton National Park, Wyoming. Limnol Oceanogr. 48:1120–1128.
- Hall RO, Tank JL. 2005. Correcting whole-stream estimates of metabolism for groundwater input. Limnol Oceanogra: Methods. 3:222–229.
- Hill RA, Hawkins CP, Jin J. 2014. Predicting thermal vulnerability of stream and river ecosystems to climate change. Clim Change. 125:399–412.
- Hilsenhoff, W.L. 1987. An improved biotic index of organic stream pollution. Great Lakes Entomol. 20:31–39.
- Hoellein TJ, Bruesewitz DA, Richardson DC. 2013. Revisiting Odum (1956): a synthesis of aquatic ecosystem metabolism. Limnol Oceanogr. 58:2089–2100.
- Hoellein TJ, Tank JL, Rosi-Marshall EJ, Entrekin SA, Lamberti GA. 2007. Controls on spatial and temporal variation of nutrient uptake in three Michigan headwater streams. Limnol Oceanogr. 52:1964–1977.
- Holmes RM, Fisher SG, Grimm NB, Harper BJ. 1998. The impact of flash floods on microbial distribution and biogeochemistry in the parafluvial zone of a desert stream. Freshwater Biol. 40:641–654.
- Hondzo M, Voller VR, Morris M, Foufoula-Georgiou E, Finlay J, Ganti V, Power ME. 2013. Estimating and scaling stream ecosystem metabolism along channels with heterogeneous substrate. Ecohydrology. 6:679–688.
- Hornberger GM, Kelly MG. 1975. Atmospheric reaeration in a river using productivity analysis. J Environ Eng Division ASCE. 101:729–739.
- Hotchkiss ER, Hall RO Jr. 2014. High rates of daytime respiration in three streams: Use of δO182 and O2 to model diel ecosystem metabolism. Limnol Oceanogr. 59:798–810.
- Huryn AD, Benstead JP, Parker SM. 2014. Seasonal changes in light availability modify the temperature dependence of ecosystem metabolism in an arctic stream. Ecology. 95:2826–2839.
- Irons JG, Oswood MW, Stout RJ, Pringle CM. 1994. Latitudinal pattern in leaf breakdown: is temperature really important? Freshwater Biol. 32:401–411.
- Izagirre O, Bermejo M, Pozo J, Elosegi A. 2007. RIVERMET®: An Excel-based tool to calculate river metabolism from diel oxygen concentration curves. Environ Modelling and Software. 22:24–32.
- Jankowski K, Schindler DE, Lisi PJ. 2014. Temperature sensitivity of community respiration rates in streams is associated with watershed geomorphic features. Ecology. 95:2707–2714.
- Kaushal SS, Likens GE, Jaworski NA, Pace ML, Sides AM, Seekell D, Belt KT, Secor DH, Wingate RL. 2010. Rising stream and river temperatures in the United States. Front Ecol Environ. 8:461–466.
- Kaya CM, Kaeding LR, Burkhalter DE. 1977. Use of a cold-water refuge by rainbow and brown trout in a geothermally heated stream. Progressive Fish-Culturist 39:37–39.
- King DK, Cummins KW. 1989. Autotrophic-heterotrophic community metabolism relationships of a woodland stream. J Freshwater Ecol. 5:205–218.
- Kosinski RJ. 1984. A comparison of the accuracy and precision of several open-water oxygen productivity techniques. Hydrobiologia. 119:139–148.
- Kuserk FT. 1989. Measuring Discharge and Materials Transport in Stream Ecosystems. Am Biol Teach. 51:100–102.
- Lamberti GA, Gregory SV, Ashkenas LR, Lie JL. 1995. Influence of grazer type and abundance on plant-herbivore interactions in streams. Hydrobiologia. 306.3:179–188.
- Marcarelli AM, Van Kirk RW, Baxter CV. 2010. Predicting effects of hydrologic alteration and climate change on ecosystem metabolism in a western U.S. river. Ecol Appl. 20:2081–2088.
- Mayorga E, Aufdenkampe AK, Masiello CA, Krusche AV, Hedges JI, Quay PD, Richey JF, Brown TA. 2005. Young organic matter as a source of carbon dioxide outgassing from Amazonian rivers. Nature 436:538–541.
- McCutchan JH Jr., Saunders JF III, Lewis WM Jr., Hayden MG. 2002. Effects of groundwater flux on open-channel estimates of stream metabolism. Limnol Oceanogr. 47:321–324.
- McTammany M, Benfield EF, Webster JR. 2007. Recovery of stream ecosystem metabolism from historical agriculture. J North Ame Benthological Soc. 26:532–545.
- Mulholland PJ, Marzolf ER, Webster JR, Hart DR, Hendricks SP. 1997. Evidence that hyporheic zones increase heterotrophic metabolism and phosphorus uptake in forest streams. Limnol Oceanogr. 42:443–451.
- Mulholland PJ, Fellows CS, Tank JL, Grimm NB, Webster JR, Hamilton SK, Martiâ E, Ashkenas L, Bowden WB, Dodds WK, et al. 2001. Inter-biome comparison of factors controlling stream metabolism. Freshwater Biol. 46:1503–1517.
- Nelson CE, Bennett DM, Cardinale BJ. 2013. Consistency and sensitivity of stream periphyton community structural and functional responses to nutrient enrichment. Ecol Appl. 23:159–173.
- O'Connor BL, Harvey JW, McPhillips LE. 2012. Thresholds of flow-induced bed disturbances and their effects on stream metabolism in an agricultural river. Water Resour Res. 48:W08504, doi: 10.1029/2011WR011488.
- Odum HT. 1956. Primary production in flowing waters. Limnol Oceanogr. 1:102–117.
- Palmer MA, Reidy Liermann CA, Nilsson C, Flörke M, Alcamo J, Lake PS, Bond N. 2008. Climate change and the world's river basins: anticipating management options. Front Ecol Environ. 6:81–89.
- Palmer MA, Lettenmaier DP, Poff NL, Postel SL, Richter B, Warner R. 2009. Climate change and river ecosystems: protection and adaptation options. Environ Manage. 44:1053–1068.
- Peterjohn WT, Correll DL. 1984. Nutrient Dynamics in an Agricultural Watershed: Observations on the Role of A Riparian Forest. Ecology. 65:1466–1475.
- Pringle CM, Triska FJ. 2006. Effects of nutrient enrichment on periphyton. In: Hauer, FR, Lamberti GA, editors. Methods in Stream Ecology. 2nd ed. New York (NY): Academic Press.
- Reichert P, Uehlinger U, Acuña V. 2009. Estimating stream metabolism from oxygen concentrations: Effect of spatial heterogeneity. J Geophysical Res. 114:G03016, doi:10.1029/2008JG000917.
- Rier ST, Stevenson RJ. 2006. Response of periphytic algae to gradients in nitrogen and phosphorus in streamside mesocosms. Hydrobiologia. 561:131–147.
- Riley AJ, Dodds WK. 2013. Whole-stream metabolism: strategies for measuring and modeling diel trends of dissolved oxygen. Freshwater Sci. 32:56–69.
- Roberts BJ, Mulholland PJ. 2007. In-stream biotic control on nutrient biogeochemistry in a forested stream, West Fork of Walker Branch. J Geophysical Res. 112:G04002. doi:10.1029/2007JG000422.
- Roberts BJ, Mulholland PJ, Hill WR. 2007. Multiple Scales of Temporal Variability in Ecosystem Metabolism Rates: Results from 2 Years of Continuous Monitoring in a Forested Headwater Stream. Ecosystems. 10:588–606.
- Roley SS, Tank JL, Griffiths NA, Hall RO, Davis RT. 2014. The influence of floodplain restoration on whole-stream metabolism in an agricultural stream: insights from a 5-year continuous data set. Freshwater Sci. 33:1043–1059.
- Sanderson BL, Coe HJ, Tran CD, Macneale KH, Harstad DL, Goodwin AB. 2009. Nutrient limitation of periphyton in Idaho streams: results for nutrient diffusing substrate experiments. J North Am Benthological Soc. 28:832–845.
- Seavy NE, Gardali T, Golet GH, Griggs FT, Howell CA, Kelsey R, Small SL, Viers JH, Weigana JF. 2009. Why climate change makes riparian restoration more important than ever: recommendations for practice and research. Ecol Restoration. 27:330–8.
- Simmons JA, Anderson M, Dress W, Hanna C, Hornbach DJ, Jamaal A, Kuserk F, March JG, Murray T, Niedzwiecki J, et al. 2014. A comparison of the temperature regime of short stream segments under forested and non-forested riparian zones at eleven sites across North America. River Res Appl. (wileyonlinelibrary.com) DOI: 10.1002/rra.2796
- Statzner B, Müller R. 1989. Standard hemispheres as indicators of flow characteristics in lotic benthos research. Freshwater Biol. 21:445–459.
- Tank JL, Rosi-Marshall EJ, Griffiths NA, Entrekin SA, Stephen ML. 2010. A review of allochthonous organic matter dynamics and metabolism in streams. J North Am Benthological Soc. 29:118–146.
- Thomas SM, Griffiths SW, Ormerod SJ. 2015. Adapting streams for climate change using riparian broadleaf trees and its consequences for stream salmonids. Freshwater Biol. 60:64–77.
- Toetz DW. 1999. Multiple limiting nutrients in a subalpine stream, Colorado front range. J Freshwater Ecol. 14:349–355.
- Uehlinger U, Naegeli MW. 1998. Ecosystem metabolism, disturbance, and stability in a prealpine gravel bed river. J North Am Benthological Soc. 17:165–178.
- Wahl CN, Neils A, Hooper D. 2013. Impacts of land use at the catchment scale constrain the habitat benefits of stream riparian buffers. Freshwater Biol. 58:2310–2324.
- Webster JR, Valett HM. 2006. Solute dynamics. In: Hauer FR, Lamberti GA. editors. Methods in Stream Ecology. 2nd ed. New York (NY): Academic Press; p. 169–185.
- Wenck and Associates. 2014. Detailed hydrogeologic characterization and evaluation, proposed wastewater treatment site, City of Afton (MN). Wenck File # 2656-03. [cited 2014 Nov 21]. Available from: http://www.ci.afton.mn.us/vertical/sites/%7B255148F5-88B9-45F6-9726-DD95D24AA11D%7D/uploads/Final_HydroGeo_Report__0124141.pdf
- Wilby RI, Johnson MF, Toone JA. 2014. Nocturnal river water temperatures: spatial and temporal variations. Sci Total Environ. 482-483:157–173.
- Woodward G, Perkins DM, Brown LE. 2010. Climate change and freshwater ecosystems: impacts across multiple levels of organization. Philosophical Trans Royal Soc B. 365:2093–2106.
- Yates AG, Brua RB, Culp JM, Chambers PA. 2013. Multi-scaled drivers of rural prairie stream metabolism along human activity gradients. Freshwater Biol. 58:675–689.
- Young RG, Matthaei CD, Townsend CR. 2008. Organic matter breakdown and ecosystem metabolism: functional indicators for assessing river ecosystem health. J North Am Benthological Soc. 27:605–625.
- Yvon-Durocher G, Caffrey JM, Cescatti A, Dossena M, Giorgio PD, Gasol JM, Montoya JM, Pumpanen J, Staehr PA, Trimmer M, Woodward G, Allen AP. 2011. Reconciling the temperature dependence of respiration across timescales and ecosystem types. Nature. 487:472–476.
- Zapp MJ, Almendinger JE. 2001. Nutrient dynamics and water quality of valley creek, a high-quality trout stream in southeastern Washington County. Final Project Report to the Valley Branch Watershed District. St. Paul: Water Resources Science, University of Minnesota.