
Abstract
Rainfall-induced nutrient fluctuations in surface water affect phytoplankton communities and cause algal blooms. To examine this influence in the Zhoucun Reservoir, China, field surveys were performed weekly or biweekly from February 2013 (a wet year) to December 2014 (a dry year). Physical conditions, nutrient levels, and phytoplankton functional groups were investigated during monitoring. Nutrient levels increased in the summer of 2013 (TN: 0.85–2.66 mg/L; TP: 0.037–0.138 mg/L), while nitrogen deficiency occurred in the summer of 2014 (TN: 0.38–0.73 mg/L, TP: 0.044–0.079 mg/L). A cyanobacteria bloom that appeared in the summer of 2013 had the dominant phytoplankton functional groups M and Tc. In the summer of 2014, algal cell density and biomass were much lower than those during the corresponding period in 2013, and the co-dominant phytoplankton groups were F, L0, Tc, and S2. Non-N-fixing cyanobacteria were not abundant in summer 2013 probably because of the low ratio of NO3− to NH4+, although nitrogen was also deficient. In contrast to these summer trends, little difference was noted between phytoplankton dynamics and community structure in the two winters and two springs, regardless of nutrient conditions. Redundancy analysis indicated that rainfall-induced nitrogen fluctuations were the primary factor causing phytoplankton dynamics to differ between the wet and dry year. The effects of water temperature, stratification, and light on the phytoplankton community were independent of nutrient fluctuations. This study shows that rainfall fluctuations change summer nutrient conditions and that cyanobacteria blooms are likely to occur in wet years in the Zhoucun Reservoir.
Introduction
Algal blooms are a global surface water problem and compromise drinking water quality and aquatic environments (Vonlanthen et al. Citation2012; Horst et al. Citation2014). Algal blooms require factors such as adequate nutrients, long water retention time, stable hydraulic condition, suitable water temperature, and adequate light intensity to exist (Dokulil and Teubner Citation2000, Jacoby et al. Citation2000). The key factors that result in algal blooms vary with phytoplankton community and environmental conditions (Paerl and Huisman Citation2008). Algal blooms often occur in lakes, reservoirs, and slow-moving rivers when sufficient nutrients are available. Anthropogenic activities have led to increased nutrient discharges, which in turn result in higher nitrogen (N) and phosphorous (P) concentrations in lakes and reservoirs. Numerous studies have reported increases in algal bloom frequency in lakes and reservoirs because of increasing nutrient availability (Duan et al. Citation2009; Winter et al. Citation2011; Bridgeman et al. Citation2013).
Although P was initially regarded as the key factor controlling algal bloom occurrence in surface water, N has been receiving attention recently (Elser et al. Citation2007). The content, structure, and ratio of nutrients in aquatic systems profoundly influence phytoplankton dynamics and community structure (Zhao and Quigg Citation2014). Because the response of algae to nutrient fluctuations varies by species (Donald et al. Citation2013), the effects of nutrients on phytoplankton communities are site specific (Xu et al. Citation2014). Most nutrient enrichment studies investigating the influence of nutrients on phytoplankton have been conducted in controlled environments, such as microcosms (Wever et al. Citation2008; Xu et al. Citation2013; Paerl et al. Citation2014) and mesocosms (Gardner et al. Citation2008; Zhang et al. Citation2014). However, specific ecological conditions in lakes and reservoirs (such as stratification, nutrient release, and hydraulic conditions) cannot be simulated entirely in such experiments (Carpenter Citation1996; Schindler et al. Citation2008). Whole-ecosystem studies or field surveys do not have such a drawback (Jansson et al. Citation2001; Vadeboncoeur et al. Citation2001; Schindler et al. Citation2008). Nevertheless, too few in situ studies have been conducted to understand the response of phytoplankton to nutrient fluctuations in different parts of the world.
Along with air, soil, and water pollution, rainfall-induced nutrient fluctuations are increasingly affecting phytoplankton communities. Field surveys have been conducted on the influence of short-term rainfall on algal blooms and the phytoplankton community. For example, Nõges et al. (Citation2011) showed that precipitation increased nutrient levels and algal biomass in Lake Varese and Paidere et al. (Citation2007) reported that floods increased phytoplankton diversity and decreased phytoplankton biomass in two floodplain lakes. In addition, the effects of nutrients on phytoplankton communities have been compared among different water bodies in the same area: Gikuma-Njuru et al. (Citation2013) revealed that the Nyanza Gulf of Lake Victoria was P-deficient and dominated by non-nitrogen-fixing cyanobacteria, whereas Lake Victoria as a whole was N-deficient and occupied by diazotrophic cyanobacteria and diatoms. However, to our knowledge, only rarely have phytoplankton dynamics and communities in lakes or reservoirs been compared between dry and wet years.
In this study, we investigated the physical conditions, nutrient levels, and algae growth in the Zhoucun Reservoir in a wet year (2013) and a dry year (2014). The aims of the present study were to (1) compare the nutrient content, form, and ratios between the two years; (2) compare phytoplankton community dynamics and structure between the two years; and (3) determine the relationship between phytoplankton community structure and environmental factors in each of the two years. We conducted field surveys to address these goals. This study may shed light on the response of phytoplankton to rainfall fluctuation in temperate lakes and reservoirs in northern China. The data obtained in this study are essential for effectively managing eutrophication.
Methods
Study area
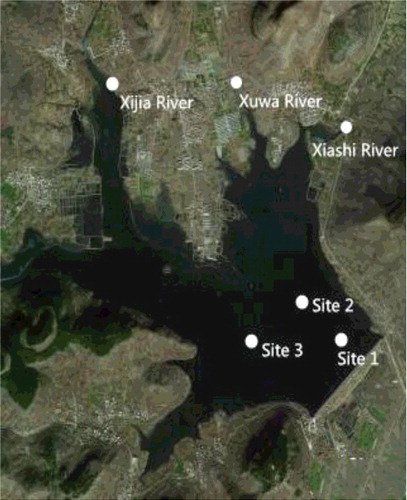
The Zhoucun Reservoir is a medium-sized reservoir whose functions are to control floods, irrigate, generate power, and supply drinking water for the city of Zaozhuang, located in eastern China. The reservoir receives run off from a 121 km2 hilly catchment, which comprises villages, agricultural land, and forest. The reservoir's total storage capacity is 84.04 million m3 and the flood control capacity is 33.04 million m3. The reservoir has a surface area of 6.5 km2 with a mean depth of 13 m and elevation range of 121–128 m. The region is located in the temperate zone with a sub-humid continental monsoon climate. The average annual air temperature is 11–14 °C, with the lowest and highest air temperatures of about −10 °C in January and about 35 °C in July. The mean annual precipitation is 847 mm. Three rivers flow into the reservoir: the Xuwa and Xiashi rivers, located northwest of the reservoir, and the Xijia river, located to the northeast. Of the three, the Xiashi and Xuwa rivers are relatively polluted due to the presence of chicken farms along their banks.
Sampling and pretreatment
Sampling was carried out weekly or biweekly in the reservoir and monthly in the inflow rivers from February 2013 to December 2014 (sampling was not conducted in January 2013, when the reservoir was frozen). The three sampling sites in the reservoir were located in the pelagic zone (34° 56′ 38.49″ N, 117° 41′ 14.03″ E; 34° 56′ 38.86″ N, 117° 41′ 4.52″ E; and 34° 56′ 44.05″ N, 117° 41′ 14.68″ E), while the sampling sites in the inflow rivers were near the entrance of the reservoir (). The three sampling sites in the pelagic zone of the reservoir were considered replicates. Water samples were collected using a 2.5-L Van Dorn bottle at 0.5 m depth between 10:00 and 12:00 hrs. Water temperature (T), dissolved oxygen (DO), and water transparency (SD) were measured in situ. Vertical T and DO profiles were measured using Hydrolab™ DS5, while SD was measured using a Secchi disk. Samples for nutrient analyses were stored in acid-washed polyethylene bottles and preserved at 4 °C. Water samples for phytoplankton analysis were preserved using Lugol's solution.
Figure 1. Sampling sites in the Zhoucun Reservoir and the inflow rivers.
Sample analysis
Nutrient analyses such as total nitrogen (TN), dissolved total nitrogen (DTN), ammonium (NH4+), nitrate (NO3−), total phosphorus (TP), and soluble reactive phosphorus (SRP) were completed within 24 h of sample collection in the laboratory using standard water quality analysis methods (Administration Citation2002). Water was filtered through a cellulose acetate membrane for DTN and SRP analyses. TN, DTN, and NO3− were all measured in the same manner, although TN and DTN were first treated with a persulfate digestion to convert organic N to NO3− and all NO3− was then measured with the sulfanilamide method. NH4+ was measured using the phenol--hypochlorite method. TP and SRP were analyzed with the molybdate-blue method. Rainfall data were collected from the Zaozhuang City online remote sensing database. The euphotic zone (Zeu) was found to be 2.7 times as deep as the SD zone (Cole Citation1975). The mixed zone (Zmix) is the depth where dO2/dz reaches the maximum (Armengol et al. Citation1999). Zeu/Zmix can be used to evaluate the light availability in the mixed zone (Jensen et al. Citation1994).
Relative water column stability (RWCS) was calculated to describe the thermal stratification of the Zhoucun Reservoir (Xiao et al. Citation2011):where DB is the water density at the bottom, Ds is the water density at the surface, D4 is that at 4 °C, and D5 at 5 °C. Calculations of loads of inflow nutrients were made by taking a one-month period as the basic time interval. The nutrient load was calculated as follows:
where i = January to December, j = 1 to 3, with the numbers representing the inflow rivers, qij is the runoff of river j in month i, cij is the average nutrient concentration of river j in month i. Discharge data of the three rivers were supplied by the Bureau of Water Resources of Zaozhuang Municipality.
Phytoplankton identification and counts were performed using an Olympus microscope at 400× magnification according to Hu and Wei (Citation2006). Each sample was counted until approximately 200 cells of the dominant species were recorded, giving a precision of ±20% within a 95% confidence limit. Algal biomass was estimated from biovolumes (Hillebrand et al. Citation1999), assuming the algal cell density as 1 mg/mm3. The average biovolume of each species was calculated based on at least 10 specimens. Phytoplankton assemblages were divided into functional groups in accordance with the scheme proposed by Reynolds et al. (Citation2002). The functional groups that contributed more than 5% to the total algal biomass were designated as the dominant functional groups (Xiao et al. Citation2011). The Jaccard index (JI) was applied for estimating the similarity in terms of the phytoplankton species composition between the same period in each of the two years (Jaccard Citation1908). The Jaccard formula iswhere a is the number of species present in both samples (the same period of the two years), b is the number of species present in sample 1, but absent from sample 2, and c is the number of species present in sample 2, but absent from sample 1.
The relationship between phytoplankton functional groups and environmental variables was analyzed using CANOCO version 4.5. Phytoplankton functional group data were transformed by log(x + 1) before a detrended correspondence analysis (DCA). Redundancy analysis (RDA) was then performed using the biological and environmental data.
Results
Physical conditions
Rainfall patterns differed between 2013 and 2014 in the Zhoucun Reservoir ((a)). The long-term (1995–2015) average annual rainfall is 847 mm. The maximum annual rainfall was 1103 mm (in 1996) while the minimum annual rainfall was 698 mm (in 2003). The total rainfall in 2013 was 904 mm, which is above the average; hence we designated 2013 as a wet year. Rainfall in 2013 mainly occurred in the summer with the maximum in July, accounting for 44.2% of the full year. Rainfall in August and September was 162 and 65.5 mm, respectively. The total precipitation in 2014 was 758.5 mm, which was in the middle of the mean annual value and minimum value; therefore, we designated 2014 as a dry year. In 2014, rainfall was relatively evenly distributed from May to September.
Figure 2. Physical conditions in 2013 and 2014 in the pelagic zone of Zhoucun Reservoir. (a) Precipitation, (b) water temperature and RWCS, (c) the mixing zone (Zmix), euphotic zone (Zeu), and Zeu/Zmix.
The thermal structure of the Zhoucun Reservoir in 2013 was similar to that in 2014 ((b)). The stratified period of the Zhoucun Reservoir was from May to October 2013, while the mixing period was from November 2013 to April 2014. Water temperature slightly differed between the two years. The seasonal changes of RWCS and water temperature in the Zhoucun Reservoir were unimodal. The highest monthly average water temperature occurred in July (about 28–29 °C) and the lowest in January (about 0–1 °C).
Light availability in the mixing layer in 2013 was very similar to that in 2014 ((c)). Zeu/Zmix was higher in summer and lower in winter and spring in the Zhoucun Reservoir.
Nutrient dynamics
Nitrogen levels varied seasonally in the Zhoucun Reservoir ((a)). Nitrate was the most abundant nitrogen species in the Zhoucun Reservoir most of the time and, thus, it heavily influenced TN. Ammonium was the second most abundant source of nitrogen, while NO2− was least abundant. Nitrogen levels were higher during the summer of 2013 (TN: 0.85 2.66 mg/L) than 2014 (TN: 0.38–0.73 mg/L). The proportion of each nitrogen species likewise differed between the two summers. In the summer of 2013, NO3− accounted for 28.4%–71.3% of TN while NH4+ contributed 14.3%–39.8%. The ratio of NO3− to NH4+ was 1.34–4.17. In the summer of 2014, NO3− made up only 5.1%–30% while NH4+ contributed 32.6%–58% of TN. The ratio of NO3− to NH4+ was only 0.08–0.69.
Figure 3. Seasonal variations of nutrients concentration from 2013 to 2014 in the Zhoucun Reservoir. (a) Nitrogen, (b) TP and SRP, (c) TN:TP.
The concentrations of TP and SRP were high in the summer of 2013 and relatively low in the summer of 2014 ((b)). SRP was similar to TP in 2013, but the two varied in 2014.
TN:TP in 2014 was much lower than that in 2013 ((c)). This ratio ranged from 9.8 to 198 (on July 9 and April 16, respectively) in 2013, while it was only 5.9 to 92 (on September 13 and February 19, respectively) in 2014. In the summer and autumn of 2014, TN:TP fluctuated but remained low (5.9–16.7).
The inflow water of the Zhoucun Reservoir brought large amounts of nutrients (). Cao et al (Citation2013) indicated that the release of NH4+ and TP from sediment in the Zhoucun Reservoir were 7.6 and 7.3 t/year, respectively. The inflow nitrogen load was much higher than the internal nitrogen load, while the inflow phosphorus load was lower than the internal phosphorus load. Analysis of inflow nitrogen load revealed that nitrate was the primary nitrogen species, followed by ammonium. The inflow TN load in the wet year (2013) was 2.4 times as much as that in the dry year (2014), which was responsible for the higher nitrogen level in the wet year (2013).
Table 1. Annual ranges of nutrient concentrations, runoff volume, and nutrient loads of inflows to the Zhoucun Reservoir, China.
Phytoplankton dynamics and community structure
A total of 124 species of phytoplankton belonging to 7 phyla and 21 phytoplankton functional groups were detected during monitoring. There were 13 dominant phytoplankton functional groups in the Zhoucun Reservoir (). Algal cell density and algal biomass were correlated in 2013 and 2014 (). In 2013, algal cell density reached its maximum (7.384 × 10⁷ cells/L) on September 8 and the minimum (1.188 × 10⁶ cells/L) on April 16. In 2014, the maximum (4.875 × 10⁷ cells/L) was seen on July 13 and the minimum (420 × 104 cells/L) on April 24. Algal cell density was about 2000 × 104 cells/L in the summer of 2014, which was much lower than that in the summer of 2013.
Table 2. Common phytoplankton functional groups and representative species in the Zhoucun Reservoir.
Figure 4. Seasonal variations in algal cell density and biomass from 2013 to 2014 in the Zhoucun Reservoir.
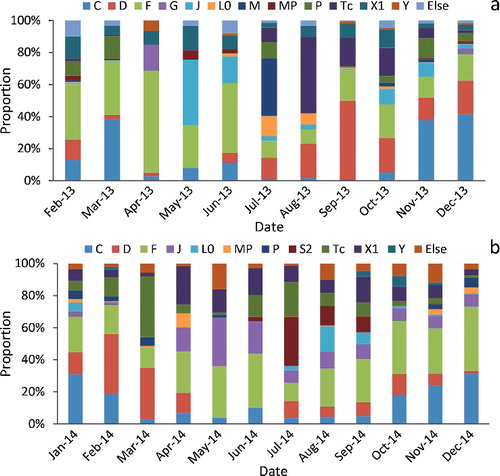
The 13 dominant phytoplankton functional groups underwent seasonal succession in the Zhoucun Reservoir (). In 2013, groups M and Tc belonging to Cyanophyta accounted for more than 50% of the algal biomass in summer. Groups Tc, F, X1, and D prevailed in autumn. In contrast, the co-dominant groups were F, L0, Tc, and S2 in the summer of 2014 and C, F, and X1 in the autumn of 2014. Groups C, D, and F dominated during both winters and early spring, while groups F and J were dominant in the two late spring seasons. According to the Jaccard index, the similarities of the phytoplankton community were highest in spring, with the maximum of 66.7% for May 2013. In the summer of 2013, the low similarity with the range of 18.2% (July) to 28.6% (September).
Figure 5. Seasonal succession of phytoplankton functional groups in the Zhoucun Reservoir. (a) The wet year (2013) and (b) the dry year (2014).
Redundancy analysis
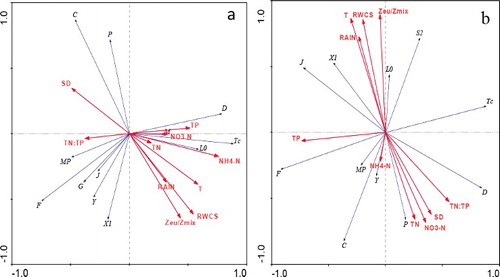
The maximum gradient length for the 13 dominant phytoplankton functional groups was 2.25 in 2013 and 1.64 in 2014. Therefore, RDA was carried out to test the relationship between the phytoplankton community and environmental variables (; Lepš and Šmilauer Citation2003). In the 2013 RDA biplot, the first two axes explained 63.4% of the phytoplankton–environment correlations (axis 1: 38.8%; axis 2: 24.6%). RWCS, Zeu/Zmix, and T had marked effects on phytoplankton community, while TN and NO3− had little influence. Groups L0, Tc, and D showed a strong positive correlation with NH4+. Groups C and P negatively correlated with RWCS, Zeu/Zmix, and T. In the 2014 RDA biplot, the first two axes accounted for 74.2% of the variance in the relationship between phytoplankton and the environment (axis 1: 46.8%; axis 2: 27.6%). TN, TP, NO3−, T, RWCS, and Zeu/Zmix were all important factors for explaining phytoplankton community succession. Rainfall, RWCS, T, and Zeu/Zmix were positively related to groups L0, X1, and S2. TP showed a positive relationship with groups F and J. TN, NO3−, and SD were positively associated with group P.
Figure 6. RDA biplot of dominant phytoplankton functional groups and environmental factors. (a) The wet year and (b) the dry year. TN = total nitrogen; NO3-N = nitrate; TP = total phosphorus; NH4-N = ammonia nitrogen; T = water temperature at 0.5 m; RAIN = rainfall; SD = water transparency; N:P = TN/TP.
Discussion
Nitrate differences between the wet year (2013) and the dry year (2014) were more significant than interannual differences of other environmental variables in the Zhoucun Reservoir in those two years. There are two ways by which nutrients can enter the reservoir: exogenous input and endogenous release. Exogenous input mainly comes from rainfall-induced runoff, whose primary nitrogen source is NO3− (Rabalais Citation2002; Lehman et al. Citation2015), whereas NH4+ is the primary form of nitrogen if released from the sediment under anaerobic conditions (Reddy et al. Citation1996). Given the similar thermal stratification and sediment properties of the Zhoucun Reservoir in 2013 and 2014, the amount of nutrients discharged from the sediment probably varied little between the two years. Therefore, rainfall fluctuation likely altered the concentration of NO3− in the Zhoucun Reservoir, affecting nitrogen species and the mass ratio of N to P. This in turn may have influenced phytoplankton dynamics and community structure (Horst et al. Citation2014, Zhao and Quigg Citation2014).
Phytoplankton community structure is thought to be determined by its limiting resource (Danger et al. Citation2008; Becker et al. Citation2010). It has been reported that the eutrophication threshold of N for lakes and reservoirs is about 1 mg/L (Lin et al. Citation2008). The concentration of TN ranged from 0.85 to 2.74 mg/L in the Zhoucun Reservoir in 2013, indicating that N was sufficient for phytoplankton growth. In contrast, the range of TN was 0.38–0.73 mg/L in the summer of 2014, implying N deficiency during this period. Consequently, the N concentration difference, which may be influenced by rainfall, was one of the key factors responsible for the difference in phytoplankton growth between 2013 and 2014.
Previous studies have indicated that N greatly affects phytoplankton community structure in lakes and reservoirs in the temperate zone (Huszar and Caraco Citation1998; Palsson and Graneli Citation2004), subtropics (Lv et al. Citation2011), and tropics (Leon Lopez et al. Citation2012). The amount of energy required by algae to absorb N varies depending on the algal species and N form (Donald et al. Citation2013); thus, phytoplankton communities respond differently to the addition of different types of N. Therefore, the different nutrient forms also may be responsible for the different phytoplankton community between the two years.
Nitrogen deficiency occurred in the Zhoucun Reservoir in the summer of 2014 and N-fixing cyanobacteria did not dominate the phytoplankton community in terms of biomass. Some studies have indicated that N-fixing cyanobacteria become dominant in summer with a nitrogen shortage (Mugidde et al. Citation2003; Marcarelli and Wurtsbaugh Citation2009; Paterson et al. Citation2011). However, N-fixing cyanobacteria did not dominate the phytoplankton community in several additional studies under analogous circumstances (Havens et al. Citation2003; Scott and McCarthy Citation2010; Gikuma-Njuru et al. Citation2013). The common N-fixing cyanobacteria in temperate lakes are Oscillatoria spp., Nostoc spp., and Anabaena spp. These species are capable of converting dinitrogen (N2) into NH4+ (Markou et al. Citation2014) and prefer eutrophic lakes with low nitrogen content (Padisák et al. Citation2009). Non-N-fixing cyanobacteria are better able to assimilate NH4+ than N-fixing cyanobacteria (Blomqvist et al. Citation1994). During the stratification of 2014, NH4+ was released from the sediment and was maintained at 0.19–0.37 mg/L in the epilimnion of the Zhoucun Reservoir, when exogenous N inputs were much lower than in the wet year (2013). Hence, the relatively adequate levels of NH4+ may be at the most influence of non-N-fixing cyanobacteria. Previous studies have suggested that N-fixing cyanobacteria can outcompete non-N-fixing cyanobacteria only under sufficient P levels (Piehler et al. Citation2009; Vahtera et al. Citation2010). The concentration of SRP was 2–8 μg/L in the summer of 2014 in the Zhoucun Reservoir and may be inadequate for an N-fixing cyanobacteria bloom (Vrede et al. Citation2009).
Nutrient fluctuations which may be induced by rainfall had a large influence on the dominance of Microcystis blooms in the Zhoucun Reservoir. Microcystis spp. belong to group M and usually appear in eutrophic and standing water (Padisák et al. Citation2009). Compared to July 2014, the N and P introduced by rainfall in July 2013 provided suitable conditions for Microcystis blooms. Additional nitrogen has previously been found to facilitate Microcystis blooms (Downing et al. Citation2005; Moisander et al. Citation2009). A similar phenomenon was reported in a lake in eastern USA (Davis et al. Citation2010). However, the Microcystis bloom in our study disappeared in August 2013 despite high nutrient levels (dissolved inorganic nitrogen (DIN) = 2.05 mg/L, SRP = 0.03 mg/L). Previous studies have suggested that the content and structure of N significantly influence Microcystis blooms. Liu et al. (Citation2011) found that the biomass of Microcystis spp. was positively related to the ratio of NH4+ to NO3−. Jacoby et al. (Citation2000) suggested that Microcystis spp. dominance was positively associated with a low ratio of NO3− to NH4+ and a low ratio of N to P. With increasing NO3− introduced by runoff, the ratio of NH4+ to NO3− declined from 0.75 to 0.24 in the Zhoucun Reservoir in August 2013. Afterward, group Tc, which is well adapted to eutrophic standing waters with low light intensity (Padisák et al. Citation2009), replaced group M. The addition of N and P, as occurred in the Zhoucun Reservoir in August 2013 (), is known to promote the growth of group Tc (E-wen Citation2010). However, the concentration of NO3− in August 2013 (about 2.5 mg/L) was above the reported nitrate–N saturation concentration for Lyngbya wollei, which belongs to group Tc (Cowell and Dawes Citation2004). This indicates that group Tc could have obtained a high growth rate in August 2013.
The ratio of N to P (TN:TP) in the Zhoucun Reservoir varied with rainfall, leading to the transformation from nitrogen deficiency to phosphorus deficiency. The classic ratio (7:1 by mass) proposed by Redfield (Redfield Citation1958) cannot be applied to all ecological conditions. Sterner et al. (Citation2008) suggested that a power function should be used instead of the constant ratio. Klausmeier et al. (Citation2004) suggested that the optimal ratio varied with species and ranged from 8.2 to 45. Although the optimal ratio is still controversial, Klausmeier et al. (Citation2004) found that the species whose structural N:P ratio was less than 30 accounted for 89% of the 29 phytoplankton species. Therefore, it can be concluded that the Zhoucun Reservoir had a tendency for P limitation during the monitoring period except during the summer of 2014 (TN:TP = 5.9–16.7). The N decrease induced by reduced rainfall was primarily responsible for the decline of TN:TP and the transformation from P limitation to N limitation in the summer of 2014.
Groups C and D dominated the Zhoucun Reservoir in the winter and spring of both years. The difference of phytoplankton community structure between the two winters and between the two springs was not significant despite different nutrient levels. Deng et al. (Citation2014) concluded that nutrient concentrations had a greater influence on phytoplankton community succession at higher temperatures. For this reason, the low water temperature in winter and spring may have mitigated the effects of nutrients on phytoplankton in the Zhoucun Reservoir. Group C is sensitive to stratification and silicate and is usually abundant in spring, while group D is sensitive to nutrient depletion and usually inhabits eutrophic, shallow, and turbid waters (Reynolds et al. Citation2002). The abundance of groups C and D was negatively correlated with temperature (), which was consistent with the results of previous studies (Zhang and Prepas Citation1996; Calijuri et al. Citation2002; Fernandez et al. Citation2014). Group C was positively related to NO3−, which is consistent with Donald et al. (Citation2013).
T, RWCS, and Zmix/Zeu were important factors affecting phytoplankton community succession in the wet year and in the dry year in the Zhoucun Reservoir. Reynolds (Citation2006) suggested that temperature, stratification, and light were crucial for algal growth, which was also true in this study. The optimal temperature for algal growth varies with the species (Winder and Schindler Citation2004; Reynolds Citation2006; Trolle et al. Citation2011). In both 2013 and 2014, seasonal phytoplankton succession fits the plankton ecology group (PEG) model, which was based on seasonal variations in temperature (Sommer et al. Citation1986). RWCS represents thermal structure, which strongly influenced phytoplankton community structure. Some groups (such as C, D, and F) that prefer the mixed conditions accounted for a relatively high proportion of the phytoplankton community in winter and spring in the Zhoucun Reservoir. In contrast, other groups (such as M and L0) prevailed during stratification (Reynolds et al. Citation2002; Padisák et al. Citation2009). Group C, which is adapted to low light conditions, was negatively related to Zmix/Zeu. Groups S2 and L0, which can tolerate high light intensity, were positively associated with Zmix/Zeu.
Fluctuations in annual rainfall between the wet year and the dry year have inconsistent effects on phytoplankton community in lakes and reservoirs due to the different hydrological condition and pollution near the region. The phytoplankton community of Liuxihe Reservoir, which is subject to a subtropical monsoon climate, was significantly affected by the changing physical and chemical environment in an exceptionally wet year (Xiao et al. Citation2011), while the phytoplankton succession in Tenkiller Reservoir (Cooke et al. Citation2011) and Río Seco Lake (Garcia-Jurado et al. Citation2011) was influenced by the altering nutrient condition. For Zhoucun Reservoir, the rainfall in 2013 (wet year) was not strong enough to obviously change the physical conditions as Liuxihe Reservoir (). This study can provide guidance to deep lakes and reservoirs which belong to a sub-humid continental monsoon climate.
In the Zhoucun Reservoir, nitrate differences between the wet year (2013) and the dry year (2014) were greater than the differences in other environmental factors in these two years. Nitrate variations, which may be induced by rainfall, affected the content and structure of N and the ratio of N to P, thus influencing phytoplankton growth. Phytoplankton dynamics and community structure differed between the two summers and between the two autumns, but were not significantly different between the two winters and between the two springs. This study provides basic data that could be used to create and justify nutrient management strategies to prevent future eutrophication.
Acknowledgments
This study received the support of the National Science and Technology Pillar Program (No. 2012BAC04B02). We acknowledge the anonymous reviewers for their useful comments on the early version of the manuscript. We also wish to thank the agencies involved for sampling assistance.
Disclosure statement
No potential conflict of interest was reported by the authors.
Additional information
Funding
References
- Administration SEP. 2002. [Monitoring and analysis methods of water and wastewater, China]. 4th ed.. Beijing: Environmental Science Press. Chinese.
- Armengol J, Garcia J, Comerma M, Romero M, Dolz J, Roura M, Han B, Vidal A, Simek K. 1999. Longitudinal processes in canyon type reservoirs: The case of Sau (NE Spain). Paper presented at: Workshop on Theoretical Reservoir Ecology and its Applications; Sao Pedro, BR.
- Becker V, Caputo L, Ordonez J, Marce R, Armengol J, Crossetti LO, Huszar VLM. 2010. Driving factors of the phytoplankton functional groups in a deep Mediterranean reservoir. Water Res. 44:3345–3354.
- Blomqvist P, Petterson A, Hyenstrand P. 1994. Ammonium–nitrogen: a key regulatory factor causing dominance of non-nitrogen-fixing cyanobacteria in aquatic systems. Archiv für Hydrobiologie.132:141–164.
- Bridgeman TB, Chaffin JD, Filbrun JE. 2013. A novel method for tracking western Lake Erie Microcystis blooms, 2002–2011. J Great Lakes Res. 39:83–89.
- Calijuri M, Dos Santos A, Jati S. 2002. Temporal changes in the phytoplankton community structure in a tropical and eutrophic reservoir (Barra Bonita, SP—Brazil). J Plankton Res. 24:617–634.
- Cao ZH, Huang TL, Qiu XP, Shi JC. [Simulation of potential release of sediment pollutants at Zhoucun Reservoir]. Environ Sci Technol. 2013. 36: 41–44. Chinese
- Carpenter SR. 1996. Microcosm experiments have limited relevance for community and ecosystem ecology. Ecology. 77:677–680.
- Cole GA. 1975. Textbook of limnology. Spanish: The C.V. Mosby Company.
- Cooke GD, Welch EB, Jones JR. 2011. Eutrophication of Tenkiller Reservoir, Oklahoma, from nonpoint agricultural runoff. Lake Reservoir Manage. 27(3):256–270.
- Cowell BC, Dawes CJ. 2004. Growth and nitrate–nitrogen uptake by the cyanobacterium Lyngbya wollei. J Aquat Plant Manage. 42:69–71.
- Danger M, Daufresne T, Lucas F, Pissard S, Lacroix G. 2008. Does Liebig's law of the minimum scale up from species to communities? Oikos. 117:1741–1751.
- Davis TW, Harke MJ, Marcoval MA, Goleski J, Orano-Dawson C, Berry DL, Gobler CJ. 2010. Effects of nitrogenous compounds and phosphorus on the growth of toxic and non-toxic strains of Microcystis during cyanobacterial blooms. Aquat Microb Ecol. 61:149–162.
- Deng J, Qin B, Paerl HW, Zhang Y, Wu P, Ma J, Chen Y. 2014. Effects of nutrients, temperature and their interactions on spring phytoplankton community succession in Lake Taihu, China. PLoS One. 9:0113960.
- Dokulil MT, Teubner K. 2000. Cyanobacterial dominance in lakes. Hydrobiologia. 438:1–12.
- Donald DB, Bogard MJ, Finlay K, Bunting L, Leavitt PR. 2013. Phytoplankton-specific response to enrichment of phosphorus-rich surface waters with ammonium, nitrate, and urea. PLoS One. 8:0053277.
- Downing T, Meyer C, Gehringer M, Van de Venter M. 2005. Microcystin content of Microcystis aeruginosa is modulated by nitrogen uptake rate relative to specific growth rate or carbon fixation rate. Environ Toxicol. 20:257–262.
- Duan H, Ma R, Xu X, Kong F, Zhang S, Kong W, Hao J, Shang L. 2009. Two-decade reconstruction of algal blooms in China's Lake Taihu. Environ Sci Technol. 43:3522–3528.
- Elser JJ, Bracken MES, Cleland EE, Gruner DS, Harpole WS, Hillebrand H, Ngai JT, Seabloom EW, Shurin JB, Smith JE. 2007. Global analysis of nitrogen and phosphorus limitation of primary producers in freshwater, marine and terrestrial ecosystems. Ecol Lett. 10:1135–1142.
- E-wen L. 2010. Singapore reservoirs: quantifying water quality through physicochemical, algae, and invertebrate analyses. Singapore: National University of Singapore.
- Fernandez C, Caceres EJ, Parodi ER. 2014. Phytoplankton development in a highly eutrophic man-made lake from the Pampa plain of Argentina – a functional approach. Int J Environ Res. 8:1–14.
- Garcia-Jurado F, Jimenez-Gomez F, Guerrero, F. 2011. Effects of a dry period on the limnological characteristics of a Mediterranean high mountain lake. Limnetica. 30(1):5–16.
- Gardner EM, McKnight DM, Lewis Jr WM, Miller MP. 2008. Effects of nutrient enrichment on phytoplankton in an alpine lake, Colorado, USA. Arc, Antarct, Alp Res. 40:55–64.
- Gikuma-Njuru P, Guildford SJ, Hecky RE, Kling HJ. 2013. Strong spatial differentiation of N and P deficiency, primary productivity and community composition between Nyanza Gulf and Lake Victoria (Kenya, East Africa) and the implications for nutrient management. Freshwater Biol. 58:2237–2252.
- Havens KE, James RT, East TL, Smith VH. 2003. N:P ratios, light limitation, and cyanobacterial dominance in a subtropical lake impacted by non-point source nutrient pollution. Environ Pollut. 122:379–390.
- Hillebrand H, Dürselen CD, Kirschtel D, Pollingher U, Zohary T. 1999. Biovolume calculation for pelagic and benthic microalgae. J Phycol. 35:403–424.
- Horst GP, Sarnelle O, White JD, Hamilton SK, Kaul RB, Bressie JD. 2014. Nitrogen availability increases the toxin quota of a harmful cyanobacterium, Microcystis aeruginosa. Water Res. 54:188–198.
- Hu H, Wei Y. 2006. [The freshwater algae of China: systematic, taxonomy and ecology]. Beijing: Science Press. Chinese.
- Huszar VLD, Caraco NF. 1998. The relationship between phytoplankton composition and physical-chemical variables: a comparison of taxonomic and morphological-functional descriptors in six temperate lakes. Freshwater Biol. 40:679–696.
- Jaccard, P. 1908. Research on the distribution of flower. Bull De La Societe Vaudoise Des Sci Nat. 44(163):223–270.
- Jacoby JM, Collier DC, Welch EB, Hardy FJ, Crayton M. 2000. Environmental factors associated with a toxic bloom of Microcystis aeruginosa. Can J Fish Aquat Sci. 57:231–240.
- Jansson M, Bergström AK, Drakare S, Blomqvist P. 2001. Nutrient limitation of bacterioplankton and phytoplankton in humic lakes in northern Sweden. Freshwater Biol. 46:653–666.
- Jensen J, Jeppesen E, Olrik K, Kristensen P. 1994. Impact of nutrients and physical factors on the shift from cyanobacterial to chlorophyte dominance in shallow Danish lakes. Can J Fish Aquat Sci. 51:1692–1699.
- Klausmeier CA, Litchman E, Daufresne T, Levin SA. 2004. Optimal nitrogen-to-phosphorus stoichiometry of phytoplankton. Nature. 429:171–174.
- Lehman PW, Kendall C, Guerin MA, Young MB, Silva SR, Boyer GL, Teh SJ. 2015. Characterization of the Microcystis bloom and its nitrogen supply in San Francisco estuary using stable isotopes. Estuaries Coasts. 38:165–178.
- Leon Lopez N, Rivera Rondon CA, Zapata A, Jimenez J, Villamil W, Arenas G, Rincon C, Sanchez T. 2012. Factors controlling phytoplankton in tropical high-mountain drinking-water reservoirs. Limnetica. 31:305–321.
- Lepš J, Šmilauer P. 2003. Multivariate analysis of ecological data using CANOCO. Cambridge: Cambridge University Press.
- Lin Y, He Z, Yang Y, Stoffella PJ, Phlips EJ, Powell CA. 2008. Nitrogen versus phosphorus limitation of phytoplankton growth in Ten Mile Creek, Florida, USA. Hydrobiologia. 605:247–258.
- Liu X, Lu X, Chen Y. 2011. The effects of temperature and nutrient ratios on Microcystis blooms in Lake Taihu, China: an 11-year investigation. Harmful Algae. 10:337–343.
- Lv J, Wu H, Chen M. 2011. Effects of nitrogen and phosphorus on phytoplankton composition and biomass in 15 subtropical, urban shallow lakes in Wuhan, China. Limnologica. 41:48–56.
- Marcarelli AM, Wurtsbaugh WA. 2009. Nitrogen fixation varies spatially and seasonally in linked stream-lake ecosystems. Biogeochemistry. 94:95–110.
- Markou G, Vandamme D, Muylaert K. 2014. Microalgal and cyanobacterial cultivation: the supply of nutrients. Water Res. 65:186–202.
- Moisander PH, Ochiai M, Lincoff A. 2009. Nutrient limitation of Microcystis aeruginosa in northern California Klamath River reservoirs. Harmful Algae. 8:889–897.
- Mugidde R, Hecky RE, Hendzel LL, Taylor WD. 2003. Pelagic nitrogen fixation in Lake Victoria (East Africa). J Great Lakes Res. 29:76–88.
- Nõges P, Nõges T, Ghiani M, Sena F, Fresner R, Friedl M, Mildner J. 2011. Increased nutrient loading and rapid changes in phytoplankton expected with climate change in stratified South European lakes: sensitivity of lakes with different trophic state and catchment properties. Hydrobiologia. 667:255–270.
- Padisák J, Crossetti LO, Naselli-Flores L. 2009. Use and misuse in the application of the phytoplankton functional classification: a critical review with updates. Hydrobiologia. 621:1–19.
- Paerl HW, Huisman J. 2008. Blooms like it hot. Science. 320:57.
- Paerl HW, Xu H, Hall NS, Zhu G, Qin B, Wu Y, Rossignol KL, Dong L, McCarthy MJ, Joyner AR. 2014. Controlling cyanobacterial blooms in Hypertrophic Lake Taihu, China: will nitrogen reductions cause replacement of non-N-2 fixing by N-2 fixing Taxa? PLoS One. 9:0113123.
- Paidere J, Gruberts D, Skute A, Druvietis I. 2007. Impact of two different flood pulses on planktonic communities of the largest floodplain lakes of the Daugava River (Latvia). Hydrobiologia. 592:303–314.
- Palsson C, Graneli W. 2004. Nutrient limitation of autotrophic and mixotrophic phytoplankton in a temperate and tropical Humic lake gradient. J Plankton Res. 26:1005–1014.
- Paterson M, Schindler D, Hecky R, Findlay D, Rondeau K. 2011. Comment: Lake 227 shows clearly that controlling inputs of nitrogen will not reduce or prevent eutrophication of lakes. Limnol Oceanogr. 56:1545–1547.
- Piehler MF, Dyble J, Moisander PH, Chapman AD, Hendrickson J, Paerl HW. 2009. Interactions between nitrogen dynamics and the phytoplankton community in Lake George, Florida, USA. Lake Reservoir Manage. 25:1–14.
- Rabalais NN. 2002. Nitrogen in aquatic ecosystems. AMBIO: a J Hum Environ. 31:102–112.
- Reddy KR, Fisher MM, Ivanoff D. 1996. Resuspension and diffusive flux of nitrogen and phosphorus in a hypereutrophic lake. J Environ Qual. 25:363–371.
- Redfield AC. 1958. The biological control of chemical factors in the environment. Sci Prog.11:150–157.
- Reynolds CS. 2006. The ecology of phytoplankton. Cambridge: Cambridge University Press.
- Reynolds CS, Huszar V, Kruk C, Naselli-Flores L, Melo S. 2002. Towards a functional classification of the freshwater phytoplankton. J Plankton Res. 24:417–428.
- Schindler DW, Hecky R, Findlay D, Stainton M, Parker B, Paterson M, Beaty K, Lyng M, Kasian S. 2008. Eutrophication of lakes cannot be controlled by reducing nitrogen input: results of a 37-year whole-ecosystem experiment. Proc Nat Acad Sci. 105:11254–11258.
- Scott JT, McCarthy MJ. 2010. Nitrogen fixation may not balance the nitrogen pool in lakes over timescales relevant to eutrophication management. Limnol Oceanogr. 55:1265–1270.
- Sommer U, Gliwicz ZM, Lampert W, Duncan A. 1986. The PEG-model of seasonal succession of planktonic events in fresh waters. Arch Hydrobiol. 106:433–471.
- Sterner RW, Andersen T, Elser JJ, Hessen DO, Hood JM, McCauley E, Urabe J. 2008. Scale-dependent carbon:nitrogen:phosphorus seston stoichiometry in marine and freshwaters. Limnol Oceanogr. 53:1169–1180.
- Trolle D, Hamilton DP, Pilditch CA, Duggan IC, Jeppesen E. 2011. Predicting the effects of climate change on trophic status of three morphologically varying lakes: implications for lake restoration and management. Environ Mod Softw. 26:354–370.
- Vadeboncoeur Y, Lodge DM, Carpenter SR. 2001. Whole-lake fertilization effects on distribution of primary production between benthic and pelagic habitats. Ecology. 82:1065–1077.
- Vahtera E, Autio R, Kaartokallio H, Laamanen M. 2010. Phosphate addition to phosphorus-deficient Baltic Sea plankton communities benefits nitrogen-fixing Cyanobacteria. Aquat Microb Ecol. 60:43–57.
- Vrede T, Ballantyne A, Mille-lindblom C, Algesten G, Gudasz C, Lindahl S., Brunberg AK. 2009. Effects of N:P loading ratios on phytoplankton community composition, primary production and N fixation in a eutrophic lake. Freshwater Biol. 54(2):331–344.
- Vonlanthen P, Bittner D, Hudson A, Young K, Müller R, Lundsgaard-Hansen B, Roy D, Di Piazza S, Largiader C, Seehausen O. 2012. Eutrophication causes speciation reversal in whitefish adaptive radiations. 482:357–362.
- Wever AD, Muylaert K, Langlet D, Alleman L, Descy JP, Andre L, Cocquyt C, Vyverman W. 2008. Differential response of phytoplankton to additions of nitrogen, phosphorus and iron in Lake Tanganyika. Freshwater Biol. 53:264–277.
- Winder M, Schindler DE. 2004. Climate change uncouples trophic interactions in an aquatic ecosystem. Ecology. 85:2100–2106.
- Winter JG, DeSellas AM, Fletcher R, Heintsch L, Morley A, Nakamoto L, Utsumi K. 2011. Algal blooms in Ontario, Canada: increases in reports since 1994. Lake Reservoir Manage. 27:107–114.
- Xiao L-J, Wang T, Hu R, Han B-P, Wang S, Qian X, Padisak J. 2011. Succession of phytoplankton functional groups regulated by monsoonal hydrology in a large canyon-shaped reservoir. Water Res. 45:5099–5109.
- Xu S, Huang B, Wei Z-B, Luo J, Miao A-J, Yang L-Y. 2013. Seasonal variation of phytoplankton nutrient limitation in Lake Taihu, China: a monthly study from year 2011 to 2012. Ecotoxicol Environ Saf. 94:190–196.
- Xu H, Paerl HW, Qin B, Zhu G, Hall NS, Wu Y. 2014. Determining critical nutrient thresholds needed to control harmful cyanobacterial blooms in Eutrophic Lake Taihu, China. Environ Sci Technol. 49:1051–1059.
- Zhang X, Mei X, Gulati RD, Liu Z. 2014. Effects of N and P enrichment on competition between phytoplankton and benthic algae in shallow lakes: a mesocosm study. Environ Sci Pollution Res. 22:1–7.
- Zhang Y, Prepas E. 1996. Regulation of the dominance of planktonic diatoms and cyanobacteria in four eutrophic hardwater lakes by nutrients, water column stability, and temperature. Can J Fish Aquat Sci. 53:621–633.
- Zhao Y, Quigg A. 2014. Nutrient limitation in Northern Gulf of Mexico (NGOM): phytoplankton communities and photosynthesis respond to nutrient pulse. PLoS One. 9:0088732.