
ABSTRACT
Among freshwater systems, coldwater habitats are among the most threatened by climate change. Examining the impacts of increasing water temperature requires the use of both traditional biomonitoring efforts and measures of ecosystem function and structure. We examined fish and macroinvertebrate communities, leaf decomposition rates, periphyton production, and ecosystem metabolism to compare two branches of a trout stream in Minnesota with differing thermal regimes. The cooler South Branch had more coldwater fish, a higher index of biological integrity for fish but a lower index for macroinvertebrates. There were no differences in leaf decomposition rates between branches, although non-native buckthorn leaves decomposed faster than native black cherry leaves. Periphyton production was higher in the North Branch than the South Branch. Both branches had high nitrogen but low phosphorus levels. Nutrient enrichment with phosphorus enhanced periphyton production in both branches. Measures of stream metabolism, based on diurnal variation in oxygen levels, showed that both branches were heterotrophic. Despite higher periphyton production in the North Branch, gross primary production was higher in the South Branch. The bioassessment measures used in our study yielded inconsistent results, pointing to the need for multiple methods to examine and better describe potential responses to warming from climate change.
Introduction
Climate change has and will continue to have significant impacts on aquatic systems (Schindler Citation1997; Oki & Kanae Citation2006; Whitehead et al. Citation2009; Moss Citation2012). Caissie (Citation2006) and Hester and Doyle (Citation2011) among others indicated that stream temperatures are increasing globally and models by van Vliet et al. (Citation2013) predict future increases in global river temperatures. North American coldwater streams are particularly sensitive to the effects of climate change and land use change, including increased nutrient inputs from agriculture. These coldwater streams typically have maximum daily mean temperatures <22 ˚C and hold fish assemblages distinct from those of warmwater streams (maximum daily mean temperatures >22 ˚C; Lyons et al. Citation1996). High-quality coldwater streams are dominated by salmonids and cottids and are characterized by low fish species richness. Increases in species richness occur as a result of environmental degradation, when a number of more tolerant eurythermal species replace the typical few coldwater species (Lyons et al. Citation1996). Fish communities varied among habitats upstream (coldwater) and downstream (warmer water) of dams in 10 Michigan streams with a loss of coldwater fish species below the dam but an increase in overall fish species richness in warmer waters (Lessard & Hayes Citation2003). Eaton and Scheller (Citation1996) estimated that warming associated with increased carbon dioxide levels would lead to a 50% reduction in habitat for cold and cool water fish. Macroinvertebrate communities also shift as a result of increased temperature; EPT (Ephemeroptera, Plecoptera, and Trichoptera) taxa richness was significantly lower in warmer habitats (Lessard & Hayes Citation2003). Previous studies have shown that macroinvertebrate family richness also increases with temperature in rivers (Jacobsen et al. Citation1997). Dallas and Ross-Gillespie (Citation2015), in reviewing the effects of sublethal temperatures on aquatic organisms, indicate that cool headwaters represent ancestral habitat of many aquatic insects and represent thermal refugia for cold adapted stenotherms. Therefore, monitoring changes in fish and macroinvertebrate communities is especially useful in assessing environmental change in coldwater stream ecosystems.
As climate change alters freshwater systems, improved assessment techniques are needed to better understand and manage these resources (Wilby et al. Citation2010; Friberg et al. Citation2011; Williams et al. Citation2015). Studies of biotic and abiotic structural components of streams are frequently used as measures to assess ecological condition and water quality in streams. In particular, surveys of density, diversity, richness, and indices of biological integrity (IBI) in fish and macroinvertebrate communities are common methods used in stream characterization. Macroinvertebrate communities are good indicators of ecological stress due to the large variety of species and life histories present, which play critical roles in stream function and are sensitive to degradation (Wang & Lyons Citation2003). These communities respond predictably to changes in stream hydrology, water quality, and channel morphology (Wright et al. Citation1984), thereby providing an accurate indication of stream quality (Karr & Chu Citation1999). For example, Herringshaw et al. (Citation2011), investigating land use change effects on benthic macroinvertebrate communities in a highly impacted Iowa watershed, found that urban land use had greater negative effects on invertebrate density and richness (and therefore stream condition) than agricultural land use. An assessment of ecological conditions of Great Lakes tributaries using a compilation of fish and benthic macroinvertebrate community datasets found that metrics of macroinvertebrate assemblages were more sensitive to agricultural land use changes than those of fish communities. Invertebrates may be more sensitive to these changes due to their lack of mobility, causing them to experience greater environmental stress over time. In contrast to differential response to agricultural land use, another study found that both macroinvertebrate and fish metrics were similarly sensitive to the effects of urbanization (Riseng et al. Citation2010).
Measures of ecosystem function and structure are complementary to measures of water quality in streams and rivers (Hopkins et al. Citation2011) and may be useful in developing multimetric measures of habitat quality that deal with some of the conflicting results from biotic structural measures alone. Components used to examine stream quality include ecosystem metabolism (Fellows et al. Citation2006), periphyton production (Udy et al. Citation2006), and leaf decomposition rates (Gessner & Chauvet Citation2002). Stream metabolism is a functional indicator of overall ecosystem health (Young et al. Citation2008). Basic ecosystem properties like nutrient uptake rate, carbon flux into the food web, and trophic status are heavily influenced by stream metabolism (Riley & Dodds Citation2013). Each of these properties impact water quality as well as stream metabolism. Similarly, periphyton is sensitive to many environmental conditions of streams and has long been studied as an indicator of water quality, stream health, and trophic status. Omar (Citation2010) provides a synthesizing review of many studies that have used algal communities to assess water quality. Finally, leaf decomposition studies are also useful indicators of ecosystem health. They are advantageous due to their ease of implementation and relatively low cost. Leaf decomposition rates are highly sensitive to anthropogenic factors, such as insecticide application, especially when the litter enters the system from allochthonous sources (Gessner & Chauvet Citation2002). A disadvantage of these studies is their susceptibility to a range of biotic and abiotic environmental factors (Abelho Citation2001; Young et al. Citation2008). In spite of this, leaf decomposition measurements combined with other functional (e.g. ecosystem metabolism) and structural indicators are useful in ecosystem monitoring (Young et al. Citation2008; Feio et al. Citation2010).
While both structural and functional approaches are used in biomonitoring, Marchant et al. (Citation2006) indicate that improvement in approaches is fundamental to sustainable management of the world's freshwater resources. Sandin and Solimini (Citation2009) provide a comparison of structural and functional approaches and conclude that studies to date do not answer the question of whether structural or functional measures are ‘better’ in assessing stream health, but instead demonstrate that structural measures alone did not detect all types of impairment. They suggest using a combination of structural and functional assessments of streams.
Because climate change is likely to significantly impact coldwater stream ecosystems, and since differing approaches to bioassessment have differing strengths and weaknesses, we examined how ecosystem function (stream metabolism, periphyton production, and leaf decomposition) and structure (benthic macroinvertebrate and fish IBI) differed among two branches of an eastern Minnesota trout stream. These branches are slightly different in temperature regime and might provide a model of shifts that will result from warming temperatures.
Methods
Study area
Valley Creek is a second order stream that flows into the St. Croix River, a tributary of the Mississippi River (). There are two major branches to the stream, the North and South Branches, which are located in Washington County, MN, USA. Using information from the 2011 National Land Cover Database (NLCD; Jin et al. Citation2013), and the Digital Elevation Model (http://nationalmap.gov/3DEP/), we divided the Valley Creek watershed into two parts associated with the two branches. The North Branch drains approximately 14.2 km2, while the South Branch drains approximately 21.9 km2. The surficial geology of the Valley Creek watershed is comprised primarily of Quaternary sandplain, which overlies Ordovician dolostone and Cambrian sandstone; all of which is highly permeable. A portion of the southern basin was not covered during the last glacial episode (Almendinger Citation2003).
Figure 1. Map of Valley Creek, MN, USA showing study locations. This map was created using ArcGIS software by Esri. ArcGIS and ArcMap™ are the intellectual property of Esri and are used herein under license. Copyright © Esri. All rights reserved. For more information about Esri software, please visit www.esri.com.
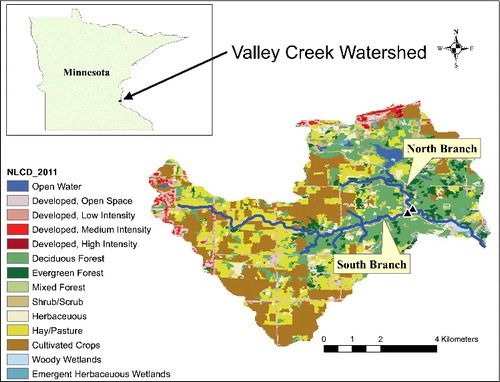
There are differences in land cover between the two subwatersheds with the South Branch being covered by cultivated crops (33%), hay/pasture (25%), and forest (24%), while the North Branch is covered primarily by forest (42%), followed by cultivated crops (17%), and hay/pasture (14%). Additionally, the North Branch contains more open water and wetlands (2.9% and 1.8%, respectively), while the South Branch has little open water or wetlands (0.1% and 0.9%, respectively). Some bank stabilization structures were implemented in the South Branch between 1960 and 1980 after a period of flooding (Stewart Citation2007). The watershed includes one of the best trout streams in the Minneapolis–St. Paul metropolitan area (Zapp & Almendinger Citation2001).
Groundwater inputs account for a significant portion of the discharge in both branches of Valley Creek (Almendinger Citation2003). In the South Branch, groundwater arises from bedrock aquifers that discharge directly into the stream, especially near its headwaters. It is a modestly gaining stream at a number of locations in the lower reaches (Almendinger Citation2003). In contrast, the groundwater source for the North Branch appears to discharge mainly in to Lake Edith, and this branch is a losing stream throughout much of its length below the lake (Almendinger Citation2003). By having its groundwater discharged into the lake, stream temperatures are warmer than the South Branch. However, near the junction of the North and South Branches is some local groundwater input into the North Branch (Almendinger Citation2003).
Physical and chemical analyses
We used standard methods to measure physical and chemical attributes of our study sites. Washington County and the St. Croix Watershed Research Station provided analyses of dissolved nitrogen and phosphorus and mean daily discharge (Washington Conservation District Oakdale, MN, USA and St. Croix Watershed Research Station of the Science Museum of Minnesota, Marine on St. Croix, MN, USA). Chemical analyses were conducted on grab samples taken on a number of dates from 1997 to 2013. Washington County provided hourly discharge data for the two branches from 1998 to 19 November 2015. We used these data to calculate mean daily discharge. These South Branch water samples and discharge data were taken at our sampling site, while these North Branch samples and discharge measurements were taken approximately 300 m upstream of our sampling site.
We measured additional physical and chemical attributes of the two branches at our sampling locations. In both branches we installed mini-piezometers (inside diameter = 0.7 cm diameter, screen length = 4.3 cm) to a depth of 1.1 m below the sediment water interface. We measured stream depth and water depth in the piezometer to calculate the vertical hydraulic gradient, an indication of the amount of groundwater entering or leaving a stream (Baxter et al. Citation2003). In ground and surface water, we measured dissolved phosphorus and nitrate using a UV/Vis spectrophotometer (DR 890, Hach Corp., http://www.hach.com), and dissolved oxygen, pH and conductivity with a sonde (model 6600 sonde, YSI, Inc., http://www.ysi.com). Data loggers (HOBO® model U26, Onset Computer Corp., http://www.onsetcomp.com) were used to record water temperature every 15 min at both sites. We also installed data loggers (HOBO® model U20L-04, Onset Computer Corp., http://www.onsetcomp.com) to record water depth. We collected surficial sediment samples with a 5 cm diameter corer, dried them, sorted samples with a standard series of sieves (0.063, 0.125, 0.25, 0.5, 1, 2, 4, 8, 16, and 31.5 mm), and weighed the resulting fractions, which were analyzed using Gradistat (Blott & Pye Citation2001) to determine mean sediment size and sorting coefficient. Critical shear stress, the force required to initiate particle motion, was calculated at each of the four Surber sample collection locations for both stream branches. FST (Fliesswasserstammtisch) hemisphere measurements were used to determine the largest particle entrained at the streambed (Statzner & Müller Citation1989). To calculate critical shear stress we used the following equation:(1) where τcr is critical shear stress, τci is dimensionless critical shear stress, g is acceleration due to gravity, ρs is the density of sediment (FST hemisphere), ρw is the density of water, and d is the size of the particle of interest (Fischenich Citation2001). Values for dimensionless critical shear stress were taken from Julien (Citation1995), and were based on our measurements of sediment size classes. We conducted a t-test to compare critical shear stress values between North and South Branches.
Macroinvertebrates
We sampled macroinvertebrates at both study sites, taking four Surber samples (0.09 m2 plots) at each site on 22 October 2015. Specimens were preserved in 95% ethanol, identified to family using Bouchard (Citation2004), and enumerated. These data were used to calculate macroinvertebrate density, family richness, family diversity (Shannon–Weiner index), and a modified Family Biotic Index (FBI – Bouchard Citation2004). We then conducted linear regressions of macroinvertebrate density and richness with critical shear stress (Dittrich & Schmedtje Citation1995). Finally, we divided macroinvertebrates into feeding guilds (Bouchard Citation2004) and used a chi-square test to compare feeding preferences between North and South Branches.
Fish sampling
We collected fishes using three sampling techniques and calculated species richness, diversity, and an IBI for coldwater streams. On both 24 September and 1 October 2015 we sampled all available habitats at both sample sites using kick and dip nets along a 60 m reach as well as a line of people kicking through the substrate to flush fishes into a 10 × 2 m block seine. On 29 October 2015 we collected fishes using a backpack electrofisher from the same 60 m reaches, plus an additional 50 m upstream. We measured each fish, recorded the species and number collected, and returned fishes to the stream after sampling was completed. From the combined catch we calculated the number of fish collected from each branch, species richness, and Shannon–Weiner diversity index. We standardized our catch to a 150 m reach, and calculated an IBI for upper Midwest coldwater streams (Mundahl & Simon Citation1998).
Leaf decomposition
We examined leaf decomposition in the two branches of Valley Creek with methods adapted from Alonso et al. (Citation2010). We collected and air dried leaves of common buckthorn (Rhamnus cathartica) and black cherry (Prunus serotina). We filled mesh leaf bags (20 × 20 cm; one side 6.4 mm openings, the other 1.6 mm openings) with 6 g of leaves: (Equation1(1) ) black cherry (native – N), (Equation2
(2) ) buckthorn (introduced – I), or (Equation3
(3) ) 1:1 mix (3 g N:3 g I). We weighed five replicates of each treatment and pinned them to the streambed of our study sites. We also had three replicates serve as controls, which we carried into the field and returned to the laboratory to account for leaf loss due to traveling. After either two or four weeks between 10 September 2015 and 8 October 2015 we collected treatment bags. We gently rinsed the bags in the stream, stored them in plastic bags, and refrigerated them for ≤6 hours before processing. Processing included rinsing the leaves to remove sediment, drying them at 65 °C for 24–48 hours, and weighing to ascertain dry weight. We then burned the leaves at 500 °C for 2 hours, and weighed them again to determine ash-free dry mass (inorganic weight). We conducted three-way analyses of variance (ANOVAs) with decomposition rates as the dependent variable, and location (North vs. South Branch), collection period, treatment (N, I, or N/I), and their interaction as independent variables.
Periphyton growth
We measured periphyton growth and the potential for nutrient limitation influencing production following the methods in Pringle and Triska (Citation2006) and Vaughn et al. (Citation2007). We used 20 mL scintillation vials filled with agar enriched with 0.5 M NaNO3 in 2% agar (N), 0.5 M KH2PO4 in 2% agar (P), or 0.5 M NaNO3 and 0.5 M KH2PO4 in 4% agar (N + P), or a non-enriched control (C). We covered each vial with a porous silica disc, affixed them with silicone, and placed them in holders with only the silica disc exposed. We placed six replicates of each treatment in the streambed at both study sites and collected three replicates after either 14 or 28 d between 10 September and 8 October 2015. We used chlorophyll a as an index of periphyton density. We extracted chlorophyll in 90% acetone and measured its concentration in with a fluorometer (Aquafluor® Model 8000) using EPA Method 445.0 (Arar & Collins Citation1997). We calculated periphyton production rates by dividing the final periphyton biomass (at 14 and 28 d) by the time deployed, and then compared them with a three-way ANOVA with periphyton production as the dependent variable and location (North and South Branches), treatment (C, N, P, P + N), collection period (14 or 28 d), and their interactions as the independent variables.
We measured light intensity at the locations where we deployed the nutrient diffusing substrates with light data loggers (HOBO® UA-002, Onset Computer Corp.). While the response of these loggers was greater than photosynthetically active radiation (PAR), i.e. that which is important to plants, they recorded the daily variation in light that was reaching algae in the stream (Long et al. Citation2012).
Stream metabolism
We used the single station method of Odum (Citation1956) to assess stream metabolism based on daily variation in oxygen concentration in a stream. We deployed dissolved oxygen data loggers (HOBO® model U26, Onset Computer Corp.) in each branch to record O2 levels every 15 min. Almeida et al. (Citation2014) demonstrated that these kinds of optical sensors were the most accurate for measuring stream metabolism. Barometric pressure, needed to determine corrected O2 levels, was measured near the streams (HOBO® microstation model H21, Onset Computer Corp.). From these data we calculated gross primary production (GPP), ecosystem respiration (ER), and net ecosystem production (NEP). EquationEquations (2(2) ) and (Equation3
(3) ) describe these relationships:
(2)
(3) where C = concentration of oxygen, Cs = concentration of oxygen at saturation, k = reaeration coefficient, and GWA = oxygen accrual from groundwater (Odum Citation1956). ER was assessed as the difference in actual oxygen concentration (C) and the potential oxygen saturation (Cs) during the dark periods of the day and was assumed to be constant throughout the day. Groundwater accrual was usually assumed to be zero (Odum Citation1956). Hall and Tank (Citation2005) suggested that even a small amount of groundwater input can substantially impact metabolism calculations. Inputs of low O2 groundwater, if not corrected for, result in estimates of GPP that are lower and ER that are higher. One of the most difficult aspects of determining stream metabolism is estimating the reaeration coefficient since it depends on a variety of factors including the water velocity, depth, and turbulence. A number of studies have evaluated methods for estimating k (Aristegi et al. Citation2009; Riley & Dodds Citation2013). Grace et al. (Citation2015) have described a modeling approach for estimating k and stream metabolism, especially for long-term data sets, and we used their BAyesian Single-station Estimation model to calculate GPP, ER, and NEP. We used their three-parameter model and increased the number of iterations beyond the standard 2000 for dates on which the model did not converge. We converted volumetric measures (per m3) provided by the model to areal measures (per m2) by using the depth data we collected at each site. In addition to the usual measures of dissolved oxygen, temperature, and barometric pressure needed to assess daily changes in production, PAR was also needed for the model. We installed a PAR monitor near the Valley Creek sites, but it malfunctioned during our project. Fortunately, we had data from this sensor for all of 2014 and a PAR sensor (Li-Corr® LI-190R sensor) at another site 21.8 km away that was functioning during the course of this study. From the data collected in 2014, we developed a relationship between PAR sampled at these two locations (Valley Creek PAR = −12 + 1.01 * PAR at the distant site, r2 = 0.84, n = 13,102). Thus we used measures of PAR at the more distant site to estimate PAR at the Valley Creek sites for this study. JMP® v12.1 (SAS Institute, http://www.jmp.com) was used for all statistical analyses.
Results
Physical and chemical analyses
Some physical parameters differed between the two branches. Discharge was significantly higher in the South Branch than in the North Branch (; paired t-test, t6446 = 82.0, p < 0.0001). Even though discharge was greater in the South Branch, water depth was greater in the North Branch (; paired t-test, t24 = 19.4, p < 0.0001). Critical shear stress was significantly higher in the North Branch compared to the South Branch (; t4 = 3.9, p = 0.02). An analysis of covariance showed that location as the independent variable, time as a covariable, and their interaction significantly influenced water temperature (location: F1,6599 = 6906.1, p < 0.0001; time: F1,6599 = 3538, p < 0.0001; location*time: F1,6599 = 713.8, p < 0.0001). Water temperature was always greater in the North Branch () but the difference in temperatures decreased from September through October. While the sediment was coarser in the South Branch than the North Branch (), the difference was not statistically significant.
Table 1. Physical and chemical characteristics of the two branches of Valley Creek, Minnesota. Values in parentheses are standard deviations.
Analyses of chemical data provided from Washington County and the St. Croix River Watershed Research Station showed that there was no significant difference in dissolved phosphorus between the two branches of Valley Creek (; paired t-test, t48 = 0.3, p = 0.8) but there was significantly more dissolved nitrogen in the South Branch (; paired t-test, t44 = 37.4, p < 0.0001). During the course of this study, nitrogen and phosphorus levels followed the same trends as found in the longer data sets (). In addition, we found lower oxygen levels in the groundwater compared to the surface water, based on measurements taken on 15 October 2015 (). Groundwater pH and conductivity were similar to surface water measures (). Based on water levels from piezometers installed in the streams and measured on three dates during this study, the vertical hydraulic gradient was greater in the North Branch than the South Branch (; paired t-test, t2 = 6.8, p = 0.02) indicating local groundwater inputs were greater in the North Branch than the South Branch. Despite the local groundwater input at the sampling site in the North Branch, the water temperature was lower in the South Branch (). The North Branch, just upstream of the sampling site, is a losing stream (Hornbach et al. Citation2016) and thus the warmer water coming from Lake Edith into this branch was not cooled by groundwater before it reached our sampling site.
Macroinvertebrates
The macroinvertebrate community was more diverse in the North Branch and more abundant in the South Branch. Ten taxa (eight identified to family level, two to class level) were found in the North Branch and six families in the South Branch, with the branches sharing only two taxa (). Macroinvertebrate density (log10 transformed) was significantly higher in the South Branch than the North Branch (t5 = 4.7, p = 0.002), and macroinvertebrate richness and Shannon diversity were both higher in the North Branch, although not statistically higher (log10 (richness): t5 = 0.1, p = 0.9; diversity: t1 = 7.8, p = 0.1; ). The FBI score for the North Branch was 5.57, placing it in the ‘Fair’ biotic integrity category, and the FBI score for the South Branch was 5.93, placing it in the ‘Fairly Poor’ biotic integrity category (). Macroinvertebrate feeding preferences differed significantly between branches ( = 137.9, p < 0.0001). An inspection of cell
values showed that the main difference between branches was the large proportion of collector/gatherers in the South Branch (gammarids) compared to the North Branch. There were greater percentages of collector/filterers, collector/gatherers, and predators in the North Branch compared to the South Branch. There were similar percentages of shredders in both branches. However, the number of macroinvertebrates in the North Branch was low, and with a small sample size these results must be viewed with caution. There was a significant negative correlation between shear stress and macroinvertebrate density (F1,7 = 9.3, p = 0.02, r2 = 0.61) but no correlation with richness.
Table 2. Macroinvertebrate density and feeding habits. Values in parentheses are standard deviations.
Fishes
The fish community in the South Branch was more representative of a coldwater stream while the North Branch included some warmer water species (). We observed eight fish species, six in the North Branch, and four in the South Branch (). Fish richness and Shannon diversity were both higher in the North Branch, although there was no significant difference in the diversity indices (t1 = 3.31, p = 0.19; ). The coldwater stream IBI score for the North Branch was 55 (‘Fair’ biotic integrity), and the IBI score for the South Branch was 105 (‘Excellent’ biotic integrity; ). In the North Branch there were 0.14 fishes/meter, and in the South Branch there were 0.93 fishes/meter.
Table 3. Fishes collected from Valley Creek with dip netting and electroshocking.
Table 4. Biological characteristics of two branches of Valley Creek, Minnesota.
Leaf decomposition
Leaf decomposition varied between treatments. A three-way ANOVA examining branch (North vs. South Branch), treatment (N, N/I, I), and collection period (10 September–24 September, 10 September–8 October) as factors of leaf decomposition rate (total dry weight) showed significant differences between treatments (F2,59 = 9.9, p = 0.0003) and collection period (F1,59 = 75.3, p < 0.0001), but no significance in location. There was no significance in interactions among factors. A similar pattern was found when an analysis was conducted based on the weight of organic matter in the leaves. Rates of decomposition were greatest for buckthorn (I) and lowest for black cherry (N) with the mixed treatment showing an intermediate response (). A paired t-test showed that the mixed treatment (N/I) had decomposition rates that were not significantly different than that expected assuming independent rates of decomposition for the two species that composed the mix (t19 = 1.2, p = 0.25). Rates of decomposition were higher when measured over the first 14-d period when compared to rates determined over the entire 28-d period.
Figure 2. Mean leaf decomposition rates as loss of dry weight for two species of leaves (black cherry and common buckthorn) from two locations in Valley Creek, MN over two time periods. Vertical lines show one standard deviation from the mean.
Periphyton
To examine periphyton production, we conducted a three-way ANOVA with periphyton production as the dependent variable and treatment (C, N, P, N + P), location (North vs. South Branch), and collection period (10 September–24 September, 10 September–8 October) and their interactions as independent variables. This analysis showed significant differences between locations (North Branch > South Branch; F1,47 = 76.3, p < 0.0001), treatments (P ≥ N + P ≥ N ≥ C; F3,47 = 5.0, p = 0.0006), and collection period (10–24 September period > 10 September–8 October period; F1,47 = 14.9, p = 0.0005; ). There was also a significant interaction effect between location and collection period (F1,47 = 31.8, p < 0.0001) with the rates of periphyton production in the North Branch being higher when measured for the first 14 d compared to the entire 28-d period while in the South Branch, the rates of production were not statistically significantly different between the 14- or 28-d period. There were no significant interactions among other factors.
Figure 3. Mean periphyton production rate, measured as chlorophyll a changes, from two locations in Valley Creek, MN over two time periods. The potential for nutrient limitation influencing production was examined by comparing a control (C) with treatments of enrichment with nitrogen (N), phosphorus (P), or both (N + P). Vertical lines show one standard deviation from the mean.
Light meters deployed with the periphyton samplers showed higher rates of incident light in the North Branch (mean = 280.3 μmole/m2/s) compared to the South Branch (mean = 55.1 μmole/m2/s). A paired t-test indicated that these differences were significant (t280 = 18.4, p < 0.0001).
Stream metabolism
Although both branches of Valley Creek were heterotrophic throughout the study period, there were some differences between the streams. Stream oxygen levels were quite high throughout the study period in both branches, with the South Branch having higher levels of saturation than the North Branch (). Of the 34 d for which we were able to calculate metabolism parameters, we excluded one date from the South Branch and nine from the North Branch due to poor model fits (r2 < 0.4). An analysis of covariance with location as the independent variable and date as the covariable with GPP, ER), and NEP as the dependent variables showed that location significantly influenced all three measures of metabolism (GPP: F1,57 = 78.8, p < 0.001; ER: F1,25 = 25.2; NEP: F1,25 = 24.8, p < 0.0001) but the interaction of date and location only significantly influenced GPP (date*location: F1,57 = 20.8, p < 0.0001). GPP and ER were greater in the South Branch than in the North Branch but the higher GPP did not compensate for the ER, thus giving the South Branch a more negative NEP (). The negative NEP for both branches indicates that both are heterotrophic.
Figure 4. Per cent oxygen saturation (taken at 15-min intervals) for two locations in Valley Creek, MN. Upper panel represents the North Branch; lower panel represents the South Branch. Gaps in the graphs are due to instrument malfunctions.
Figure 5. Temporal changes in daily measures of stream metabolism (measured as mg O2 m−2 d−1) at two locations in Valley Creek, MN. Top panel represents gross primary production (GPP), middle panel represents ecosystem respiration (ER), and the bottom panel represents net ecosystem production (NEP). Gaps in the graphs are due to instrument malfunctions.
We found that water temperature influenced some aspects of stream metabolism. An analysis of covariance with GPP and ER as dependent variables, location as the independent variable, and temperature and PAR as covariables showed that location and the interaction between water temperature and location had significant effects on GPP (location: F1,57 = 21.4, p < 0.0001; location*water temperature; F1,57 = 10.9, p = 0.002). GPP increased with water temperature in the North Branch, but not in the South Branch. Only location significantly influenced ER (F1,57 = 5.8, p = 0.02). This relationship did not hold true in the South Branch.
Discussion
We found that the two branches of Valley Creek had significant differences in a number of structural and functional attributes (). The South Branch was shallower, wider, and cooler, and had greater discharge and dissolved nitrogen than the North Branch. The North Branch had higher shear stress and finer sediments than the South Branch. Phosphorus was similar in both streams. It is well known that differences in the hydrological and chemical makeup of streams significantly impact the biota and ecosystem processes (Woodcock & Huryn Citation2007; Beugly & Pyron Citation2010; Cuffney et al. Citation2010).
Table 5. Comparison of abiotic, structural, and functional measures of the two Valley Creek branches.
Valley Creek is thought to be one of the best trout streams in the Twin Cities area of Minnesota (Zapp & Almendinger Citation2001). The North Branch is classified as marginal trout habitat mainly due to its warmer summer water temperatures (Almendinger Citation2003). Our data, and those of Barr Engineering (Citation2015), showed that North Branch water temperatures were warmer in the summer and early fall, and approached the cooler South Branch temperatures in the late fall and winter. The South Branch supported relatively high numbers of coldwater species such as slimy sculpin, brown trout, brook trout, and rainbow trout. All three trout species are coldwater species and top carnivores, and slimy sculpins are benthic, coldwater, intolerant species (Becker Citation1983; Mundahl & Simon Citation1998; Lessard & Hayes Citation2003). Brown trout, the most abundant trout species we observed, require high levels of dissolved oxygen (Raleigh et al. Citation1986) as do sculpin (Brown Citation1989; Yoder Citation2012). While both branches had relatively high oxygen levels, the North Branch had lower absolute oxygen levels. Despite the warmer temperatures and lower oxygen levels, the North Branch, nonetheless, provides suitable trout habitat in cooler months (Stewart Citation2007).
The South Branch had a greater number of coldwater species than the North Branch likely due to the greater groundwater input, leading to a higher fish IBI score. Despite this, the North Branch had higher fish species diversity and richness values. We found a number of warmwater species, including yellow bullhead (Ameiurus natalis), bluegill (Lepomis macrochirus), and black crappies (Pomoxis nigromaculatus), in the North Branch likely due to the moderating influence of Lake Edith on the temperature of this branch. Warmwater streams have fewer intolerant, specialist coldwater species, and more tolerant, generalist eurythermal species resulting in higher species richness (Lyons et al. Citation1996).
Similar to what we observed for fishes, the North Branch had higher macroinvertebrate richness and diversity compared to the South Branch. Macroinvertebrate density was significantly higher in the South Branch, but this was due primarily to the abundance of gammarids, which are often indicators of coldwater input to streams (Holsinger Citation1972). With an FBI score of 5.57, the North Branch has a ‘Fair’ biotic integrity rating, compared to the score of 5.93 and ‘Fairly Poor’ biotic integrity rating in the South Branch. The Metropolitan Council (Citation2014) studied a site just below the confluence of the North and South Branches and found the FBI varied from a low of 5.76 (‘Fair’) in 2003 to a high of 3.41 (‘Excellent’) in 2007. From 2007 to 2011 the FBI declined to the ‘Good’ range (4.92). Hornbach et al. (Citation2016) reported an FBI score of 5.5 in the North Branch in 2014. The lower quality biotic integrity score in the South Branch can be attributed to the large number of gammarids (tolerance value of 6), which outweighed the other families present in the South Branch with lower tolerance values and lower abundance. Previous studies showed that increased water temperatures cause shifts in benthic macroinvertebrates (Jacobsen et al. Citation1997; Lessard & Hayes Citation2003) with macroinvertebrate family richness increasing with temperature in streams (Hieber et al. Citation2005). In addition to temperature differences between the branches, we found a significant difference in shear stress and a significant negative relationship between macroinvertebrate density and critical shear stress. Previous studies suggest that shear stress influences benthic macroinvertebrate density; it is often difficult for macroinvertebrates to live in areas with high shear forces (Fuller et al. Citation2010; Hoover & Ackerman Citation2011).
While there were significant differences in physical and chemical parameters, and fish and macroinvertebrate communities between the North and South Branches, leaf decomposition rates were not significantly different. We expected water temperature to influence decomposition rates more strongly, as observed in other studies (Irons et al. Citation1994; Mora-Gomez et al. Citation2015). For example, Young et al. (Citation2008) proposed that water temperature was the primary factor affecting leaf breakdown where faster decomposition rates were reported in warmer streams or seasons. Similarly, differences in shear stress and discharge, which have been shown to facilitate faster leaf breakdown due to increases in mechanical abrasion (Heard et al. Citation1999), did not explain differences in decomposition rates between branches. The discharge was greater in the South Branch and the shear stress was greater in the North Branch, thus it is possible that these processes cancel each other out.
Although leaf decomposition rates did not differ between branches, there were differences between collection periods and between leaf species. Leaves decomposed at significantly higher rates during the 10 September–24 September collection period versus the 10 September–8 October period. These rates are consistent with models indicating rapid loss of mass initially due to leaching and microbial activity, followed by the subsequent decline in decomposition rate of more resistant compounds (Webster & Benfield Citation1986). Similarly, we found significantly different rates of leaf litter decomposition between native and introduced treatments between the two collection periods. Leaves from introduced species decomposed more quickly than native leaves, which is consistent with other studies (Ehrenfeld Citation2003; Ashton et al. Citation2005) and in particular Freund et al. (Citation2013) found that buckthorn decomposed more quickly than two species of native species in a headwater stream. Our mixed bag leaves decomposed at a rate not significantly different from the expected intermediate rate between native and introduced treatments, which contrasts with findings from Swan et al. (Citation2008), where decomposition rates of native-introduced mixed leaf bags were not intermediate to native or introduced alone. The varying nutrient compositions of leaf mixtures offer detritivores opportunities to maximize feeding, making prediction of decomposition rates challenging due to the complexity of detritivorous interactions with different leaf litter compounds (Gessner et al. Citation2010).
The North Branch had higher rates of periphyton production than the South Branch, especially when comparing control treatments, during the first 14 d of exposure. Optimal water temperature for most species of periphyton is 10—30 °C with lower temperatures causing less than optimal photosynthetic activity and limited nutrient uptake (Larned Citation2010). The North Branch was warmer and local light levels were higher than the South Branch, both of which could have contributed to the higher periphyton production. Warnaars et al. (Citation2007) found that light level was among the most important factors controlling periphyton production. Under conditions of high or variable water velocity and shear stress, periphyton may have a more difficult time attaching to or staying attached to the substrate, which would result in lower chlorophyll a production (Warnaars et al. Citation2007; Larned Citation2010). Luce et al. (Citation2013) demonstrated that sand transport reduced periphyton production yet even with higher levels of shear stress and bed sand transport in the North Branch, production levels were greater in this branch, which could indicate that warmer temperatures and greater light availability outweighed the impact of higher shear stress.
Nitrogen levels in both branches are considered relatively high (>1 mg/L), while phosphorus levels are considered low (<0.1 mg/L) (Behar Citation1996). In our nutrient enrichment treatments, phosphorus additions had the greatest impact, as expected. In general, the effects of nutrient additions appeared to be modest, having some impact on periphyton production only during the early stages of the study. Wold and Hershey (Citation1999) showed that there were seasonal differences in the effect of nutrient additions on periphyton production, with no influence of nutrient addition late in the growing season. In our study it is likely that the higher temperatures and light intensity in the North Branch influenced periphyton growth more than nutrient availability, similar to other studies (Bernhardt & Likens Citation2004).
We found that the components of stream metabolism (GPP, ER, and NEP) differed significantly between the North and South Branches of Valley Creek, with GPP and ER higher in the South Branch, and the North Branch being more heterotrophic (more negative NEP). GPP increased over time in the South Branch but decreased in the North Branch. GPP in the North Branch also declined during the fall of 2014 (data from Hornbach et al. Citation2016). The differences between the two branches could be due to different factors. Over the course of the study temperatures declined faster in the North Branch than the South. The declining temperatures in the North Branch could be responsible for the decrease in GPP, while an increase in light with leaf fall could be responsible for the increase in GPP in the South Branch, although leaf fall also occurred in the North Branch watershed. An ANCOVA showed that water temperature significantly influences GPP in the North Branch, but not the South Branch, supporting the idea that some factor other than temperature was influencing GPP in the South Branch. In other studies, both PAR and temperature have been shown to influence stream metabolism (Roberts & Mulholland Citation2007) and it seems in our case that increasing light may be responsible for increased GPP in the South Branch but that declining water temperatures had a greater role in the North Branch offsetting increases in light.
Groundwater inputs may strongly influence measurements of stream metabolism (Hall & Tank Citation2005; Hornbach et al. Citation2016). While the South Branch received most of its groundwater from springs near the headwaters (Almendinger Citation2003), and thus had sufficient time to come into equilibrium with the atmosphere before it reached our site, the North Branch is a losing stream until it reaches a few hundred meters upstream of our site (Hornbach et al. Citation2016). There local groundwater input, indicated by a higher vertical hydraulic gradient, may reduce oxygen levels. Oxygen saturation reached 100% on most days in the South Branch while values rarely exceeded 97% in the North Branch. Hornbach et al. (Citation2016) estimated the impact of groundwater on the North Branch of Valley Creek and calculated the mean bias of groundwater on ER and GPP (ER uncorrected for groundwater/ER corrected) using methods in Hall and Tank (Citation2005). Using their calculations, we can produce a rough estimation of how groundwater influenced our measurements for autumn 2015. The mean bias for ER was 1.12, indicating that the measure of ER would be greater if we had corrected for groundwater. The mean bias for GPP was 0.57, so our estimation for GPP would be lower if we corrected for groundwater inputs. These corrections for the North Branch do not change the disparity in GPP, ER, or NEP between the branches. Although correcting for groundwater bias is important for producing more accurate measurements of metabolism, our corrected values do not entirely explain metabolic differences between the branches.
The two branches of Valley Creek differ substantially in their surface hydrology, which likely affected stream metabolism measurements. We believe that Lake Edith and wetland areas along the North Branch may have influenced differences in metabolism between the branches. The single station sampling method that we employed integrates metabolism over a stream reach approximately equal to 3v/k (v is water velocity (m/min), and k is the reaeration coefficient (min−1); Chapra & Di Toro Citation1991). Our sampling integrated metabolism over 6 km in the South Branch and 8.5 km in the North Branch. These estimates fall within a reasonable range for 3v/k (Reichert et al. Citation2009). Since our sampling included such a long reach on the North Branch, it is possible that metabolic activity from Lake Edith and the surrounding wetlands were included in our measurements. Many studies have demonstrated the influence of land use and riparian vegetation on stream metabolism (Fellows et al. Citation2006; Bernot et al. Citation2010; Hornbach et al. Citation2016). It is possible that lower levels of GPP in the North Branch are due in part to shading from tree cover (42% forest cover in the North Branch, compared to 24% in the South Branch). Differences in nutrient regime due to anthropogenic land use are also known to influence primary production by altering the sources and relative importance of different types of organic matter in a stream (Young & Huryn Citation1999). Therefore, metabolism could have been affected by land use differences in the two branches.
In this study we found conflicting results from the fish and macroinvertebrate IBIs, with the South Branch having a higher fish IBI and the North Branch having a higher macroinvertebrate FBI. Stream bioassessments are usually conducted using either fishes or macroinvertebrates, with the assumption that a single taxonomic assemblage is representative of the overall ecological condition and integrity of the stream (Paller Citation2001). As in our study, others have found similar differences between fish and macroinvertebrate indices among sites. Johnson and Ringler (Citation2014) found that fish IBI was not significantly correlated with various measures of macroinvertebrate community health. Pilière et al. (Citation2014) suggested that fish community measures of integrity were more related to physical traits of streams, while macroinvertebrate measures responded most to phosphorus concentrations. Combining fish and macroinvertebrate metrics, however, were effective in differentiating reference from impacted sites (Ruaro et al. Citation2016). Barbour et al. (Citation1999) recommend using multiple taxonomic groups to insure adequacy in comparing water quality among sites.
Climate change is expected to increase temperature in streams in most regions (Allan et al. Citation2004, Kaushal et al. Citation2010). This increase will likely have significant impacts on the community structure of fish and invertebrates and in ecosystem functions. In this study, we investigated differences between a coldwater stream and another that is slightly warmer as a model of what might be predicted with warming. One might expect a move towards a fish community more dominated by warmwater species (Buisson et al. Citation2013) and a decrease in density in macroinvertebrate communities (Li et al. Citation2012) with a shift towards smaller and shorter-lived species (Lawrence et al. Citation2010). In addition, an increase in GPP (Yvon-Durocher et al. Citation2010), periphyton growth and leaf decomposition rates (Fernandes et al. Citation2014, Mora-Gomez et al. Citation2015) might be expected. Our results gave mixed results concerning these predictions. Griffith et al. (Citation2005) noted that macroinvertebrates and fish differ in their sensitivity to human and climate impacts and that combining these measures with others would provide a multimetric approach for examining differences among sites. Freiberg et al. (Citation2011) found both ecosystem and structural measures providing complementary responses to temperature differences in streams. Changes in aquatic communities and ecosystem processes are influenced by many factors beyond increases in temperature, thus it is important to partition the responses in various metrics to changes in water quality and to temperature sensitivity (Hamilton et al. Citation2010). We suggest that multiple measures, utilizing both structural and functional measures of stream systems such as those in this study and suggested by others (Friberg et al. Citation2011; Hopkins et al. Citation2011), be further researched to assess the impact of climate change versus other anthropogenic impacts on stream habitat quality.
Acknowledgments
We undertook this research project as part of a Fall 2015 Aquatic Ecology class at Macalester College, which provided financial support. Our thanks go to the Belwin Conservancy for access to Valley Creek, colleagues from EREN (Ecological Research as Education Network: http://erenweb.org) for the inspiration to conduct this project, Erik Anderson and Aaron DeRusha, Water Resource Specialists, Washington Conservation District for providing discharge data, and Jim Almendinger of the St. Croix Watershed Research Station for providing information about Valley Creek.
Disclosure statement
No potential conflict of interest was reported by the authors.
Additional information
Notes on contributors
Daniel Hornbach
Daniel Hornbach earned a PhD in zoology from Miami University, Oxford, OH. His research includes freshwater mollusk ecology and more recently ecosystem metabolism in freshwater systems. He is currently working on a research project examining the impacts of land use and suspended sediments on freshwater mussels.
Mark Hove
Mark Hove earned a masters in fisheries science from Virginia Polytechnic Institute and State University in 1990. His research interests include freshwater mollusk ecology and conservation, and fisheries science.
The other coauthors completed this work as undergraduates at Macalester College, St. Paul, MN, USA.
References
- Abelho M. 2001. From litterfall to breakdown in streams: a review. Sci World. 1:656–680.
- Allan JD, Palmer MA, Poff NL. 2004. Freshwater ecology. In: Lovejoy TE, Hannah L, editors. Climate change and biodiversity. New Haven (CT): Yale University Press; p. 272–288.
- Almeida GH, Boëchatb IG, Gückerb B. 2014. Assessment of stream ecosystem health based on oxygen metabolism: which sensor to use? Ecol Eng. 69:134–138.
- Almendinger JE. 2003. Watershed hydrology of Valley Creek and Browns Creek: trout streams influenced by agriculture and urbanization in eastern Washington County, Minnesota, 1998–99. Marine on St. Croix (MN): St. Croix Watershed Research Station, Science Museum of Minnesota.
- Alonso A, González-Muñoz N, Castro-Díez P. 2010. Comparison of leaf decomposition and macroinvertebrate colonization between exotic and native trees in a freshwater ecosystem. Ecol Res. 25:647–653.
- Arar EJ, Collins GB. 1997. In vitro determination of chlorophyll a and pheophytin a in marine and freshwater algae by fluorescence. Cincinnati (OH): National Exposure Research Laboratory Office of Research and Development U.S. Environmental Protection Agency. ( EPA publication; method no. 445.0). [ Accessed 13 Dec 2015]. Available from: http://permanent.access.gpo.gov/lps68140/m445-0.pdf
- Aristegi L, Izagirre O, Elosegi A. 2009. Comparison of several methods to calculate reaeration in streams, and their effects on estimation of metabolism. Hydrobiologia. 635:113–124.
- Ashton IW, Hyatt LA, Howe KM, Gurevitch J, Lerdau MT. 2005. Invasive species accelerate decomposition and litter nitrogen loss in a mixed deciduous forest. Ecol Appl. 15:1263–1272.
- Barbour MT, Gerritsen J, Snyder BD, Stribling JB. 1999. Rapid bioassessment protocols for use in streams and wadeable rivers: periphyton, benthic macroinvertebrates and fish 2nd ed. Washington (DC): US Environmental Protection Agency, Office of Water ( EPA 841-B-99-002).
- Barr Engineering. 2015. Valley Branch Watershed District 2015-2025 Watershed Management Plan, September 2015. [ Accessed 17 Dec 2015]. Available from: http://www.vbwd.org/wmp/VBWD2015WMP.pdf
- Baxter C, Hauer FC, Woessner W. 2003. Measuring groundwater–stream water exchange: new techniques for installing minipiezometers and estimating hydraulic conductivity. Trans Am Fish Soc. 132:493–502.
- Becker GC. 1983. Fishes of Wisconsin. Madison (WI): Univ Wisc Press; 1052 p.
- Behar S. 1996. Testing the waters: chemical and physical vital signs of a river. Montpelier (VT): River Watch Network.
- Bernhardt ES, Likens GE. 2004. Controls on periphyton biomass in heterotrophic streams. Freshw Biol. 49:14–27.
- Bernot MJ, Sobota DJ, Hall RO, Mulholland PJ, Dodds WK, Webster JR, Tank JL, Ashkenas LR, Cooper LW, Dahm CN, et al. 2010. Inter-regional comparison of land-use effects on stream metabolism. Freshw Biol. 55:1874–1890.
- Beugly J, Pyron M. 2010. Temporal and spatial variation in the long-term functional organization of fish assemblages in a large river. Hydrobiologia. 654:215–226.
- Blott SJ, Pye K. 2001. Gradistat: a grain size distribution and statistics package for the analysis of unconsolidated sediments. Earth Surf Proc Land. 26:1237–1248.
- Bouchard WR, Jr. 2004. Guide to aquatic invertebrates of the Upper Midwest. St. Paul (MN): Water Resources Center, University of Minnesota; 208 p.
- Brown, LR. 1989. Temperature preferences and oxygen consumption of three species of sculpin (Cottus) from the Pit River drainage, California. Environ Biol Fish. 26:223–236.
- Buisson L, Grenouillet G, Villéger S, Canal J, Laffaille P. 2013. Towards a loss of functional diversity in stream fish assemblages under climate change. Glob Clim Change. 19:387–400.
- Caissie D. 2006. The thermal regime of rivers: a review. Freshw Biol. 51:1389–1406.
- Chapra SC, Di Toro DM. 1991. Delta method for estimating primary production, respiration, and reaeration in streams. J Environ Eng. 117:640–655.
- Cuffney TF, Brightbill RA, May JT, Waite IR. 2010. Response of benthic macroinvertebrates to environmental changes associated with urbanization in nine metropolitan areas. Ecol Appl. 20:1384–1401.
- Dallas HF, Ross-Gillespie V. 2015. Sublethal effects of temperature on freshwater organisms, with special reference to aquatic insects. Water SA. 41:712–726.
- Dittrich A, Schmedtje U. 1995. Indicating shear-stress with FST-hemispheres – effects of stream-bottom topography and water depth. Freshw Biol. 34:107–121.
- Eaton JG, Scheller RM. 1996. Effects of climate warming on fish thermal habitat in streams of the United States. Limnol Oceanogr. 4l:1109–1115.
- Ehrenfeld JG. 2003. Effects of exotic plant invasions on soil nutrient cycling processes. Ecosystems. 6:503–523.
- Feio MJ, Alves T, Boavida M, Medeiros A, Graça MAS. 2010. Functional indicators of stream health: a river-basin approach. Freshw Biol. 55:1050–1065.
- Fellows CS, Clapcott JE, Udy JW, Bunn SE, Harch BD, Smith MJ, Davies PM. 2006. Benthic metabolism as an indicator of stream ecosystem health. Hydrobiologia. 572:71–87.
- Fernandes I, Seena S, Pascoal C, Cássio F. 2014. Elevated temperature may intensify the positive effects of nutrients on microbial decomposition in streams. Freshw Biol. 59:2390–2399.
- Fischenich C. 2001. Stability thresholds for stream restoration materials," EMRRP Technical Notes Collection (ERDC TN-EMRRP-SR-29), U.S. Vicksburg (MS): Army Engineer Research and Development Center.
- Freund JG, Thobaben E, Barkowski N, Reijo C. 2013. Rapid in-stream decomposition of leaves of common buckthorn (Rhamnus cathartica), an invasive tree species. J Freshw Ecol. 28:355–363.
- Friberg N, Bonada N, Bradley DC, Dunbar MJ, Edwards FK, Grey J, Hayes RB, Hildrew AG, Lamouroux N, Trimmer M, Woodward G. 2011. Biomonitoring of human impacts in freshwater ecosystems: the good, the bad and the ugly. Adv Ecol Res. 44:1–68.
- Fuller RL, Griego C, Mushlbauer JD, Dennison J, Doyle MW. 2010. Response of stream macroinvertebrates in flow refugia and high-scour areas to a series of floods: a reciprocal replacement study. J North Am Benthol Soc. 29:750–760.
- Gessner MO, Chauvet E. 2002. A case for using litter breakdown to assess functional stream integrity. Ecol Appl. 12:498–510.
- Gessner MO, Swan CM, Dang CK, McKie BG, Bardgett RD, Wall DH, Hättenschwiler S. 2010. Diversity meets decomposition. Trends Ecol Evol. 25:372–380.
- Grace MR, Giling DP, Hladyz S, Caron V, Thompson RM, Mac Nally R. 2015. Fast processing of diel oxygen curves: estimating stream metabolism with BASE (BAyesian Single-station Estimation). Limnol Oceanogr-Meth. 13:103–114.
- Griffith MB, Hill BH, McCormick FH, Kaufmann PR, Herlihy AT, Anthony R, Selle AR. 2005. Comparative application of indices of biotic integrity based on periphyton, macroinvertebrates, and fish to southern Rocky Mountain streams. Ecol Indic. 5:117–136.
- Hall RO, Tank JL. 2005. Correcting whole-stream estimates of metabolism for groundwater input. Limnol Oceanogr-Meth. 3:222–229.
- Hamilton AT, Stamp JD, Bierwagen BG. 2010. Vulnerability of biological metrics and multimetric indices to effects of climate change. J N Am Benthol Soc. 29:1379–1396.
- Heard SB, Schultz GA, Ogden CB, Griesel TC. 1999. Mechanical abrasion and organic matter processing in an Iowa stream. Hydrobiologia. 400:179–186.
- Herringshaw CJ, Stewart TW, Thompson JR, Anderson PF. 2011. Land use, stream habitat and benthic invertebrate assemblages in a highly altered Iowa watershed. Am Midl Nat. 165:274—293.
- Hester ET, Doyle MW. 2011. Human impacts to river temperature and their effects on biological processes: a quantitative synthesis. J Am Water Resour Assoc. 47:571–587.
- Hieber M, Robinson CT, Uehlinger U, Ward JV. 2005. A comparison of benthic macroinvertebrate assemblages among different types of alpine streams. Freshw Biol. 50:2087–2100.
- Holsinger JR. 1972. The freshwater amphipod crustaceans (Gammaridae) of North America. Biota of freshwater ecosystems, identification manual 5. Cincinnati (OH): US Environmental Protection Agency; 89 p.
- Hoover TM, Ackerman JD. 2011. Microdistribution of a torrential stream invertebrate: are bottom-up, top-down, or hydrodynamic controls most important? Limnol Oceanogr. 1:147–162.
- Hopkins JM, Marcarelli AM, Bechtold HA. 2011. Ecosystem structure and function are complementary measures of water quality in a polluted, spring-influenced river. Water Soil Pollut. 214:409–421.
- Hornbach DJ, Beckel R, Hustad EN, McAdam DP, Roen IM, Wareham AJ. 2016. The influence of riparian vegetation and season on stream metabolism of Valley Creek, Minnesota. J Freshw Ecol. 30:569–588.
- Irons JG, Oswood MW, Stour RJ, Pringle CM. 1994. Latitudinal pattens in leaf litter breakdown: is temperature really important? Freshw Biol. 32:401–411.
- Jacobsen D, Schultz R, Encalada A. 1997. Structure and diversity of stream invertebrate assemblages: the influence of temperature with altitude and latitude. Freshw Biol. 38:247–261.
- Jin S, Yang L, Danielson P, Homer CG, Fry JA, Xian G. 2013. A comprehensive change detection method for updating the National Land Cover Database to circa 2011. Remote Sens Environ. 132:159–175.
- Johnson SL, Ringler NH. 2014. The response of fish and macroinvertebrate assemblages to multiple stressors: a comparative analysis of aquatic communities in a perturbed watershed (Onondaga Lake, NY). Ecol Indic. 41:198–208.
- Julien PY. 1995. Erosion and sedimentation. New York (NY): Cambridge University Press; 280 p.
- Karr JR, Chu EW. 1999. Restoring life in running water, better biological monitoring. Washington (DC): Island Press.
- Kaushal SS, Likens GE, Jaworski NA, Pace ML, Sides AM, Seekell D, Belt KT, Secor DH, Wingate RL. 2010. Rising stream and river temperatures in the United States. Front Ecol Environ. 8:461–466.
- Larned ST. 2010. A prospectus for periphyton: recent and future ecological research. J North Am Benthol Soc. 29:182–206.
- Lawrence JE, Lunde KB, Mazor RD, Bêche LA, McElravy EP, Resh VH. 2010. Long-term macroinvertebrate responses to climate change: implications for biological assessment in mediterranean-climate streams. J North Am Benthol Soc. 29:1424–1440.
- Lessard JL, Hayes DB. 2003. Effects of elevated water temperature on fish and macroinvertebrate communities below dams. River Res Appl. 19:721–732.
- Li F, Cai Q, Jiang W, Qu X. 2012. The response of benthic macroinvertebrate communities to climate change: evidence from subtropical mountain streams in Central China. Int Rev Hydrobiol. 97:200–214.
- Long MH, Rheuban JE, Berg P, Zieman JC. 2012. A comparison and correction of light intensity loggers to photosynthetically active radiation sensors. Limnol Oceanogr-Meth. 10:416–424.
- Luce JJ, Lapointe MF, Roy AG, Ketterling DB. 2013. The effects of sand abrasion of a predominantly stable stream bed on periphyton biomass losses. Ecohydrology. 6:689–699.
- Lyons J, Wang L, Simonson TD. 1996. Development and validation of an index of biotic integrity for coldwater streams in Wisconsin. North Am J Fish Mgmt. 16:241–256.
- Marchant R, Norris RH, Milligan A. 2006. Evaluation and application of methods for biological assessment of streams: summary of papers. Hydrobiologia. 572:1–7.
- Metropolitan Council. 2014. Comprehensive water quality assessment of select metropolitan area streams. St. Paul (MN): Metropolitan Council. [ Accessed 15 Dec 2015]. Available from: http://www.metrocouncil.org/Wastewater-Water/Services/Water-Quality-Management/Stream-Monitoring-Assessment/St-Croix-River-Tributary-Streams-Assessment/St-Croix-Trib-Assessment-Reports/Valley-Creek-Section.aspx
- Mora-Gomez J, Elosegi, A, Mas-Marti E, Romani AM. 2015. Factors controlling seasonality in leaf-litter breakdown in a Mediterranean stream. Freshw Sci. 34:1245–1258.
- Moss B. 2012. Cogs in the endless machine: lakes, climate change and nutrient cycles: a review. Sci Total Environ. 434:130–142.
- Mundahl ND, Simon TP. 1998. Development and application of an index of biotic integrity of coldwater streams of the upper Midwestern United States. In: Simon TP, editor. Assessing the sustainability and biological integrity of water resources using fish communities. Boca Raton (FL): CRC Press; p. 383–415.
- Odum HT. 1956. Primary production in flowing waters. Limnol Oceanogr. 1:102–117.
- Oki T, Kanae S. 2006. Global hydrological cycles and world water resources. Science. 313:1068–1072.
- Omar WMW. 2010. Perspectives on the use of algae as biological indicators for monitoring and protecting aquatic environments, with special reference to Malaysian freshwater ecosystems. Trop Life Sci Res. 21:51–67.
- Paller MH. 2001. Comparison of fish and macroinvertebrate bioassessments from South Carolina coastal plain streams. Aquat Ecosyst Health. 4:175–186.
- Pilière A, Schippera AM, Breurea AM, Posthumab L, de Zwartb D, Dyerc SD, Huijbregtsa MAJ. 2014. Comparing responses of freshwater fish and invertebrate community integrity along multiple environmental gradients. Ecol Indic. 43:215–226.
- Pringle CM, Triska FJ. 2006. Effects of nutrient enrichment on periphyton. In: Hauer FR, Lamberti GA, editors. Stream ecology: field and laboratory exercise. 2nd ed. New York: Academic Press; p. 743–760.
- Raleigh RF, Zuckerman LD, Nelson PC. 1986. Habitat suitability index models and instream flow suitability curves: brown trout, revised. Washington DC: U.S. Fish Wildl Serv Biol Rep. 82(10.124). 65 p. [First printed as: FWS/OBS-82/10.71, September 1984]
- Reichert P, Uehlinger U, Acuña V. 2009. Estimating stream metabolism from oxygen concentrations: effect of spatial heterogeneity. J Geophys Res. 114. doi:10.1029/2008JG000917.
- Riley AJ, Dodds WK. 2013. Whole-stream metabolism: strategies for measuring and modeling diel trends of dissolved oxygen. Freshw Sci. 32:56–69.
- Riseng CM, Wiley MJ, Seelbach R, Stevenson J. 2010. An ecological assessment of Great Lakes tributaries in the Michigan peninsulas. J Great Lakes Res. 36:505–519.
- Roberts BJ, Mulholland PJ. 2007. In-stream biotic control on nutrient biogeochemistry in a forested stream, West Fork of Walker Branch. J Geophys Res. 112:G04002. doi:10.1029/2007JG000422.
- Ruaro R, Gubiani EA, Cunico AM, Moretto Y, Piana PA. 2016. Compariosn of fish and macroinvertebrates as bioindicators of Neotropical streams. Envrion Monit Assess. 188:45. doi:10.1007/s10661-015-5046-9.
- Sandin L, Solimini AG. 2009. Freshwater ecosystem structure–function relationships: from theory to application. Freshw Biol. 54:2017–2024.
- Schindler DW. 1997. Widespread effects of climatic warming on freshwater ecosystems in North America. Hydrol Process. 11:1043–1067.
- Statzner B, Müller R. 1989. Standard hemispheres as indicators of flow characteristics in lotic benthos research. Freshw Biol. 21:445–459.
- Stewart J. 2007. Valley Creek stream survey. St. Paul (MN): Minnesota Department of Natural Resources; 31 p.
- Swan CM, Healey B, Richardson DC. 2008. The role of native riparian tree species in decomposition of invasive tree of heaven (Ailanthus altissima) leaf litter in an urban stream. Ecoscience. 15:27–35.
- Udy JW, Fellows CS, Bartkow ME, Bunn SE, Clapcott JE, Harch BD. 2006. Measures of nutrient processes as indicators of stream ecosystem health. Hydrobiologia. 572:89–102.
- van Vliet MTH, Franssen WHP, Yearsley JR, Ludwig F, Haddeland I, Lettenmaier DP, Kabat P. 2013. Global river discharge and water temperature under climate change. Glob Environ Change. 23:450–464.
- Vaughn CC, Spooner DE, Galbraith HS. 2007. Context-dependent species identity effects with a functional group of filter-feeding bivalves. Ecology. 88:1654–1662.
- Wang L, Lyons J. 2003. Fish and benthic macroinvertebrate assemblages as indicators of stream degradation in urbanizing watersheds. In: Simon TP, editor. Biological response signatures: multimetric index patterns for assessment of freshwater aquatic assemblages. Boca Raton (FL): CRC Press; p. 227–249.
- Warnaars TA, Hondzo M, Power ME. 2007. Abiotic controls on periphyton accrual and metabolism in streams: scaling by dimensionless numbers. Water Resour Res. 43:1–13.
- Webster JR, Benfield EF. 1986. Vascular plant breakdown in freshwater ecosystems. Annu Rev Ecol Evol Syst. 17:567—594.
- Whitehead PG, Wilby RL, Battarbee RW, Kernan M, Wade AJ. 2009. A review of the potential impacts of climate change on surface water quality. Hydrolog Sci J. 54:101–123.
- Wilby RL, Orr H, Watts G, Battarbe RW, Berry PM, Chadd R, Dugdale SJ, Dunbar MJ, Elliott JA, Extence C, et al. 2010. Evidence needed to manage freshwater ecosystems in a changing climate: turning adaptation principles into practice. Sci Total Environ. 408:4150–4164.
- Williams JE, Neville HM, Haak AL, Colyer WT, Wenger SJ, Bradshaw S. 2015. Climate change adaptation and restoration of western trout streams: opportunities and strategies. Fisheries. 40:304–317.
- Wold AP, Hershey AE. 1999. Spatial and temporal variability of nutrient limitation in 6 north shore tributaries to Lake Superior. J North Am Benthol Soc. 18:2–14.
- Woodcock TS, Huryn AD. 2007. The response of macroinvertebrate production to a pollution gradient in a headwater stream. Freshw Biol. 52:177–196.
- Wright JF, Moss D, Armitage PD, Furse MT. 1984. A preliminary classification of running-water sites in Great Britain based on macroinvertebrate species and the prediction of community type using environmental data. Freshw Biol. 14:221–256.
- Yoder CO. 2012. Development of a database for upper thermal tolerances for New England freshwater fish species. Columbus: (OH): Center for Applied Bioassessment and Biocriteria. Midwest Biodiversity Institute Technical Report MBI/2012-4-6 ( 43221-0561).
- Young RG, Huryn AD. 1999. Effects of land use on stream metabolism and organic matter turnover. Ecol Appl. 9:1359–1376.
- Young RG, Matthaei CD, Townsend CR. 2008. Organic matter breakdown and ecosystem metabolism: functional indicators for assessing river ecosystem health. J North Am Benthol Soc. 27:605–625.
- Yvon-Durocher G, Jones JI, Trimmer M, Woodward G, Montoya JM. 2010. Warming alters the metabolic balance of ecosystems. Philos Trans R Soc Lond B Biol Sci. 365:2117–2126.
- Zapp MJ, Almendinger JE. 2001. Nutrient dynamics and water quality of valley creek, a high quality trout stream in southeastern Washington County. St. Paul (MN): Water Resources Science, University of Minnesota. Final Project Report to the Valley Branch Watershed District.