
ABSTRACT
The composition, biomass and dynamics of autotrophic picoplankton (APP, size range of 0.2–2 μm) in a subtropical reservoir (Cerrillos, Puerto Rico) were examined from January to December 2013. Samples were collected monthly in the limnetic zone. Because of their small size, APP were identified and quantified using flow cytometry and epifluorescence microscopy. The warm monomictic nature of this reservoir resulted in thermal stratification during most of the year. Near surface dissolved oxygen was relatively high (7.61 mg/L). However, hypoxic and anoxic conditions were present in the hypolimnion during the whole period of study. Flow cytometry analyses allowed the identification of two populations of picoplanktonic organisms. Picocyanobacteria groups (phycoerythrin-rich Synechococcus type) were dominant throughout the study, with maximum summer abundances of 6.6 × 10⁴ cells/mL, although picoeukaryotes were temporally important. Annual mean total chlorophyll-a (Chl-a) in the euphotic zone was 7.54 ± 3.41 μg/L. Fractionated Chl-a exhibited a relatively constant pattern: ranging from 0.24 to 1.99 μg/L. The average contribution of APP to total Chl-a concentration was 11%. Chl-a concentration reflected the annual variation in picoplankton, being higher during summer when solar radiation was also higher. The picoplanktonic community was structured in accordance to thermal stratification, nutrients and light availability. Understanding the dynamics of picoplankton and their response to environmental change are important because they are a good indicator of the trophic status of reservoirs, especially drinking water reservoirs, and can guide management decisions.
Introduction
Autotrophic picoplankton (APP) is defined as the fraction of phytoplankton within the size range of 0.2–2 μm, including prokaryotic and eukaryotic cells (Callieri et al. Citation2007). They are distributed worldwide and are ubiquitous in all types of lakes of varying trophic states (Stockner Citation1991). The APP community is composed predominantly of picocyanobacteria (Pcy), regardless of the trophic status, while picoeukaryotes (Peuk) are numerically less abundant (Winder Citation2009). The genera Procholorococcus and Synechococcus dominate the Pcy community in marine waters (DuRand et al. Citation2001). In freshwater ecosystems, species of the phycoerythrin-rich genus Synechococcus and phycocyanin-rich genus Cyanobium are the most commonly observed (Callieri Citation2007; Winder Citation2009).
The APP community plays an important role in the carbon production in oceans and freshwater ecosystems (Callieri et al. Citation2002). Picoplanktonic species are considered the main contributors to phytoplankton biomass and primary production (Worden Citation2004). They can fix annually 50%–70% of the carbon in oligotrophic freshwater ecosystems (Caron et al. Citation1985). The activity of picoplankton constitutes an important resource of energy in the aquatic microbial loop and plays a major role in biogeochemical processes (Cotner & Biddanda Citation2002).
Changes in environmental conditions in temperate lakes seem to support the coexistence of multiple Pcy genotypes (Postius & Ernst Citation1999; Callieri et al. Citation2012). In temperate lakes, the typical seasonal cycle of Pcy shows a bimodal pattern with a spring or early summer peak, which corresponds to the onset of stratification, and a second peak during autumn (Stockner et al. Citation2000). In contrast, peak abundances of Peuk are normally observed only during the spring isothermal mixing, early thermal stratification (Callieri & Stockner Citation2002), while low numbers occur during the rest of the year (Crosbie et al. Citation2003). In tropical freshwaters, Sarmento et al. (Citation2008) reported a constantly high abundance of photosynthetic picoplankton (mainly Synechococcus). Similar results were found by Stenuite et al. (Citation2009) in Lake Tanganyika, where the abundance of this group remained high throughout the year. Tropical lakes and reservoirs generally have a constant temperature during the entire year, with a monomictic thermal regime and a long period of stratification in deep water bodies (Lewis Citation2000).
Transparency and light conditions in the water column also have a major impact in the composition of the photosynthetic picoplankton (Sarmento et al. Citation2008). According to Stockner et al. (Citation2000), underwater light conditions are very important for the growth and production of photosynthetic picoplankton whose abundance and distribution within the water column can change rapidly with different thermal and light regimes. Waterbury et al. (Citation1986) observed in laboratory experiments that the optimum growth rate of Synechococcus occurs under low light conditions. However, during in situ studies, Pcy and Peuk have been found at a variety of depths and light irradiances (Nagata et al. Citation1994; Callieri & Pinolini Citation1995), thus suggesting that vertical distribution of Pcy is directly related to the penetration of light (Pick Citation1991).
The availability of light and nutrients exerts a strong effect on the seasonal dynamics of APP (Winder Citation2009). According to Schindler (Citation2006), phosphorus is considered the limiting nutrient in temperate lakes. In contrast, studies in tropical lakes and ultraoligotrophic Patagonian Lakes show nitrogen as the limiting nutrient of phytoplankton growth (Lewis Citation2002; Diaz et al. Citation2007). The importance of co-limitation by N and P has commonly been observed in marine, lakes and reservoirs systems throughout the world (Dzialowski et al. Citation2005; Smith Citation2006; Dove & Chapra Citation2015). Similar results were observed in Caribbean warm tropical reservoirs (Pantoja-Agreda et al. Citation2009), where the N/P ratios suggested a general trend towards co-limitation of both nutrients.
There is relatively scarce information on the abundance and the population dynamics of APP in tropical freshwater systems (Stenuite et al. Citation2009). The large contribution of picoplankton to primary productivity, biomass and trophic dynamics in tropical lakes and reservoirs has not received the same level of inquiry that has been given to non-picoplanktonic cyanobacteria and other phytoplankton groups (Nagata et al. Citation1994; Ivanikova et al. Citation2007). The aim of the present study is to expand our knowledge on the abundance and composition of picoplankton community of warm subtropical reservoirs, while addressing the link between these communities with environmental variables throughout an annual cycle.
Methods
Study area description
The research was carried out in Cerrillos Reservoir, a subtropical reservoir located in the south of Puerto Rico (18˚04ˈ N; 66˚40ˈ W) at an elevation of 170 m above sea level. Constructed in 1991, this reservoir provides flood protection, water supplies and recreation for the city of Ponce (Soler-López Citation2011). The reservoir has a surface area of 1.32 km2, a drainage area of 45.3 km2; the mean depth is 25 m with a maximum depth of 65 m near the dam. The annual average annual rainfall is 236 cm. The typical dry season is from December to March, and the wet season is from May to November. Sedimentation has reduced the storage capacity of Cerrillos Reservoir from 38.03 in 1991 to 37.26 million m3 in 2008 (Soler-López Citation2011) and its mean water residence time is 0.87 year. Details of the limnological characteristics in the Cerrillos Reservoir can be found in Sotomayor et al. (Citation2008).
Sampling and environmental parameters
Water samples were collected monthly in the central region of the reservoir (25 m maximum depth) from January to December 2013 using a 2 L horizontal Van Dorn bottle at surface, 1%, 0.1% and 0.01% of photosynthetically active radiation (PAR). Vertical profiles of temperature, dissolved oxygen, pH, conductivity and oxidation--reduction potential (redox) were obtained using a multiparameter probe (CTD12, Applied Microsystems Inc., http://www.amicro.com). PAR was measured at different depths using an underwater quantum sensor (LI-192, LI-COR, http://www.licor.com). Vertical attenuation coefficients were calculated according to the equation of Kirk (Citation1994). The euphotic zone was defined as the depth where PAR reaches 1% of surface PAR (Z1%). Total nitrogen (TN) and total phosphorus (TP) concentrations were determined after acid digestion by the molybdate-ascorbic acid method (Valderrama Citation1981). Nitrate and orthophosphate were analyzed according to APHA (Citation1998) after sample filtration through GF/F (Whatman GF/F, 0.7 µm nominal pore size) filters.
Picoplankton abundance and biomass estimation
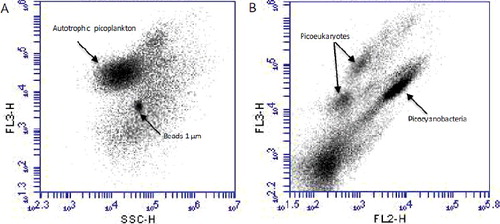
APP cells were counted using flow cytometry and estimated cell biovolume measurements by epifluorescence microscopy. For the flow cytometric counts of APP populations, 4 mL fresh water samples were collected from each depth and fixed immediately using cold 25%-glutaraldehyde (final concentration 2%), stored in darkness at 4 °C, and processed within two weeks. Samples were analyzed in an Accuri C6 (Becton Dickinson) flow cytometer equipped with an air-cooled argon laser (488 nm blue and 620 nm red excitation). Each sample was run for 4 min at fast flow rate (66 µL/min). Filters for fluorescence emission were used forward scatter (FSC) and side scatter (SSC), indicative of cell size, shape and refractive index, green fluorescence (FL1 = 530 nm) from phycobilin, orange fluorescence (FL2 = 585 nm) from phycoerythrin and red fluorescence (FL3 = 670 nm) from Chl-a. Fluorescent beads (yellow-green microspheres, Polysciences Inc., http://www.polysciences.com) of 1 µm diameter were used to calibrate the side scatter signal and to control the internal volume standards. Pcy and Peuk populations were identified and enumerated using a three-dimensional gate base on red fluorescence (FL3) versus side scatter (SSC), and red fluorescence (FL3) versus orange fluorescence (FL2, ). Flow cytometry data were collected and analyzed using CFlow software 2012.
Figure 1. Cytograms by flow cytometry analysis of samples from the surface water: (A) chlorophyll (FL3) vs. side scatter (SSC) and (B) chlorophyll (FL3) vs. phycoerythrin (FL2) fluorescence.
Chl-a concentration was determined fluorometrically for total phytoplankton and picophytoplankton. Water samples of 250 mL were filtered on Whatman GF/F glass fiber filters (0.7 µm pore size) for the phytoplankton chlorophyll-a content. To measure chlorophyll-a content of the picophytoplankton fraction, a 250--500 mL water sample was separated by differential filtration, through a 2 µm pore size polycarbonate filter and the filtrate was subsequently filtered through a 0.2 µm pore size polycarbonate filter (Whatman, Nucleopore). Pigments were extracted in darkness and ≤500 mm Hg partial vacuum. The filters were frozen at −20 °C and analyzed within a month. Chlorophyll was extracted following sonication of the filters for 5 min in 10 mL of hot 90% ethanol (Nusch Citation1980) and kept over 24 hours in darkness at 4 °C. The extracts were analyzed in a Fluorometer (10-AU, Turner Designs, Inc., http://www.turnerdesigns.com), using an emission wavelength of 650 nm before and after acidification with 100 µL of 0.12 N HCl. Calibration of the fluorometer was accomplished using a Chl-a pure standard (C-6144, 1 mg, Sigma Chemical, http://www.sigmaaldrich.com).
Data analysis
Analysis of variance (ANOVA) and t-test were used to determine seasonal and vertical differences (p < 0.05) in abiotic and biotic variables. The data were normalized using logarithmic transformation. Pearson correlations of picophytoplankton abundances and limnological variables were calculated for stratification and circulation periods. All statistical analyses were completed using MINITAB version 16.1. The values of APP abundance, Chl-a and selected environmental parameters were plotted by isolines as functions of depth and time with the Surfer (Golden Software Citation2012) program, using a kriging interpolation method.
Results
Environmental variables
The average surface water temperature was 28.1 ± 1.46 °C and 26.04 ± 1.16 °C at 25 m. Minimum water column temperature occurred during February (24.3 °C at 25 m depth), whereas maximum temperatures were observed in July (28.3 °C at 1 m depth) during the summer season. A stable thermal stratification was observed during most of the year (April to October) with one mixing period in the dry and cold season (November to February). The average thermocline depth was 8.3 m which reached a maximum of 12 m in September. The seasonal change in the vertical profile was typical of warm monomictic lakes. Maximum differences between the surface and bottom temperatures >4.8 °C were observed in August. The largest gradient of temperature in the water column about 1.2 °C/m which occurred during late stratification.
According to PAR values, the euphotic zone average was 8 m during the mixing period and 4.6 m during the stratification period. The Zeup reached its maximum in March (9.8 m) and its minimum in July (4.6 m). The depth of 0.1% of PAR was deeper than 12 m and that of 0.01% PAR was often around 22 m.
The dissolved oxygen (DO) concentration generally was higher in the upper water layer than in the lower and followed the dry and wet seasonality. The average O2 in the water column was 3.26 ± 0.61 mg/L. The average concentration at the surface was 7.61 ± 0.72 mg/L while 2.26 ± 1.3 mg/L below the thermocline. Lake Cerrillos developed a clinograde DO profile during the months of July and August, with dissolved oxygen concentrations greater than 7 mg/L in the epilimnion, and anoxic conditions in the bottom with DO concentrations below 1 mg/L, the hypolimnion remained anoxic during a large fraction of the stratified period. In the cold and dry months (December to March), a mixing trend was observed, forming a more homogeneous water column, where the average DO difference between the surface and the bottom is 3.6 mg/L.
Nitrogen and phosphorus concentrations in Cerrillos Reservoir fluctuated through the year. The mean photic zone TN concentration was 0.21 ± 0.06 mg/L, with minimum values (0.09 mg/L) during December and maximum values (0.33 mg/L) during May. A similar pattern was observed for TP, with mean photic zone concentration of 0.01 ± 0.0019 mg/L, minimum and maximum values of 0.006 mg/L and 0.011 mg/L in November and June, respectively. The patterns of seasonal change in the levels of TN and TP showed similar tendency, higher concentrations during the summer months (May to September) and lower at the onset and throughout the mixing period of the cold and dry months (November to February). The mean concentration of nitrate in the photic zone was 0.025 ± 0.008 mg/L; varied from 0.001 mg/L in April to 0.18 mg/L in July. The nitrate concentrations did not exhibit any large differences between the upper and lower water layers in the reservoir. Phosphate concentrations were always low, below the detection limits of the methods used (<0.005 mg/L).
Chlorophyll-a concentration
The mean photic zone total Chl-a concentration was 7.54 ± 3.41 μg/L, with minimum values in February (1.50 μg/L) during the mixing to 1% of surface PAR (6–8 m). Higher concentrations were measured during the stratification in the upper layer (0–1 m) corresponding to 99% of surface PAR with maximum values in August (24.4 μg/L; (A)). APP chlorophyll-a concentration (≤2 μm fraction) was generally low with a mean photic zone concentration of 0.72 ± 0.28 μg/L. The maximum value was observed in June (1.99 μg/L) during the thermal stratification in the surface and the minimum in February (0.24 μg/L) at a depth of 6–8 m (Z1%) during the circulation period (). The average contribution of APP to total Chl-a concentration in the surface, estimated by size fractionation, during the study was 10.9% and varied from 0.99% (September) to 20.5% (June; (B)). Chl-a concentration reflected the annual variation in picoplankton density with the highest concentration during summer, when solar radiation was also higher. The average difference in Chl-a concentration between the surface and the limit of the photic zone was 0.55 μg/L concentrations reached similar values in the entire column during the mixed period. The highest peaks were obtained in the rainy season and the lowest during the dry season. The Pearson correlations analysis showed that Chl-a concentrations had significant positive correlations (p < 0.001) with nitrate and TN (r = 0.54 and r = 0.62, respectively) and negative correlations with pH and DO. Chl-a was significantly different between two depths: 1% and 0.1% of surface PAR (ANOVA p < 0.05).
Figure 2. Seasonal and vertical distribution of chlorophyll-a concentrations (µg/L) for the picoplankton fraction in the Cerrillos Reservoir.
Figure 3. (A) Total chlorophyll-a (0.7 µm fraction) and >2 µm fraction of phytoplankton in the surface water of Cerrillos Reservoir. (B) Autotrophic picoplankton (APP) chlorophyll-a concentrations (<2 µm fraction) and their relative contributions to total chlorophyll-a in the surface water of Cerrillos Reservoir. Bars represent standard error.
Picoplankton abundances
According to the size determinations and the predominant pigments analyzed by flow cytometry and epifluorescence microscopy, different populations of APP were identified in the Cerrillos Reservoir. These were composed of small prokaryotic and eukaryotic cells: one population of phycoerythrin-rich Pcy (Synechococcus) solitary coccoid, ovoid cells and two Peuk populations.
The Pcy cells, characterized by their high phycoerythrin content, were dominant APP during most of the year. The mean concentration of total Pcy in the photic zone was of 2 × 10⁴ cells/mL, with minimum values in February (0.6 × 10⁴ cells/mL) at Z1% during the mixing period. Higher concentrations were measured during the stratification period with maximum values in June (6.6 × 10⁴ cells/mL) at the surface (). The vertical profiles showed high abundance in the photic zone and a considerable decrease below the thermocline (). At Z0.01% (22 m), the Pcy abundance was the lowest (0.05–0.1 × 10⁴ cells/mL). The Pearson correlations between Pcy and environmental variables showed that the abundance was positively correlated with nitrate (r = 0.75, p < 0.001), TN (r = 0.82, p < 0.001), light availability (r = 0.65, p < 0.001) and chlorophyll-a (r = 0.70, p < 0.001).
Figure 4. Seasonal and vertical distributions of picocyanobacteria (cells/mL) in the Cerrillos Reservoir.
Figure 5. Vertical profiles of temperature (C), picocyanobacteria (Pcy, cells/mL) and picoeukaryotes (Peuk, cells/mL) during: (A) mixing (February) and (B) stratification (September) in Cerrillos Reservoir. Bars represent standard error.
The annual pattern of Peuk, characterized by their high chlorophyll-a, showed a less abundant and more uniformly distributed population than Pcy. The overall average abundance in the euphotic zone was of 1.2 × 10⁴ cells/mL, with maximum values of 2.1 × 10⁴ cells/mL in October at the surface, while the abundance decreased to a minimum of 0.3 × 10⁴ cells/mL in July at 1% of surface PAR (). No statistically significant differences were observed among depths within the euphotic zone (ANOVA p < 0.05). In contrast to Pcy, the Peuk density was positively related to light availability (r = 0.45, p < 0.001) and chlorophyll-a (r = 0.46, p < 0.001).
Figure 6. Seasonal and vertical distributions of picoeukaryotes (cells/mL) in the Cerrillos Reservoir.
Discussion
The Cerrillos Reservoir behaves as a warm monomictic system, with a mixing period during the cool dry season (November to February) and a stable stratification during most of the year (April to October). Similar stratification and mixing patterns in reservoirs of Puerto Rico were found by Pantoja-Agreda et al. (Citation2009) and Sotomayor et al. (Citation2008), as well as in other latitudes (Macek et al. Citation2009; Hernandez-Aviles et al. Citation2010). The high surface temperatures (>28 °C) and a long period of thermal stratification are features of Cerrillos Reservoir, allowing higher rates of decomposition in the hypolimnion and restricting the distribution of picoplankton and other aerobic organisms to the top 12 m surface layer. The depth (Zmax ≈ 65 m) and hydraulic residence time (0.87 times/year; Soler-Lopez Citation2011) that characterize this reservoir sustain a long and stable stratification during the summer, allowing for a better adaptation and development of APP. The formation of a stable thermocline during most of the year decreases nutrient transport to the epilimnion, and results in low hypolimnetic oxygen concentration and picoplankton abundance. The high temperatures, approaching 26 °C in the hypolimnion support high oxygen consumption creating anoxic conditions and subsequently high anaerobic microbial metabolism in deeper areas during most of the year.
Environmental and hydrological characteristics of the Cerrillos Reservoir are decisive for the composition and abundance of APP. The temporal and vertical dynamics of APP coincide with the period of circulation and stratification. Pcy abundance showed a unimodal seasonal cycle throughout the year, increasing exponentially in late May after the onset of stratification, and reached the largest number of organisms in the summer during the full stratification. The high peaks of abundance were mainly in June with higher densities than 6 × 10⁴ cell/mL. This unimodal pattern is different to that which occurs in most lakes in temperate zones, where the peaks of Pcy follow a typical bimodal pattern with high concentrations in spring or early summer and a second peak in the summer or fall (Stockner et al. Citation2000).
The increase in Pcy abundance during the stratification was possibly linked to the thermal structure of the lake, which affects the dynamics of Pcy in response to density gradients caused by the thermocline that prevents sedimentation of organisms to deeper layers (Callieri et al. Citation2012). According to Winder and Hunter (Citation2008), changes in the thermal stratifications processes affect the temporal and vertical dynamics of phytoplankton assemblages. The positive correlation between the abundance of Pcy and temperature (r = 0.40, p < 0.01) indicates that the increase in water temperature in summer promotes the growth of APP in the photic zone, and corroborates the results of other studies showing that the higher water temperatures during the stratification has a positive relationship with high concentrations of APP (Callieri & Piscia Citation2002; Crosbie et al. Citation2003; Horn & Horn Citation2008). The increase in picoplankton abundance in the epilimnion and its relationship with higher temperatures has been observed in other lakes and reservoirs, including Alchichica (Macek et al. Citation2009), Kinneret (Yacobi Citation2006) and Saidenbach (Horn & Horn Citation2008). The abundance of the Pcy in the period of stratification decreases significantly at depths below 0.1% PAR, possibly by the light conditions and the long period of anoxia that prevails most of the year below metalimnion. In the colder months, when the water temperature decreases, changes in the abundance coincide with the mixing period, resulting a decrease in the density of Pcy from December to March. The densities of Pcy have greater variations in the dry season, when mixing occurs in the water column. This breaking of the thermocline during the circulation period allows greater light penetration, being observed microcolonies of Pcy at depths of Z0.1%. According to CitationMoore et al. (1995), light limitation severely restricts the development of Synechococcus to deeper layers due to the absence of accessory pigments (e.g. Chl-b2).
The abundance of Peuk was lower than Pcy and with a temporal pattern different from the Pcy. Sarmento et al. (Citation2008) and Stenuite et al. (Citation2009) have found two orders of magnitude lower in Peuk density relation to Pcy in tropical lakes. In this study, the greatest abundances of Peuk were found in October and November at the end of stratification. In contrast, a study on Lake Tahoe showed that Peuk has opposite seasonal dynamics, the maximum abundance was during the mixed period in late winter and early spring (Winder Citation2009). In our study, during mixing, the Peuk density decreases, and its distribution in the water column was similar. Increased density of Peuk at the end of stratification and the beginning of the circulation period can be related to resuspension and nutrient availability from the hypolimnion toward the outer layers, regardless of loss in light penetration.
Other important factors that may be limiting the composition and abundance of APP are water transparency and light penetration. In the Cerrillos Reservoir, the highest concentration of APP was present in the photic zone (Z1% = 6.5 m), similar to other tropical marine ecosystems (Atlantic and Pacific) and freshwater bodies (Lake Tahoe); the picocyanobacteria of the genus Synechococcus dominates the surface layers and mostly above the thermocline (DuRand et al. Citation2001; Winder Citation2009). The vertical profiles indicate that growth of Peuk and Pcy is limited to shallower region of the epilimnion. This was observed in September, with peak concentrations at 25% PAR (depth, 2 m), and APP abundances decreased significantly at depths below 1% PAR. According to Passoni et al. (Citation1997; cited by Callieri & Stockner Citation2002), APP shows maximum abundance peaks between 25% and 50% PAR in large and deep lakes. The great adaptability of Pcy to different light regimes allows greater development in high light (Postius & Böger Citation1998). Pcy concentration during the summer in the superficial layers with higher solar radiation appears to be controlled by the light regime, which promotes higher density of phycoerythrin-rich species (i.e. Synechococcus spp.) that is more resistant to high-energy radiation than other picoplanktonic organisms such as Prochlorococcus spp. and Peuk (Sommaruga et al. Citation2005). The Pcy of tropical freshwater ecosystems are well adapted to high solar radiation in the surface (>1500 μE m/s). Stenuite et al. (Citation2009) observed that the Pcy numbers were high in the photic zone, and that these organisms are well suited to high light conditions that prevail throughout the year in Tanganyika, a tropical lake where phytoplankton may be exposed to irradiance above 2000 μE m/s at the surface level.
The biomass obtained by fractionated filtrations showed temporal and vertical dynamics in accordance with the distribution of APP. Two peaks were observed during the study period: the first, in full stratification (June), corresponding to maximum Pcy; and the second, at the end of the stratification and start of mixing (October to November), which coincides with the highest peak of the Peuk. Chlorophyll-a concentration in the water column also coincides with the vertical variation of picoplankton with depth. The highest concentration was found at the top of the photic zone, between 0 and 2 m depth. No Chl-a deep peaks were observed during the stratification period. Only once a Chl-a peak was observed: 1.18 μg/L at 12 m (Z0.01%). This observation coincided with the relaxation of the thermocline in the month of November during the onset of mixing. This deeper peak coincided with a pulse in Peuk density, which has been attributed to a decrease in solar irradiance and predation (Pilati & Wurtsbaugh Citation2003) and increased availability of nutrients from the bottom, which favors Peuk growth relative to that of Pcy (Callieri & Stockner Citation2002). In our study, APP contribution to the total phytoplankton biomass, expressed in terms of chlorophyll-a, was on average 11%. In summer, APP became responsible for up to 21% of photosynthetic activity, with values within the range from 0.2% to 43% reported for freshwater ecosystems (Stockner Citation1988). APP biomass showed a contrasting behavior with the fraction of phytoplankton (>2 μm). In May, APP chlorophyll (<2 μm fraction) increased exponentially and reached its maximum peak in June (1.99 μg/L), while Chl-a concentration in the larger fraction decreased. The opposite trend was observed in August and September, when a maximum concentration of Chl-a was observed for the fraction >2 μm and minimum concentrations for the APP. The increase in total chlorophyll was related to a bloom of Ulnaria ulna, a large diatom species that dominated phytoplankton communities at Cerrillos Reservoir during summer.
According to the Carlson trophic-state index, Cerrillos Reservoir was classified as in transition from oligotrophic to mesotrophic (Sotomayor et al. Citation2008). The high abundance of APP is associated with oligotrophic ecosystems (Stockner Citation1991) since higher surface-to-volume in Pcy and Peuk enables these species to compete advantageously for nutrients against larger phytoplankters, especially during low nutrient conditions (Raven Citation1998; Vörös et al. Citation1998; Drakare et al. Citation2003; Cellamare et al. Citation2010).
Pcy abundance and biomass were highest in summer and decreased gradually in winter, similar to the dynamics of TN, which reached its maximum concentration during full stratification. Both abundance and biomass of Pcy showed positive correlations with nitrate and TN concentrations. These correlations suggest that rain, run-off and river discharge patterns modulate changes in the development of APP populations. This ‘Nitrate trend’ was not observed for phosphate, as it was always undetected, suggesting that this form of phosphorus is precipitated rapidly and, thus may play a role in limiting phytoplankton growth in this system. Although TP was indeed detected, no covariation with APP was found suggesting that this form of phosphorus may not be rapidly cycled or it has limited importance for the production of APP (Horn & Horn Citation2008). Similarly, Callieri (Citation2010) and Lavallée and Pick (Citation2002) did not find correlative support for inorganic phosphorus stimulation of APP growth rates.
The dynamics of TN and nitrates similar to that of APP, the light penetration in the water column and thermal stratification are all important factors that limited the abundance and biomass of APP. Understanding the ecology of picoplankton and their response to environmental change, shows that it is a good indicator of the trophic state of reservoirs and may have important implications for the management of water quality, especially the potential use of reservoirs for drinking water.
Acknowledgments
We are grateful to the Department of Natural Resources group for access to the facilities and their help in field, and Jose Almodovar for microscopy laboratory assistance. We thank Dr Maribella Domenech for the introduction to and assistance with the flow cytometry. Thanks are due to Dr Ingrid Padilla and Perla Torres for their laboratory support and nutrients analysis, and to Dr Carlos Santos for his constructive comments to previous versions of this manuscript.
Disclosure statement
No potential conflict of interest was reported by the authors.
Additional information
Notes on contributors
Fernando Pantoja-Agreda
Fernando Pantoja-Agreda is a limnologist and aquatic ecologist with a special interest in bacterioplankton ecology, eutrophication and aquatic pollution. His training is in water quality, nutrients dynamics and anoxia in freshwater ecosystems. His current interests includes structure and function of lakes, reservoirs and rivers improve strategies for their management and protection.
Ernesto Otero-Morales
Dr. Ernesto Otero-Morales is a research scientist at the Department of Marine Sciences, University of Puerto Rico, Mayagüez Campus. At present he is the chairman of the department and his interests span biogeochemistry, water and sediment quality and microbial ecology. His current work is related to environmental compliance of energy generation industries. He has recently published work on water quality of coral reef systems and microbial source tracking and bioluminescence patterns in coastal environments.
References
- [APHA] American Public Health Association. 1998. Standard methods for the examination of water and wastewater. Washington (DC): American Public Health Association.
- Callieri C. 2007. Picophytoplankton in freshwater ecosystems: the importance of small sized phototrophs. Freshwater Rev. 1:1–28.
- Callieri C. 2010. Single cells and microcolonies of freshwater picocyanobacteria: a common ecology. J Limnol. 69:257–277.
- Callieri C, Caravati E, Corno G, Bertoni R. 2012. Picocyanobacterial community structure and space-time dynamics in the subalpine Lake Maggiore (N. Italy). J Limnol. 71:95–103.
- Callieri C, Corno G, Caravati E, Galafassi S, Bottinelli M, Bertoni R. 2007. Photosynthetic characteristics and diversity of freshwater Synechococcus at two depths during different mixing conditions in a deep oligotrophic lake. J Limnol. 66:81–89.
- Callieri C, Karjalainen SM, Passoni S. 2002. Grazing by ciliates and heterotrophic nanoflagellates on picocyanobacteria in Lago Maggiore, Italy. J Plankton Res. 24:785–796.
- Callieri C, Pinolini ML. 1995. Picoplankton in Lake Maggiore, Italy. Int Rev Hydrobiol. 80:491–501.
- Callieri C, Piscia R. 2002. Photosynthetic efficiency and seasonality of autotrophic picoplankton in Lago Maggiore after its recovery. Freshwater Biol. 47:941–956.
- Callieri C, Stockner JG. 2002. Freshwater autotrophic picoplankton: a review. J Limnol. 61:1–14.
- Caron DA, Pick FR, Lean DRS. 1985. Chroococcoid cyanobacteria in Lake Ontario: seasonal and vertical distribution during 1982. J Phycol. 21:171–175.
- Cellamare M, Rolland A, Jacquet S. 2010. Flow cytometry sorting of freshwater phytoplankton. J Appl Phycol. 22:87–100.
- Cotner JB, Biddanda BA. 2002. Small players, large role, microbial influence on biogeochemical processes in pelagic aquatic ecosystems. Ecosystems. 5:105–121.
- Crosbie ND, Teubner K, Weisse T. 2003. Flow cytometric mapping provides novel insights into the seasonal and vertical distributions of freshwater autotrophic picoplankton. Aquat Microb Ecol. 33:53–66.
- Diaz M, Pedrozo F, Reynolds C, Temporetti P. 2007. Chemical composition and the nitrogen-regulated trophic state of Patagonian lakes. Limnologica. 37:17–27.
- Dove A, Chapra SC. 2015. Long-term trends of nutrients and trophic response variables for the Great Lakes. Limnol Oceanogr. 60:696–721.
- Drakare S, Blomqvist P, Bergström AK, Jansson M. 2003. Relationships between picophytoplankton and environmental variables in lakes along a gradient of water colour and nutrient content. Freshwater Biol. 48:729–740.
- DuRand MD, Olson RJ, Chisholm SW. 2001. Phytoplankton population dynamics at the Bermuda Atlantic Time-series station in the Sargasso Sea. Deep-Sea Res. 48:1983–2003.
- Dzialowski AR, Wang SH, Lim NC, Spotts WW, Huggins DG. 2005. Nutrient limitation of phytoplankton growth in central plains reservoirs, USA. J Plankton Res. 27:587–595.
- Golden Software. 2012. Surfer, Version 12.0. Colorado: Golden; pp. 120.
- Hernández-Avilés JS, Macek M, Alcocer J, López-Trejo B, Merino-Ibarra M. 2010. Prokaryotic picoplankton dynamics in a warm-monomictic saline lake: temporal and spatial variation in structure and composition. J Plankton Res. 32:1301–1314.
- Horn H, Horn W. 2008. Bottom-up or top-down – how is the autotrophic picoplankton mainly controlled? Results of long term investigations from two drinking water reservoirs of different trophic state. Limnologica. 38:302–312.
- Ivanikova NV, Popels LC, McKay RML, Bullerjahn GS. 2007. Lake Superior supports novel clusters of cyanobacterial picoplankton. Appl Environ Microbiol. 73:4055–4065.
- Kirk JTO. 1994. Light and photosynthesis in aquatic ecosystems. Cambridge, United Kingdom: Cambridge University Press; p. 509.
- Lavallée BF, Pick FR. 2002. Picocyanobacteria abundance in relation to growth and loss rates in oligotrophic to mesotrophic lakes. Aquat Microb Ecol. 27:37–46.
- Lewis WM Jr. 2000. Basis for the protection and management of tropical lakes. Lakes Reserv Res Manage. 5:35–48.
- Lewis WM Jr. 2002. Causes for the high frequency of nitrogen limitation in tropical lakes. Verh Int Ver Limnol. 28:210–213.
- Macek M, Alcocer J, Lugo-Vázquez A, Martínez-Pérez ME, Peralta-Soriano L, Vilaclara-Fatjó G. 2009. Long term picoplankton dynamics in a warm-monomictic, tropical high altitude lake. J Limnol. 68:183–192.
- Moore LR, Goericke R, Chisholm SW. 1995. Comparative physiology of Synechococcus and Prochlorococcus: influence of light and temperature on growth, pigments, fluorescence and absorptive properties. Mar Ecol Prog Ser. 116:259–275.
- Nagata T, Takai K, Kawanobe K, Kim D-S, Nakazato R, Guselnikova N, Bondarenko N, Mologawaya O, Kostrnova T, Drucker V, et al. 1994. Autotrophic picoplankton in southern Lake Baikal: abundance growth and grazing mortality during summer. J Plankton Res. 16:945–959.
- Nusch EA. 1980. Comparison of different methods for chlorophyll and phaeopigments determination. Arch Hydrobiol Beih Ergebn Limnol. 14:14–36.
- Pantoja-Agreda F, Sotomayor D, Martínez G. 2009. Phytoplankton dynamics of de Guajataca Reservoir. Verh Int Ver Limnol. 30:1096–1100. Part 7.
- Passoni S, Callieri C, Heinimaa S. 1997. Dinamiche di distribuzione del picoplancton autotrofo nel Lago Maggiore [Distribution dynamics of autotrophic picoplankton in Lake Maggiore]. In: Callieri, Stockner. 2 002.
- Pick FR. 1991. The abundance and composition of freshwater picocyanobacteria in relation to light penetration. Limnol Oceanogr. 36:1457–1462.
- Pilati A, Wurtsbaugh WA. 2003. Importance of zooplankton for the persistence of a deep chlorophyll layer: a limnocorral experiment. Limnol Oceanogr. 48:249–260.
- Postius C, Böger P. 1998. Different interactions of phycoerythrin-rich and phycocyanin-rich Synechococcus spp. with diazotrophic bacteria from the picoplankton of Lake Constance. Arch Hydrobiol. 141:181–194.
- Postius C, Ernst A. 1999. Mechanism of dominance: coexistence of picocyanobacterial genotypes in a freshwater ecosystem. Arch Microbiol. 172:69–75.
- Raven JA. 1998. The twelfth Tansley Lecture. Small is beautiful: the picophytoplankton. Funct Ecol. 12:503–513.
- Sarmento H, Unrein F, Isubmisho M, Stenuite S, Gasol J, Descy JP. 2008. Abundance and distribution of picoplankton in tropical oligotrophic Lake Kivu, eastern Africa. Freshwater Biol. 53:756–771.
- Schindler DW. 2006. Recent advances in the understanding and management of eutrophication. Limnol Oceanogr. 51:356–363.
- Smith VH. 2006. Responses of estuarine and coastal marine phytoplankton to nitrogen and phosphorus enrichment. Limnol Oceanogr. 51:377–384.
- Soler-Lopez LR. 2011. Sedimentation survey of Lago Cerrillos, Ponce (Puerto Rico): April–May 2008. U.S. Geological Survey. Scientific Investigations Report 2011–5057.
- Sommaruga R, Hofer JS, Alonso-Saez L, Gasol JM. 2005. Differential sunlight sensitivity of picophytoplankton from surface Mediterranean coastal waters. Appl Environ Microbiol. 71:2154–2157.
- Sotomayor D, Martínez G, Pantoja F. 2008. Limnological assessment of two reservoirs in Puerto Rico. Verh Int Ver Limnol. 30:521–527. Part 3.
- Stenuite S, Tarbe AL, Sarmento H, Unrein F, Pirlot S, Sinyinza D, Thill S, Lecomte M, Leporcq B, Gasol JM, Descy J-P. 2009. Photosynthetic picoplankton in Lake Tanganyika: biomass distribution patterns with depth, season and basin. J Plankton Res. 31:1531–1544.
- Stockner JG. 1988. Phototrophic picoplankton: an overview from marine and freshwater ecosystems. Limnol Oceanogr. 33:765–775.
- Stockner JG. 1991. Autotrophic picoplankton in freshwater ecosystems: the view from the summit. Int Rev Hydrobiol. 76:483–492.
- Stockner J, Callieri C, Cronberg G. 2000. Picoplankton and other non-bloom forming cyanobacteria in lakes. In: Whitton BA, Potts M, editors. The ecology of cyanobacteria. Their diversity in time and space. Dordrecht: Kluwer Academic Publishers; p. 195–238.
- Valderrama JC. 1981. The simultaneous analysis of total nitrogen and total phosphorus in natural waters. Mar Chem. 10:109–122.
- Vörös L, Callieri C, Balogh KV, Bertoni R. 1998. Freshwater picocyanobacteria along a trophic gradient and light quality range. Hydrobiologia. 369:117–125.
- Waterbury J, Watson W, Valois FW, Franks DG. 1986. Biological and ecological characterization of the marine unicellular cyanobacterium Synechococcus. Can Bull Fish Aquat Sci. 214:71–120.
- Winder M. 2009. Photosynthetic picoplankton dynamics in Lake Tahoe: temporal and spatial niche partitioning among prokaryotic and eukaryotic cells. J Plankton Res. 31:1307–1320.
- Winder M, Hunter DA. 2008. Temporal organization of phytoplankton communities linked to chemical and physical forcing. Oecologia. 156:179–192.
- Worden A. 2004. Assessing the dynamics and ecology of marine picophytoplankton: the importance of the eukaryotic component. Limnol Oceanogr. 49:168–179.
- Yacobi YZ. 2006. Temporal and vertical variation of chlorophyll a concentration, phytoplankton photosynthetic activity and light attenuation in Lake Kinneret: possibilities and limitations for simulation by remote-sensing. J Plankton Res. 28:725–736.