
ABSTRACT
In this study, we investigated the effect of herbaceous planting richness on the physicochemical parameters of water temperature, pH, and dissolved oxygen in created wetlands. Mesocosms were planted with common wetland plants along a gradient from zero species to four species and observed over three growing seasons. Aboveground biomass was harvested after the second growing season to simulate disturbance. Planting richness was not found to directly influence any of the parameters. Instead, it seems that algae were more influential on observed changes to pH or dissolved oxygen than the macrophyte. Traditionally, monitoring of mitigation wetlands focuses on growth of macrophytes (e.g. cover percentage) and eschews the importance of the algal community in water quality function. Our results suggest that inclusion of simple, low-cost measures of water physicochemical parameters in mitigation site performance monitoring may contribute to a better assessment of ecosystem function development in newly created mitigation wetlands. Further study is necessary to quantitatively assess the relationship, if any, between the physicochemical parameters of water quality and nutrient retention performance that is rarely evaluated in mitigation wetlands.
Introduction
Water quality improvement is one of the well-known ecosystem service functions provided by natural wetlands (Verhoeven et al. Citation2006; Mitsch & Gosselink Citation2007). Robust plant communities play a major role in water quality improvement in wetlands as they physically trap sediments and assimilate pollutants such as nitrogen and phosphorus in biomass (Mitsch & Gosselink Citation2007). Bacteria in wetland soils also contribute to water quality improvement through the processes of ammonification, nitrification, and denitrification (Knowles Citation1982; Reddy et al. Citation1989, Mitsch and Gosselink Citation2007). Although the water quality function of natural wetlands is widely recognized as a valuable ecosystem service, development often involves destruction of natural wetlands. As part of the Clean Water Act's goal to achieve ‘no net loss’ of wetlands, compensatory replacement of natural wetlands is required under Section 404 of the Clean Water Act. As a result, mitigation wetlands are created to replace natural wetlands lost or destroyed in the course of development in an effort to recoup the lost ecosystem services. Development of comparable water quality function in created mitigation wetlands, however, is unpredictable and rarely studied (Zedler & Callaway Citation1999; Ahn Citation2010; Dee & Ahn Citation2014). Plant community development has typically been used as a measure of success in created mitigation wetlands though it may not fully measure ecological functions that should be present in created mitigation wetlands to provide expected ecosystem services (NRC Citation2001; Spieles Citation2005). Furthermore, with increasing interest in the value of wetlands for ecosystem credit stacking – a practice wherein developers purchase credits for multiple ecosystem services (e.g. carbon sequestration, wetland mitigation, and water quality improvement) from a single restoration site – it is important to determine the extent of the ecosystem services provided by a restoration site (Robertson et al. Citation2014).
Vegetation community may influence the maturation of biogeochemical functions in wetlands such as primary productivity, soil development, and nutrient accumulation that are closely associated with the development of water quality function (Dee & Ahn Citation2014). In created wetlands, vegetation often displays lower species richness, less cover, higher occurrence of non-native or invasive species, and fewer obligate wetland species than that of natural wetlands (Spieles Citation2005). Planting and early vegetation establishment may have significant effects on the full development of mature vegetation community in created mitigation wetlands, yet little is known about the effects of planting scheme/design or active vegetation management post-construction (Atkinson et al. Citation2005; Spieles Citation2005). Moreover, failures of created wetlands have often been attributed to the lack of functional ecosystem development (Spieles Citation2005, Hossler et al. Citation2011). Still, there are no exemplary design guidelines for wetland creation that guarantee the development of the desired ecological functions. It is worth considering, then, that certain features of natural wetlands could be incorporated into mitigation wetland design in an attempt to more fully mimic the structure that supports beneficial functions often observed in natural wetlands.
Planting is a common practice in wetland creation for mitigation projects. One feature of natural wetlands that has not been incorporated into created and restored wetlands is plant diversity or planting richness. Mitigation policy does not currently encourage any consideration for planting diversity which can result in the replacement of naturally diverse habitats with monotypic wetlands, often colonized by an undesirable species (e.g. cattails). On the other hand, Mitsch et al. (Citation2012) found that initial planting regime had little effect on long-term community richness after planted and unplanted created wetlands reached comparable species richness during a 15-year study. Still, diversity and richness of herbaceous wetland plant communities play an important role in the development and stability of the wetland ecosystem functions (Bouchard et al. Citation2007). Besides providing essential habitat for a wide range of species, a diverse vegetative community enhances nutrient cycling (Moser et al. Citation2009), increases productivity and carbon storage potential (Williams & Ahn Citation2015, Means et al. Citation2016), and can inhibit the spread of invasive species (Beck et al. Citation2015). In a similar mesocosm experiment, however, Fraser et al. (Citation2004) found that while four-species mixtures were highly effective at removal of nitrogen and phosphorus, the removal rates were not significantly higher than that observed in monocultures. Still, the effect of planting richness with regards to herbaceous wetland plants has rarely been studied for its relevance in the development of water quality function in created mitigation wetlands.
This study attempted to compare the water physicochemical parameters of temperature, dissolved oxygen (DO), and pH across a planting richness gradient over three growing seasons in created wetlands using a set of outdoor mesocosms. Observation of these fundamental water physicochemical parameters can indicate the rate of aquatic productivity which is often associated with water quality function in wetlands. Specific questions of the study are as follows: (1) does planting richness have an effect on water physicochemical parameters? (2) Can a suite of low-cost, simple-to-measure water physicochemical parameters inform or augment the monitoring process for functional development?
Methods
Experimental mesocosm design and planting setup
This study took place at the Ahn Wetland Mesocosm Compound located on the Fairfax Campus of George Mason University near Washington, DC. The experiment employed a set of 40 research mesocosms made from agricultural-grade, 568 L Rubbermaid® tubs with surface area of 1.11 m2. Mesocosms were bottom filled with 20 cm layers each of river pea gravel and sand, then topped with 30 cm of locally produced, screened, silty-loam topsoil (1.5% total carbon and 0.11% total nitrogen composition) from the Stone Center in Manassas, VA, USA. This setup mimics the way mitigation wetlands are created in the Piedmont region of Virginia which our study team has been monitoring for the past several years (see Dee & Ahn Citation2012). Retention of or amendments with topsoil are common practices in wetland creation in the Virginia Piedmont physiographic region and are implemented to augment soil nutrient pools which are often limiting in these created wetlands.
Water levels in the mesocosms were mostly maintained by precipitation events, but were also periodically supplemented with dechlorinated tap water in the hottest weeks of summer to ensure water depth was similar in all mesocosms. Although we attempted to maintain a minimum of 5 cm of water in each mesocosm, evaporation and uptake by plants occasionally depleted the standing water in a small subset of the mesocosms and prevented the recording of water quality measurements. As a result, water levels in the mesocosms ranged from 0 to 20 cm with an average depth of 5.04 ± 1.95 cm.
In early May 2012, mesocosms were planted with four plugs in a linear array using a combination of four herbaceous wetland plant species: Eleocharis obtusa (Willd.) Shult., Mimulus ringens L., Juncus effusus L., and Carex vulpinoidea Michx (). The planting density was chosen to be representative of planting schemes used for restoration and encourage maximum growth of species in the ∼1 m2 mesocosms (Ahn & Mitsch Citation2002). All plugs were of similar size at the start of the experiment. Each of the four species was assigned two monocultures such that 8 mesocosms contained a single species (PR 1); 6 mesocosms were planted with unique two-species combinations (PR 2); 12 mesocosms were planted with unique three-species combinations (PR 3); lastly, 8 mesocosms were planted with all four species to represent the highest richness level (PR 4). Six mesocosms were left unplanted (PR 0) to serve as a control against the planted mesocosms. The experimental planting richness gradient was maintained through periodic weeding to remove volunteer species.
Figure 1. Wetland mesocosms for the study containing four wetland species native to and commonly planted in created/restored wetlands in Virginia.
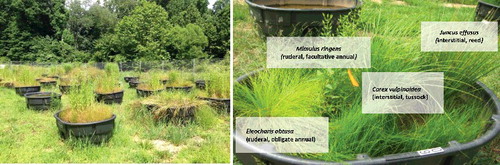
The freshwater herbaceous wetland plant species that were employed were selected because they are commonly found in or used to seed created mitigation wetlands in the Virginia Piedmont and because they are classifiable within either a ruderal or interstitial functional group. Both ruderal species, Mimulus and Eleocharis, flowered in the first growing season before aboveground growth senesced in the winter thereby demonstrating behavior consistent with annuals. Reeds and tussocks are classified as interstitial perennials, a group distinguished by clumped growth and moderate lateral spread as well as meager flowering in the first year (Boutin & Keddy Citation1993). Both J. effusus and C. vulpinoidea first flowered at the start of the second growing season. Carex vulpinoidea, fox sedge, was not part of Boutin and Keddy's (Citation1993) 43 species classification but displays morphological and phenological traits consistent with tussocks.
After the second growing season, aboveground biomass was harvested from all mesocosms as part of a concurrent study investigating the relationship between planting richness and community productivity (Korol & Ahn Citation2016). While it is an uncommon practice, harvesting in artificial wetlands has been studied as a means of permanently removing target pollutants assimilated in aboveground biomass (Cicek Citation2006; Vymazal et al. Citation2010). Natural “harvest” of aboveground biomass has also been observed in artificial wetlands as a result of muskrat herbivory (Kadlec et al. Citation2007; Mitsch et al. Citation2012). We incorporated this harvest in our study as a “disturbance” to the mesocosm plant communities. Recovery of the mesocosms was then monitored over the two following growing seasons (2014 and 2015). In this way, a chronology of growing seasons was developed: initial growth (Yr1), full growth (Yr2), disturbance, initial recovery (Yr3), and full recovery (Yr4). Total cover including overhang (see Ahn & Mitsch Citation2002) was determined for each mesocosm for peak biomass during each growing season (see Means Citation2015; Korol & Ahn Citation2016) with an adjustment of the coverage of macrophytes over the mesocosms surface area of 1.11 m2.
Water temperature and pH were then monitored during the peak of each growing season (late summer) with the addition of DO during Yr3 and Yr4. Diurnal measurements (approximately 7 am and 5 pm) were recorded to capture the effects of daily primary productivity and nightly respiration. A Hydrolab H20G Multi-parameter Water Quality Data Probe was used to measure temperature (T) and pH for 27 days (24 consecutive days) between 14 August 2012 and 12 September 2012 (Yr1). In Yr3, measurements were recorded for 14 days (3 consecutive) between 7 July 2014 and 7 August 2014, while in Yr4, measurements were taken over a period of 6 days (4 consecutive) between 16 August 2015 and 28 August 2015. During Yr 3 and Yr4, a YSI 600XL mutli-parameter sonde was used to measure temperature, pH, and DO. Insufficient measurements were recorded during Year 2 (2013) and have not been included in this analysis; however, we are confident that the included measurements covering three years provide sufficient evidence to address our study question. Total precipitation during the measurement period in Yr1, Yr3, and Yr4 was 51, 42, and 19 mm, respectively. Similarly, mean air temperature was 23.8 °C in Yr1, 23.3 °C in Yr3, and 23.5 °C in Yr4 (Weather Underground Citation2016).
To record water physicochemical measurements, the sonde was lowered into the water until the sensory probes sat approximately halfway between the surface and the substrate. Care was taken to limit disturbance of the sediment. Once immersed, the sonde was held stationary for 60–90 seconds to allow readings to stabilize before measurements were recorded. After each measurement, the probes of the sonde were washed with deionized water. To minimize the effect of rainwater on physicochemical parameters, we waited 24–48 hours after storm events before sampling. The instruments used for water measurements were calibrated weekly according to manufacturer's guidelines. The dissolved oxygen probe was calibrated based on local barometric pressure while the pH probe was calibrated using two-point calibration with pH 7.00 and pH 10.00 standards as is recommended when anticipated pH readings fall in the same range.
Data analysis
Mean values for temperature, pH, and DO were calculated by averaging morning and evening measurements for each day. For pH and temperature, daily and nightly flux values were calculated. Daytime flux was calculated by subtracting the morning (Mday) measurement from the evening (Eday) measurement (∆day = Eday − Mday). For consecutive daily measurements, nightly flux values for each parameter were calculated by subtracting the evening measurement of the current day from the morning (Mday+1) measurement of the following day (∆night = Mday+1 − Eday). Net daily flux of pH and temperature was calculated by summation of daily and nightly flux values (∆net = ∆day + ∆night).
For DO, we estimated net primary productivity based on Odum's (Citation1956) formula for aquatic metabolism:where NPP is the net primary productivity; GPP is the gross primary productivity; R is respiration; F is atmospheric oxygen exchange; and A is all other factors influencing DO concentration.
Atmospheric oxygen exchange, F, is assumed to be negligible because the lack of flowing water, small surface area, and high walls of the mesocosms (>15 cm above water line) prevents mixing of the water (Cronk & Mitsch Citation1994; Marois et al. Citation2015). Similarly, both Odum (Citation1956) and Staehr et al. (Citation2010) suggest that the remaining factors affecting DO concentration (A) do not significantly contribute to changes in DO concentration.
R was calculated as the nightly change in DO. As photosynthesis only occurs, and influences, DO during the day it was assumed that R does not differ significantly between night and day (Staehr et al. Citation2010). NPP was calculated as the daytime flux in DO which represents the competing processes of GPP and R. GPP was then calculated as follows:
Differences in water physicochemical parameters between years and between planting richness levels were determined by analysis of variance testing followed by Tukey's Honestly Significant Difference post hoc analysis. Welch's T-Test was employed to determine differences in physicochemical properties between the unplanted and planted mesocosm groups. The aforementioned statistical tests were performed with R statistical programming (R Core Team Citation2015) at α = 0.05.
Results and discussion
Total cover
During Yr1, the mesocosms containing the greatest planting richness (PR4) exhibited significantly higher total cover when compared with the monoculture mesocosms (). In all other years, however, no difference in cover was observed between the lowest and highest richness treatments. In the monoculture mesocosms, total cover remained below 100% in all years with no difference between years (p > 0.05; ). In the polycultures (PR2–PR4), Yr1 and Yr2 exhibited similar levels of cover that were significantly higher than Yr3 and Yr4 (p < 0.05). In Yr3 and Yr4, total cover did not exceed 100% at all levels of planting richness and did not differ between year or richness level. Furthermore, total cover was significantly lower in the polyculture mesocosms during Yr3 and Yr4 compared to Yr1 and Yr2 with the exception of PR2 in Yr1.
Figure 2. Total cover (%) in the planted mesocosms at each planting richness level for Years 1, 2, 3, and 4. Error bars represent ±1 standard error, while letters indicate significant difference; columns that do not share a letter differ significantly at P < 0.05 (Tukey's Honestly Significant Difference).
Vigorous growth during Yr1 and Yr2 led to total cover that exceeded 100% in the polyculture mesocosms while growth appeared stifled following the harvest at the end of the second growing season. Shading of the water column, therefore, can be assumed to be greatest in the predisturbance period as plant cover generally extended beyond the boundaries of the mesocosms. During the recovery period following Yr2, the water column was generally more exposed as total cover peaked at 84.5% and 62.6% during Yr3 and Yr4, respectively.
Water temperature
Mean daytime water temperature was the highest in Yr3 in both planted (Yr1 = 23.03 °C; Yr3 = 25.46 °C; Yr4 = 23.53 °C) and unplanted (Yr1 = 23.25 °C; Yr3 = 26.14 °C; Yr4 = 24.99 °C) mesocosms, while unplanted mesocosms were significantly warmer than planted mesocosms in Years 3 and 4 (). No difference in water temperature was observed, however, between richness levels (p > 0.05) within each year ((a)). Flux in daytime temperature was lowest in Yr1 with a significant difference (p < 0.05) between the planted (5.38 °C/day) and unplanted (7.05 °C/day) mesocosms (). No difference in flux was observed between Yr3 and Yr4 both across the richness gradient and between years (p > 0.05; (b)). Similar patterns were observed in nighttime temperature mean values and fluxes (unpublished data). When daytime and nighttime values were combined to determine net temperature flux, however, no differences (p > 0.05) were observed between years or planting richness level ((c)).
Table 1. Mean and daily flux values for temperature and pH ± standard error (S.E.) in unplanted and planted mesocosm groups in Years 1, 3, and 4.
Figure 3. Water temperature measurements in the wetland mesocosms: (a) mean daytime temperature, (b) daytime temperature flux, and (c) net flux in temperature at each planting richness level for Years 1, 3, and 4. Mean temperature was calculated as the average of morning and evening measurements from a single day. Daytime flux was determined by calculating the difference between evening and morning temperatures. Net flux was calculated as the net change in temperature from one morning to the following morning. Error bars represent ±1 standard error while letters indicate significant difference. Columns that do not share a letter differ significantly at P < 0.05 (Tukey's Honestly Significant Difference).
Biological processes are often influenced by environmental temperature as the underlying chemical reactions are often rate-limited by temperature (Arrhenius equation/Van't Hoff equation; Laidler Citation1984). Temperature can, therefore, potentially limit the rate at which photosynthesis and respiration can occur within the water column (Thornton & Lessem Citation1978; Wetzel Citation2001). Wetzel (Citation2001), however, suggests that aquatic photosynthetic activity is limited more by light intensity than temperature. In our study, the mean water temperature in all mesocosms fell within the optimum temperature range for aquatic photosynthesis of 20–30 °C which suggests that light intensity likely played a more influential role in mesocosm productivity (Raven & Geider Citation1988). The rate of denitrification is also temperature dependent. In created wetlands, Song et al. (Citation2014) observed significantly increased denitrification when water temperatures exceeded 20 °C in created wetlands.
While direct absorption of solar radiation governs water temperature in large water bodies such as lakes (Wetzel Citation2001), mesocosm water temperature was likely more strongly influenced by heat conducted through the black plastic of the aboveground mesocosm tubs themselves. This is supported by the observation water temperature did not differ between the unplanted and planted mesocosms in each year. If solar radiation directly influenced water temperature, the planted mesocosms would likely exhibit lower water temperature due to shading of the water column by plant cover.
pH
Mean pH was significantly higher (p < 0.05) in the unplanted mesocosms in all years (Yr1 = 7.37, Yr3 = 8.38, Yr4 = 8.33) relative to the planted mesocosms (Yr1 = 6.92, Yr3 = 7.40, Yr4 = 7.49; ). While Yr1 exhibited the lowest pH at all richness levels, no difference was observed between Years 3 and 4 ((a)). Daytime flux in pH was highest during Yr3 and did not differ along the richness gradient ((b)). In the unplanted mesocosms, flux in Years 3 and 4 did not differ, however, significantly lower flux was observed in Yr1 ((b)). While Yr1 and Yr4 exhibited substantially lower flux than Yr3 in the planted mesocosms, they did not differ meaningfully ((b)). Nighttime flux followed a nearly identical pattern to daytime flux (unpublished data). Net flux in pH did not differ along the richness gradient nor between years ((c)).
Figure 4. pH measurements in the wetland mesocosms: (a) mean daytime pH, (b) daytime pH flux, and (c) net flux in pH at each planting richness level for each year. Mean pH was calculated as the average of morning and evening measurements from a single day. Daytime flux was determined by calculating the difference between evening and morning pH values. Net flux was calculated as the net change in pH from one morning to the following morning. Error bars represent ±1 standard error while letters indicate significant difference. Columns that do not share a letter differ significantly at P < 0.05 (Tukey's Honestly Significant Difference).
When dissolved in water, carbon dioxide hydrates to form carbonic acid (H2CO3). A buffering reaction takes place in which bicarbonate (HCO3−) and carbonate (CO3=) exist in equilibrium through loss or gain of a hydrogen ion (H+):
As more carbon dioxide dissolves into water, more hydrogen ions are released resulting in a decrease in pH and vice versa. In active aquatic systems, for example, the carbonate/bicarbonate equilibrium, and thus, pH, can be greatly influenced by photosynthesis and respiration as these processes result in the production and consumption of carbon dioxide (DeBusk et al. Citation2004). In Yr1, total cover was lowest in the monoculture mesocosms and highest in the PR4 mesocosms, while pH was highest in the monoculture mesocosms and lowest in the PR4 mesocosms. This provides some evidence that shading of the water column in the first year may have an impact on water pH by limiting aquatic productivity; however, this evidence is far from conclusive. Regardless, the relationship between aquatic productivity and pH is important to consider in the context of nutrient removal as increased aquatic pH, can encourage the coprecipitation of calcium and phosphorus (Marois et al. Citation2015). Furthermore, Fulweiler et al. (Citation2011) found that nitrification is influenced by pH and occurred most efficiently between pH 7.0 and 8.3. Mean pH in the mesocosms generally fell within this range; however, pH varied with time of day and, therefore, may be an unreliable indicator for nitrification activity. Aquatic photosynthesis and respiration, then, can influence nutrient transformation in wetlands through changes in pH.
Photosynthetic activity of the emergent herbaceous macrophytes likely had little direct impact on aquatic carbon dioxide concentrations as only a small portion of the aboveground growth was contained within the water column. The planted mesocosms did, however, exhibit consistently lower mean pH which suggests that root exudation of carbon dioxide was occurring and influencing aquatic pH (Bedford Citation1991). Macrophyte growth may also indirectly influence aquatic pH as submerged biomass, detritus, and exposed roots provide surfaces for the growth of periphyton as well as bacteria which play a role in both aquatic productivity and nutrient cycling (Fraser et al. Citation2004). While carbon dioxide concentration is but one of many factors influencing aquatic pH, the controlled nature of the mesocosm setup suggests that plant growth played a large role in pH regulation in our experiment.
Dissolved oxygen
Mean daily DO levels were highest in the unplanted mesocosms (Unplanted: Yr3 = 8.62 mg/L, Yr4 = 9.26 mg/L; Planted: Yr3 = 7.26 mg/L, Yr4 = 5.11 mg/L) and did not differ between Yrs3 and 4 (P > 0.05; ). In the planted mesocosms, mean oxygen concentration showed no change across the planting richness gradient, but, overall, DO was significantly higher in Yr3 (P < 0.05; (a)). Gross primary production (GPP) and respiration (R) were higher in the unplanted mesocosms, but no difference in GPP or R was observed with increasing species richness ((b,c)). In addition, GPP and R were generally higher in Yr3 with the exception of the unplanted mesocosms which did not differ between years ((b,c)). When GPP and R were combined to determine net primary production (NPP), however, no significant difference was observed between years or over the planting richness gradient (P > 0.05; (d)).
Table 2. Mean daily dissolved oxygen (mg O2 L−1), gross primary production (GPP, mg O2 L−1 day−1), respiration (R, mg O2 L−1 day−1), and net primary productivity (NPP, mg O2 L−1 day−1) in unplanted and planted mesocosms in Years 3 and 4. In the results for the planted mesocosms, groups that share a letter differ significantly at P = 0.05.
Figure 5. Dissolved oxygen content and flux in the wetland mesocosms: (a) mean daytime dissolved oxygen content, (b) gross primary production, (c) respiration, and (d) net primary production of dissolved oxygen in each planting richness group during Yr3 and Yr4. Mean dissolved oxygen content was determined as the average of morning and evening measurements from a single day. Gross primary production represents the increase in dissolved oxygen from morning to evening, while respiration represents the decrease in oxygen from evening to morning. Net primary productivity was calculated as the net change in dissolved oxygen from one morning to the following morning. Error bars represent ±1 standard error while letters indicate significant difference. Columns that do not share a letter differ significantly at P < 0.05 (Welch's T-Test).
Aquatic productivity is mostly attributed to algae rather than macrophytes as the photosynthetically active portions of the macrophytes grow, and transpire gases, above the waterline (Marois et al. Citation2015). Although a thorough assessment of abundance was not undertaken in this study, algae were observed in both planted and unplanted mesocosms. Mean dissolved oxygen and GPP were significantly higher in the unplanted mesocosms during both Yr3 and Yr4 indicating that water column productivity may have been limited by access to sunlight rather than temperature or pH. Lower mean DO, GPP, and R in Yr4 would suggest that less sunlight was reaching the water. Total cover in the planted mesocosms, however, did not differ between Yr3 and Yr4 nor along the planting richness gradient indicating that a similar amount of sunlight was reaching the water column in both years. It is possible that algal populations got a head start early in Yr3 as plant cover rebounded from disturbance and persisted until the first frost resulting in relatively higher aquatic productivity later in the growing season when compared with Yr4. The mesocosms were left undisturbed between Yr3 and Yr4, resulting in higher total cover at the beginning of Yr4 which potentially limited development of the algal community and, by extension, aquatic productivity. In addition, lower water temperature in Yr4 may have also checked the growth rate of algae resulting in lower DO; however, Butterwick et al. (Citation2005) found that growth rates for several species of freshwater phytoplankton did not differ greatly between 15 and 30 °C. The higher mean DO, GPP, and positive NPP observed in Yr3 relative to Yr4 follow the pattern described by Odum (Citation1969) wherein immature or, in our case, recovering, ecosystems are more productive than mature, established systems.
Implications of the findings for water quality functions of wetlands
Elevated levels of aquatic productivity observed in Yr3, possibly as a result of post-disturbance recovery of total plant cover as well as relatively warm water temperatures, may indicate higher levels of nutrient retention are occurring in the mesocosms during this period (DeBusk et al. Citation2004). Water temperature ranged from 13 to 31 °C which falls within the optimum range for both nitrification (5–30 °C) and denitrification (>20 °C) (Shammas et al. Citation1986; Song et al. Citation2014). Similarly, temperature range observed in the mesocosms (13–31 °C) during this study were within the optimum range for removal of phosphorus (Picard et al. Citation2005). The observed temperatures may encourage phosphorus-consuming metabolic activity as well as the precipitation of phosphorus (Werker et al. Citation2002; DeBusk et al. Citation2004; Picard et al. Citation2005) although Kadlec and Reddy (Citation2001) did not observe a relationship between temperature and phosphorus precipitation. Kadlec and Reddy (Citation2001) did, however, observe that abiotic nitrogen capture was found to increase with temperature.
Mean and daytime flux in pH generally followed similar trends to DO – especially in the unplanted mesocosms – which supports the relationship between aquatic metabolic activity and pH. In Yr1, both plants and algae were only beginning to colonize the mesocosms which is reflected in the circumneutral mean pH and low pH flux. Unfortunately, the sonde used in Yr1 was incapable of measuring DO and we were, therefore, unable to estimate aquatic production and respiration levels to verify whether the observed patterns in pH were attributable to productivity. High GPP and pH flux observed in Yr3 relative to Yr4 does, however, indicate that macrophyte cover may influence algal communities and aquatic productivity as standing biomass leftover after Yr3 shaded the water column from the outset of the growing season in Yr4.
While focus on plant richness often overlooks the significance of algal productivity, Engelhardt and Ritchie (Citation2001) found that algal biomass was higher in mesocosms with more diverse communities of submerged aquatic vegetation which allowed for greater niche space in the aquatic environment. Plant biomass production also often overshadows assessment of algal productivity as plant growth is more visually apparent despite submerged aquatic vegetation, phytoplankton, and epiphytic algae contributing up to 80% of net primary productivity and 17%–67% of aboveground carbon production in wetlands (Cronk & Mitsch Citation1994). Emergent macrophytes also contribute to nitrogen and phosphorus removal through uptake; however, these nutrients are typically returned to the environment with senescence (Lin et al. Citation2002; Tanner & Headley Citation2011). In wetlands with robust plant communities, however, dense plant growth can limit aquatic GPP and result in low oxygen availability (Hagerthey et al. Citation2010). It is possible, then, that dense macrophyte growth can create anoxic conditions that favor denitrification and, thus, nitrogen removal from the water column.
The relationship between productivity, richness, and ecosystem function is complex. Our study provides evidence that algal primary productivity can significantly alter the water physicochemical parameters of pH and DO. While these attributes alone do not represent significant improvements in water quality, they are indicators that aquatic primary productivity is taking place which has been shown to improve nutrient capture. Although increasing plant species richness had no apparent effect on water quality physicochemical parameters, macrophyte diversity may increase diversity in algal species by creating a wider variety of niches, thereby improving resilience of these communities (Engelhardt & Ritchie Citation2001; Kinzig et al. Citation2006). While macrophytes were recovering from disturbance during Yr3, we observed high productivity in the water column that declined once macrophytes had re-established by Yr4. In this way, the algal community may have made up for the loss of productivity of higher plants and continued to improve of water quality. This illustrates the importance of further study of algal communities to be in developing or disturbed wetland ecosystems. It may even be worthwhile to stock newly created wetlands with beneficial algal species – similar to the current practice of planting macrophytes – to jumpstart nutrient retention while the plant community develops in an effort to encourage rapid development of water quality improvement function in created mitigation wetlands. In this way we can take advantage of the high productivity in immature ecosystems being potentially a mechanism for water quality improvement function to be developed, as described by Odum's (Citation1969) observations on ecosystem community development.
Conclusions
This study investigated the effect of macrophyte planting richness on the water temperature, pH, and DO in standing-water mesocosms. Comparison of the parameters between study years and planting richness revealed no differences. The results suggest algae, not macrophytes, are likely more influential in changes to pH and DO that are indicative of water column productivity closely related with water quality function of wetlands. The outcome of this study is preliminary. Future investigations should include the measurements of algal biomass, extent of algal primary productivity, and nitrogen and phosphorus levels in water to fully explore the relationship between aquatic productivity and water quality functioning.
Acknowledgment
This research was sponsored by the Thomas F. and Kate Miller Jeffress Memorial Trust Fund (222101) and Mason 4-VA grant. We are grateful to EVPP 378 Ecological Sustainability class students (both in 2012 and 2013) for their assistance with the installation and planting of the experimental mesocosms. Thanks to Andy Sachs for his occasional assistance in YSI data collection during the summer of 2015.
Disclosure statement
No potential conflict of interest was reported by the authors.
Additional information
Funding
Notes on contributors
Brendan McAndrew
Brendan McAndrew is a graduate student in ESP pursuing the Master's degree in Environmental Science.
Changwoo Ahn
Dr Changwoo Ahn is a professor in Environmental Science and Policy (ESP), and an affiliated faculty member with Civil, Environmental, and Infrastructure Engineering and Biology at GMU. Ahn has been serving as a book editor for Ecological Engineering – The Journal of Ecosystem Restoration.
Jillian Brooks
Jillian Brooks was an undergraduate research assistant during the study.
References
- Ahn C, Mitsch WJ. 2002. Scaling considerations of mesocosm wetlands in simulating large created freshwater marshes. Ecol Eng. 18:327–342. doi:10.1016/S0925-8574(01)00092-1
- Ahn C. 2010. Plant community development in the first growing season of a created mitigation wetland bank as influenced by design elements. J Ecol Field Biol. 33:363–376.
- Atkinson RB, Perry JE, Cairns J. 2005. Vegetation communities of 20-year-old created depressional wetlands. Wetl Ecol Manag. 13:469–478.
- Beck JJ, Hernández DL, Pasari JR, Zavaleta ES. 2015. Grazing maintains native plant diversity and promotes community stability in an annual grassland. Ecol Appl [Internet]. 25:1259–1270. Available from: http://doi.wiley.com/10.1890/14-1093.1
- Bedford BL, Bouldin DR, Beliveau BD. 1991. Net oxygen and carbon-dioxide balances in solutions bathing roots of wetland plants. J Ecol. 79:943–959.
- Bouchard V, Frey SD, Gilbert JM, Reed SE. 2007. Effects of macrophyte functional group richness on emergent freshwater wetland functions. Ecology. 88:2903–2914.
- Boutin C, Keddy PA. 1993. A functional classification of wetland plants. J Veg Sci. 4:591–600.
- Butterwick C, Heaney SI, Talling JF. 2005. Diversity in the influence of temperature on the growth rates of freshwater algae, and its ecological relevance. Freshw Biol. 50:291–300.
- Cicek N, Lambert S, Venema HD, Snelgrove KR, Bibeau EL, Grosshans R. 2006. Nutrient removal and bio-energy production from Netley Libau Marsh at Lake Winnipeg through annual biomass harvesting. Biomass Bioener. 30:529–536.
- Cronk JK, Mitsch WJ. 1994. Aquatic metabolism in four newly constructed freshwater wetlands with different hydrologic inputs. Ecol Eng. 3:449–468.
- DeBusk TA, Grace KA, Dierberg FE, Jackson SD, Chimney MJ, Gu B. 2004. An investigation of the limits of phosphorus removal in wetlands: a mesocosm study of a shallow periphyton-dominated treatment system. Ecol Eng. 23:1–14.
- Dee SM, Ahn C. 2012. Soil physicochemical properties predict plant community development of mitigation wetlands created in the Virginia piedmont, U.S.A. Environ Manag. 49:1022–1036.
- Dee SM, Ahn C. 2014. Plant tissue nutrients as a descriptor of plant productivity of created mitigation wetlands. Ecol Indic. 45:68–74.
- Engelhardt KA, Ritchie ME. 2001. Effects of macrophyte species richness on wetland ecosystem functioning and services. Nature. 411:687–689.
- Fraser LH, Carty SM, Steer D. 2004. A test of four plant species to reduce total nitrogen and total phosphorus from soil leachate in subsurface wetland microcosms. Bioresour Technol. 94:185–192.
- Fulweiler RW, Emery HE, Heiss EM, Berounsky VM. 2011. Assessing the role of pH in determining water column nitrification rates in a coastal system. Estuaries Coasts. 34:1095–1102.
- Hagerthey SE, Cole JJ, Kilbane D. 2010. Aquatic metabolism in the Everglades: dominance of water column heterotrophy. Limnol Oceanogr. 55:653–666.
- Hossler K, Bouchard V, Fennessy MS, Frey SD, Anemaet E, Herbert E. 2011. No-net-loss not met for nutrient function in freshwater marshes: recommendations for wetland mitigation policies. Ecosphere. 2:36.
- Kadlec RH, Pries J, Mustard H. 2007. Muskrats (Ondatra zibethicus) in treatment wetlands. Ecol Eng. 29:143–153.
- Kadlec RH, Reddy KR. 2001. Temperature effects in treatment wetlands. Water Environ Res. [Internet]. 73:543–557. Available from: http://www.jstor.org/stable/25045537
- Kinzig AP, Ryan P, Etienne M, Allison H, Elmqvist T, Walker BH. 2006. Resilience and regime shifts: assessing cascading effects. Ecol Soc. 11.
- Knowles R. 1982. Denitrification. Microbiol Rev. 46:43–70.
- Korol AR, Ahn C. 2016. Dominance by an obligate annual affects the morphological characteristics and biomass production of a planted wetland macrophyte community. J Plant Ecol. 9:187–200.
- Laidler KJ. 1984. The development of the Arrhenius equation. J Chem Educ. 61:494–498.
- Lin YF, Jing SR, Wang TW, Lee DY. 2002. Effects of macrophytes and external carbon sources on nitrate removal from groundwater in constructed wetlands. Environ Pollut. 119:413–420.
- Marois DE, Mitsch WJ, Song K, Miao S, Zhang L, Nguyen CT. 2015. Estimating the importance of aquatic primary productivity for phosphorus retention in Florida everglades mesocosms. Wetlands. 35:357–368.
- Means MM, Ahn C, Korol AR, Williams LD. 2016. Carbon storage potential by four macrophytes as affected by planting diversity in a created wetland. J Environ Manag. 165:133–139.
- Means MM. 2015. Recovery of structure and function of the vegetation community after a disturbance as affected by initial planting richness in created wetlands [MS thesis]. Fairfax (VA): Department of Environmental Science and Policy, George Mason University.
- Mitsch WJ, Gosselink JG. 2007. Wetlands. 4th ed. Hoboken (NJ): Wiley.
- Mitsch WJ, Zhang LI, Stefanik KAYC, Nahlik AM, Anderson CJ, Bernal B, Hernandez M, Song K. 2012. Creating wetlands: primary succession, water quality changes, and self-design over 15 years. Bioscience [Internet]. 62:237–250. Available from: http://bioscience.oxfordjournals.org/cgi/doi/10.1525/bio.2012.62.3.5
- Moser KF, Ahn C, Noe GB. 2009. The influence of microtopography on soil nutrients in created mitigation wetlands. Restor Ecol. 17:641–651.
- [NRC] National Research Council. 2001. Compensating for wetland losses under the clean water act. Washington (DC): NRC.
- Odum EP. 1969. The strategy of ecosystem development. Science. 164:262–270.
- Odum HT. 1956. Primary production in flowing waters. Limnol Oceanogr. 1:102–117.
- Picard CR, Fraser LH, Steer D. 2005. The interacting effects of temperature and plant community type on nutrient removal in wetland microcosms. Bioresour Technol. 96:1039–1047.
- R Core Team. 2015. R: A language and environment for statistical computing. Vienna: R Foundation for Statistical Computing.
- Raven J, Geider R. 1988. Temperature and algal growth. New Phytologist. 110:441–461.
- Reddy KR, Patrick WH, Lindau CW. 1989. Nitrification-denitrification at the plant root-sediment interface in wetlands. Limnol Oceanogr. 34:1004–1013.
- Robertson M, BenDor TK, Lave R, Riggsbee A, Ruhl JB, Doyle M. 2014. Stacking ecosystem services. Front Ecol Environ. 12:186–193.
- Shammas NK. 1986. Interactions of temperature, pH, and biomass on the nitrification process. Water Environ Fed [Internet]. 58:7. Available from: http://www.jstor.org/stable/25042841
- Song K, Hernandez ME, Batson JA, Mitsch WJ. 2014. Long-term denitrification rates in created riverine wetlands and their relationship with environmental factors. Ecol Eng. 72:40–46.
- Spieles DJ. 2005. Vegetation development in created, restored, and enhanced mitigation wetland banks of the United States. Wetlands. 25:51–63.
- Staehr PA, Bade D, Van de Bogert MC, Koch GR, Williamson C, Hanson P, Cole JJ, Kratz T. 2010. Lake metabolism and the diel oxygen technique: state of the science. Limnol Oceanogr.: Methods. 8:628–644.
- Tanner CC, Headley TR. 2011. Components of floating emergent macrophyte treatment wetlands influencing removal of stormwater pollutants. Ecol Eng. 37:474–486.
- Thornton KW, Lessem AS. 1978. A temperature algorithm for modifying biological rates. Trans Am Fish Soc. 107:284–287.
- Verhoeven JTA, Arheimer B, Yin C, Hefting MM. 2006. Regional and global concerns over wetlands and water quality. Trends Ecol Evol. 21:96–103.
- Vymazal J, Kröpfelová L, Švehla J, Štíchová J. 2010. Can multiple harvest of aboveground biomass enhance removal of trace elements in constructed wetlands receiving municipal sewage? Ecol Eng. 36:939–945.
- Weather Underground. 2016. Historical weather. Available from: www.weatherunderground.com
- Werker AG, Dougherty JM, McHenry JL, Van Loon WA. 2002. Treatment variability for wetland wastewater treatment design in cold climates. Ecol Eng. 19:1–11.
- Wetzel RG. 2001. Limnology: lake and river ecosystems. 3rd ed. San Diego (CA): Academic Press.
- Williams LD, Ahn C. 2015. Plant community development as affected by initial planting richness in created mesocosm wetlands. Ecol Eng [Internet]. 75:33–40. Available from: http://dx.doi.org/10.1016/j.ecoleng.2014.11.030
- Zedler JB, Callaway JC. 1999. Tracking wetland restoration: do mitigation sites follow desired trajectories? Restor Ecol. 7:69–73.