
ABSTRACT
In aquatic ecosystems, estimation of bacterial abundance (BA) is intimately connected to the development of an understanding of the role of bacteria in microbial food webs. Flow cytometry (FC) can rapidly calculate BA, but to date mostly has been applied in marine waters with limited use in shallow eutrophic lakes because of the abundant organic and inorganic matter. To seek the best compromise between precision and the clarity for the differentiation of bacteria from other submicron-sized particles and colloids in eutrophic lakes, we optimized FC instrument settings, fixatives and storage conditions, ultrasonic pre-treatment and staining protocols. Then, BA in Lake Taihu was investigated by the optimized FC procedures. Regression analysis showed good correspondence (R2 = 0.72, p < 0.001, n = 128) of BA counted by FC and epifluorescence microscopy. The developed protocol was successfully applied to monitor the dynamics of BA in the large shallow eutrophic Lake Taihu. A distinct spatio-temporal shift of BA in Lake Taihu was observed. The shift was found to be mainly related to dissolved organic carbon, total suspended solids, water temperature and chlorophyll-a. Our results highlight the effect of sediment re-suspension and algal biomass on BA in eutrophic shallow lakes.
Introduction
Bacteria are a key component of microbial food webs and have crucial roles in biogeochemical cycling and energy influx in aquatic ecosystems (Cotner & Biddanda Citation2002; Newton et al. Citation2011). They not only mineralize organic materials and convert them into their inorganic constituents (Cole et al. Citation1988), but also transform dissolved organic matter (Marie et al. Citation1997) into particulate organic matter which can be consumed by high trophic levels; thus, they have a profound impact on ecosystem metabolism and function (Giorgio et al. Citation2011; Attermeyer et al. Citation2013). Hence, the quantification of bacteria is essential for understanding the ecological role of bacteria in aquatic environments.
Different methods have been used to enumerate bacteria, including traditional agar plating, direct cell counting, optical density measurement as well as by the concentration of protein or cell wall constituents (Senjarini et al. Citation2013). Epifluorescence microscopy (EpiM) and flow cytometry (FC) have recently been the common method of determining bacterial abundance (BA) in aquatic microbial ecology (Khan et al. Citation2010; Tang et al. Citation2010; Li et al. Citation2011). Compared to EpiM, FC has many advantages. FC permits the reliable and rapid detection of free-living microbes and can provide information about their distribution within cell populations. For example, FC was reported to be four times faster and more accurate (<5% standard deviation compared to >10% for EpiM) than EpiM (Wang et al. Citation2010). Moreover, it is possible to directly count by FC when the concentrations of bacteria are as low as 103–104 cells/mL, whereas EpiM requires sample concentration (Wang et al. Citation2007; Hammes et al. Citation2008).
FC has become a valuable tool for determining the abundance of autotrophic and heterotrophic bacteria rapidly and directly in oceanography (Fuchs et al. Citation2000; Jiao et al. Citation2005; Nelson et al. Citation2011). This method, however, is rarely used in enumerating microorganisms in shallow eutrophic lakes. There are two major problems that have hindered the use of FC in this kind of ecosystem. First, these lakes have high particulate and solid phase content, especially numerous abiotic particles (such as inorganic and organic complexes, clay and detritus, etc.) which could interact with fluorochromes, limiting the effectiveness of cell binding. Second, disaggregating attached bacteria from suspended particles, which can possibly lead to underestimate the bacteria densities, is a challenge.
In this paper, we compare the effects of sample fixation, storage and staining conditions on BA using FC, and optimize the pre-treatment procedures. In particular, ultrasonication was used to disaggregate samples in order to obtain a single-cell suspension and facilitate FC analysis. The main objective of this paper was to establish a rapid FC method for the accurate enumeration of heterotrophic bacteria in shallow eutrophic lakes. Then, the method was verified by comparing the results with EpiM. Furthermore, the spatio-temporal patterns of BA in Lake Taihu were explored using the optimized procedures for FC analysis. In addition, the main environmental factors related with the shifts of BA were also revealed by generalized additive models (GAM).
Materials and methods
Counting BA by FC
BA was counted by a FACSJazz cell sorter (Becton Dickinson) equipped with an air-cooled argon laser (488 nm, 80 mW). The instrument was configured for linear signal amplification for forward scatter light (FSC) detectors and logarithmic (log) amplification for side scatter light (SSC) and fluorescence detectors. All water samples were filtered through a 40-µm mesh sieve before analysis to avoid clogging the instrument's fluidics system. Bacteria were detected using a combination of SSC (related to cell size) versus green fluorescence (FL1, 530/40 nm, due to SYBR Green staining of nucleic acids), because FSC provided less resolution than side light scatter (SSC) (Sherr et al. Citation2001). Due to photosynthetic pigments, phytoplanktonic cells (mainly Microcystis) in water samples showed distinct red fluorescence. Therefore, red fluorescence (FL3, 692/40 nm) and green fluorescence were used to discriminate heterotrophic bacteria from autotrophic phytoplankton. 1.0 µm yellow-green beads (Polyscience Inc.) were added into samples as an internal standard that was used to normalize the cell fluorescence and light scatter emissions. The rate of sample injection was maintained at <1000 events/s, because high event rates greatly raise the possibility of having double events and cell coincidence. When the sample pressure offset was about 1.0 psi and the data acquisition was maintained at below 1000 events/s, the coefficient of variation of bead-fluorescence was below 5% that was regarded as the highest limit acceptable. In this experiment, threshold values at 1.35 and 320 volts on the FL1 photomultiplier tube were applied to exclude unstained particles.
A precise volume of each sample was added to BD Trucount tubes (BD-Biosciences) and incubated for 15 min in the dark at room temperature, which released a known number of fluorescent beads. Absolute counts of bacteria were determined by comparing cellular events to bead events. Gates were drawn around the beads and bacteria populations, and the number of events in each gate recorded. BA was calculated using the formula,where Ct is the sample's concentration (cells/mL), N is a known number of fluorescent beads (cells), V is a volume of the sample added to BD Trucount tubes (mL), Nt is the number of samples tested by FC (events) and N0 is the number of the fluorescent beads tested by FC (events).
Assessing the effect of fixatives and storage conditions
Effect of different fixatives
To find the optimum fixative for lake samples, three common fixatives were selected: formaldehyde (FA), paraformaldehyde (PFA) and glutaraldehyde (GA). They were all purchased from Sigma-Aldrich Inc., USA. Ten samples were selected for preliminary experiments that allowed checking of the effectiveness of different fixatives. All treatments in this experiment were conducted in replicates.
Particle-free neutralized FA was filtered through a 0.2-µm-pore-diameter cellulose ester filter using borax-buffered 37% FA and stored in the dark at room temperature. To count BA, a subsample aliquot (10 mL) of each sample was fixed using freshly prepared FA with a final concentration of 2% and incubated for 15 min at room temperature, then stored at 4 °C in the dark until analysis.
PFA was prepared from 20% PFA in phosphate-buffered saline (130 mM sodium chloride, 10 mM sodium phosphate buffer [pH 7.2]). It was heated to 60 °C in a water bath kettle until dissolved completely (about 40 min). The cooled solution was filtered through a 0.2-µm-pore-diameter polypropylene filter and was divided into small aliquots kept frozen directly upon preparation. For the fixation of water samples, second subsample aliquots (10 mL) were fixed immediately with the prepared aliquot PFA (1% final concentration), and incubated for 15 min at room temperature.
GA was filtered with 0.2 µm filters and stored in individual 10 mL sealed glass tube in order to ensure the best storage conditions. A third aliquot (10 mL) was fixed with GA (1% final concentration) for 15 min at room temperature.
Effect of storage temperature and time
Ten samples from Lake Taihu were chosen to compare the effects of sample storage time and storage temperature. Individual subsamples in three replicates were stored either in liquid nitrogen (N2), −80 or 4 °C after fixation, and BA was measured by FC within a week.
To explore the effect of storage time on BA counting, 10 samples (fixed by FA and stored at 4 °C) were tested after 0.5, 1, 3, 6, 12 months’ storage. Loss ratios (%) of bacterial cells were counted using fresh water samples as control.
Optimization of ultrasonic pre-treatment
One of the major problems associated with bacterial enumeration with FC analyses is the association of bacteria with aggregates, inorganic particles and detritus in shallow eutrophic lakes, which may affect the enumerating accuracy. Sonication was used to separate particles into single cells in order to facilitate FC analyses (Foladori et al. Citation2007). In this study, sonicator (XO-1000D, Sino Tech Inc.) with a horn tip and a temperature probe was used to pre-treat samples. The tip was placed in the center of 10 mL glass tubes on ice that contained 5 mL samples. In order to compare the results from different sonicators, reference parameter Es here was used to calculate the transferred specific energy (Foladori et al. Citation2010). It was expressed in kJ/L (Es = P × t/V) (P, transferred power; t, time; V, treated volume). In this research, two samples (Site 4 and Site 22) from Lake Taihu were selected to analyze. Site 4 was located in Meiliang Bay, suffering from intensive blooms of algae during summer and autumn. It is one of the most eutrophic regions in the north part of Lake Taihu (Qin Citation2009). Site 22 was located in the southern part of the lake that is less eutrophic. The efficiency of ultrasonication was optimized when the transferred power was fixed at 25 W. After ultrasound 2, 4, 6, 8, 10, 20 and 30 min (a fixed time interval of 5 × 5 s), the intensities of green fluorescence and BA were recorded by FC analysis.
Optimization of staining procedures
SYBR Green I is a high-affinity nucleic acid stain which is commonly used to stain electrophoretic gels and supplied in a 10,000-fold concentrate of the typical ‘stock’ solution. Stock SYBR Green I solution was diluted with dimethyl sulfoxide (DMSO) buffer (Molecular Probes Inc.), and the best dye concentration for staining on FC was defined by testing five concentrations (0.1×, 0.5×, 1×, 5×, 10×) of the ‘working’ solution (1/10,000 of the stock solution). The staining time was compared by recording the intensities of cellular fluorescence with FC after 5, 10, 20, 30, 40 and 60 min incubation.
Shift of BA in Lake Taihu
Lake Taihu (30°55′40′′–31°32′58′′ N, 119°52′32′′–120°36′10′′ E) is a large and shallow freshwater lake with an area of 2338 km2 and an average depth of 1.9 m, which is suffering from eutrophication and heavy cyanobacterial blooms (Qin et al. Citation2007). In this study, 32 surface water samples (top 50 cm) (Figure S1 in the supplemental materials) were collected with a 5 L Schindler sampler from Lake Taihu in February, May, August and November 2013. Three replicates were collected on each station and then mixed.
Measurement of environmental parameters
Electrical conductivity (EC), pH, dissolved oxygen (DO) and water temperature (WT) were measured in situ using a multi-parameter water quality sonde (YSI 6600 V2, USA). For each water sample, about 100 mL were filtered (glass-fiber filter (GF/F), nominal pore size 0.7 μm) in the field for measuring ammonium nitrogen (NH4+−N), nitrate nitrogen (NO3−−N) and dissolved organic carbon (DOC). For chlorophyll-a (Chl-a) analysis, 100–500 water samples were filtered (GF/F) and frozen prior to analysis. Another unfiltered water sample was frozen for total nitrogen (TN), total phosphorus (TP) and total suspended solids (TSS) analysis.
NH4+−N concentrations were analyzed by Nessler's reagent colorimetry, and NO3−−N concentrations were measured by the ultraviolet spectrophotometry. DOC was analyzed using a Torch TOC Analyzer (Teledyne Tekmar, USA) by high-temperature catalytic oxidation. To determine Chl-a, thawed filters were grinded and extracted by ethanol. Chl-a concentrations were determined by testing the extract at wavelengths of 665 and 750 nm (Jin & Tu Citation1990). TN and TP were determined by per sulfate oxidation and spectrophotometry. Samples analyzed for TSS were filtered with GF/F filter membrane and oven-dried the filtrating residua over 4 h at 105 °C (Jin & Tu Citation1990).
Counting BA
Water samples were fixed by FA (2% final concentration) and stored at 4 °C. BA was counted within one week by FC using the optimized procedures as described (i.e. 5 min of ultrasonic pre-treatment, staining 20 min with 1× SYBR Green I working solution).
To compare with the counting results of FC, EpiM was also performed to enumerate BA fixed by FA as described previously (Porter & Feig Citation1980; Tang et al. Citation2010). Natural water samples were stained with 4′,6-diamidino-2-phenylindole (DAPI) (final concentration 2 µg/mL) for 10 min and then filtered onto black polycarbonate filters (0.2 µm pore size, 25 mm diameter; Poretics™). Bacteria were counted using a Zeiss Axioskop 2 plus epifluorescence microscope, equipped with a HBO 100 W mercury lamp. At least 20 fields and 400 cells were enumerated per sample.
Statistical analysis
All statistical analyses were performed in R environment (version 3.2.2, http://www.r-project.org). GAM was used to explore nonparametric relationships between BA and environmental factors in Lake Taihu using the package ‘mixed GAM computation vehicle’ (mgcv) (Wood Citation2006; Wood Citation2016). All environmental parameters except WT, EC, DO and DOC were square root transformed before analysis to reduce the effect of outliers on GAM.
Results and discussion
Assessing the effect of fixatives and storage conditions
The effects of fixation were tested using 10 samples fixed with the three fixatives and counted using FC. Our result showed that the BA of 9 out of 10 samples fixed by PFA was much lower than the abundances fixed by FA and GA ((a)). Analysis of variance (ANOVA) results demonstrated that samples fixed by FA and GA yielded significant (p < 0.01) higher BA than those fixed by PFA ((b)), indicating the potential damage of bacterial cells fixed by PFA. This is consistent with a report that showed PFA prepared in phosphate-buffered saline usually precipitates in the presence of salts and consequently produces colloids interfering with the FC analysis (Christaki et al. Citation2011). In aquatic microbiological study, cell fixation is an obligatory preliminary step before analysis using FC. It can provide many advantages: (1) fixation facilitates the penetration of certain fluorochrome into the cell; (2) fixed samples may be stored and it is not necessary to test samples in real time; (3) all samples can be analyzed in one run for better comparison (Vives-Rego et al. Citation2000; Hyka et al. Citation2013).
Figure 1. Effects of fixative on heterotrophic bacterial counting. (a) Bacterial counts fixed with formaldehyde (FA), glutaraldehyde (GA) and paraformaldehyde (PFA) using different samples from Lake Taihu. (b) Comparison of the three selected fixatives. ANOVA demonstrated that the use of PFA yielded significant lower bacterial abundance (p = 0.007).
Due to better performance (), FA and GA fixation was performed further to test the effect of storage temperature and storage time. Our results indicated that BA of samples stored in liquid-N was slightly higher than samples frozen directly at −80 and 4 °C and tested within a week for both FA and GA fixation ((a,b)). It is consistent with the previous reported from the coastal water (Troussellier et al. Citation1995). However, no significant differences were observed under the three storage temperatures (p > 0.05). Due to the easier accessibility, the effect of storage time on the loss of BA was carried out with the fixative FA (2% final concentration) and stored at 4 °C. Our results demonstrated that the mean loss ratios of bacteria were about 8%, 20%, 30%, 40% and 60% after 0.5, 1, 3, 6 and 12 months’ storage, respectively ((c)). It is well known that the bacteria counts were getting less and less during storage period (Troussellier et al. Citation1995; Shibata et al. Citation2006). The results were similar to those of Troussellier et al. (Citation1995) who checked BA (about 70%) in marine samples fixed with FA after four weeks’ storage at 5 °C.
Figure 2. Effects of storage temperature and storage time on bacterial counting. (a) Samples fixed by FA and preserved in liquid nitrogen (Liquid-N), in −80 and in 4 °C. (b) Samples fixed by GA and preserved in liquid nitrogen (Liquid-N), in −80 and in 4 °C. ANOVA demonstrated that storage temperature did not have significant effect on bacterial counting (p = 0.75 for FA fixed samples; p = 0.32 for GA fixed samples). (c) Loss ratio (%) of bacterial cells fixed by FA after 0.5, 1, 3, 5, 12 months’ storage under 4 °C.
Optimization of ultrasonic pre-treatment
In contrast to marine systems, shallow lakes are limited in the application of counting bacterial cells by FC. The major reason is the large amounts of particulate and solid phase content that exist in shallow eutrophic lakes, including bacteria aggregates, organic aggregate-attached bacteria and so on (Tang et al. Citation2010). The more complicated aggregates the samples contained, the more difficult is the FC analyzed. The crux of successful quantification is how to maximize the abundances of bacteria converted into free single cells into solution. Ultrasonication is an effective method to detach bacterial cells from surfaces or substrate in lake sediment environment (Schallenberg & Kalff Citation1993; Duhamel & Jacquet Citation2006; Amalfitano & Fazi Citation2008). In the present investigation, ultrasonication was adopted to obtain a suspension of free single cells from lake water in order to facilitate FC analysis. The result showed a progressive increase of green fluorescence intensity and BA with the length of treatment time in ultrasonication, and reached the maximum value at 4–6 min (). Thereafter, BA decreased with the prolonging of ultrasonic treatment time. This result was consistent with previously reported for wastewater and activated sludge from wastewater treatment plants (Foladori et al. Citation2007). However, activated sludge flocs required Es around 80 kJ/L which is quite smaller than the value used in this research (Es = 1500 kJ/L). A possible reason might arise from the fixation. We fixed samples with FA while no fixation was used by Foladori et al. (Citation2007). It is reported that fixation with FA or GA can reinforce the cellular layer in order to reduce the damage from sonication (Tso & Taghon Citation1997). As a result, 5 min of ultrasonic treatment time (i.e. Es = 1500 kJ/L) seemed to be optimal pre-treatment for FA fixed eutrophic lake samples.
Figure 3. Effect of ultrasonication on green fluorescence intensity (a) and bacteria abundance (b) using two samples (Site 4# and Site 22#) from Lake Taihu (see Figure S1).
Optimization of staining procedures
The nucleic acid stain SYBR Green I has been used with great success for total cells enumeration in marine environment (Broadaway et al. Citation2003; Kamiya et al. Citation2007; Merwe et al. Citation2014) and proven to clearly differentiate between bacteria and nonspecifically dyed bacteria-like particles (Senjarini et al. Citation2013). In the present study, a distinct increase of the green fluorescence intensity was observed with the increasing working concentration of commercial SYBR Green I solution from 0.1-fold to 1-fold ((a)). Then, with the increasing concentration of SYBR Green I, the green fluorescence intensity decreased obviously. SYBR Green I was supplied as stock solution (10,000-fold concentration) in DMSO. In order to avoid repeated frozening, we prepared an intermediate 1:100 dilution of the SYBR Green stain in high-quality anhydrous DMSO.
Figure 4. Effects of the concentration of stain (a) and the staining time (b) on bacteria counting using two samples (Site 4# and Site 22#) from Lake Taihu (see Figure S1). x-Axis of the left panel showed the relative values of the working concentration of commercial SYBR Green I solution.
As for incubation time, the green fluorescence intensity increased rapidly during the first 20 min, and then stabilized for the rest of 40 min ((b)). Therefore, 1-fold concentration working concentration of SYBR Green I and 20 min's incubation were the optimal staining concentration and staining time.
Comparison between FC counts and EpiM counts
BA in Lake Taihu was investigated by FC using the optimized procedures as described previously (Table S1 in the supplemental materials). In addition, EpiM was also performed to compare the counting result with FC. Regression analysis showed that BA counted by FC significantly (p < 0.001) correlated with those counted by EpiM ((a)). Although paired t-test indicated that there were no significant differences between the two counting methods (p > 0.05, (b)), the mean BA counted by FC was 1.22 times than that counted by EpiM, indicating higher fluorescence intensity yield by SYBR Green I than DAPI (Lebaron et al. Citation1998; Troussellier et al. Citation1999; Kamiya et al. Citation2007).
Figure 5. Regression analysis (a) and paired t-test (b) of heterotrophic bacterial abundance in Lake Taihu counted by flow cytometry (FC) stained by SYBR Green I and epifluorescence microscopy (EpiM) stained by DAPI.
Shift of BA in Lake Taihu and the driven factors
As shown in , we observed a distinct spatio-temporal shift of BA in Lake Taihu. BA had the highest value in summer (8.46 × 10⁶ cells/mL) and the lowest value in spring (2.68 × 10⁶ cells/mL). Spatially, western and northern Taihu had higher BA than that in eastern and southern Taihu except in winter ((a)). Environmental parameters in different seasons were listed in Table S2 in the supplemental materials. GAM was used to investigate the relationship between the shift of BA and the related environmental factors. The best GAM contain four environmental factors, i.e. WT, TSS, Chl-a and DOC. They were all significantly (p < 0.001 for WT and TSS; p < 0.05 for Chl-a and DOC) related to BA and explained 77.5% of the variance of BA totally ().
Figure 6. Spatio-temporal distributions of bacterial abundance (a), total suspended solids (TSS) and chlorophyll-a (Chl-a) in 2013 in Lake Taihu.
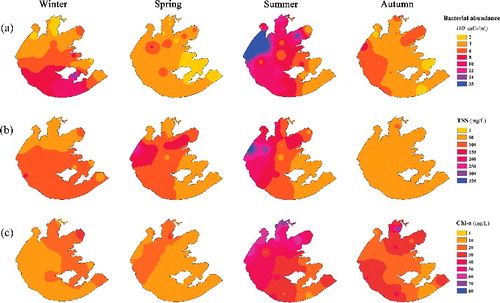
Figure 7. Generalized additive model (GAM) plots identifying the additive effect of water temperature (WT), total suspended solids (TSS), chlorophyll-a (Chl-a) and dissolved organic carbon (DOC) on bacterial abundance in Lake Taihu. Each mark along the x-axis represents a single observation. The y-axis represents the degree of smoothing with its range indicative of the relative importance of the covariate. Dotted lines represent 95% confidence intervals around response curves. Note that TSS and Chl-a were square root transformed before the analysis.
Degrees of freedom in smoothing function revealed that DOC was the most important factor, followed by TSS, WT and Chl-a (). DOC showed a strong non-linear relation with BA, but the general trend indicates a positive effect at higher concentrations. DOC is one of the most important carbon resources for aquatic heterotrophic bacteria (Wetzel Citation2001). Therefore, the positive relationship between BA and DOC is well understood.
TSS also showed a strong positive non-linear relation with BA, indicating the importance of sediment re-suspension on BA. Because of the shallowness (mean depth < 2.0 m), Lake Taihu experiences frequent wind-induced sediment re-suspension. The much higher number of bacteria in sediments was easily entered into water column passively by wind, which can increase BA in the water column in a short time. According to long observation (Wu et al. Citation2015), the main wind direction over Lake Taihu is east-southeast from spring to summer and east-northeast from autumn to winter. In the present study, the high abundance of bacteria that occurred at south Taihu in winter was coincident with the high TSS concentration pattern in Lake Taihu ((b)). This result confirmed that wind-induced sediment re-suspension is an important factor on BA pattern in shallow Lake Taihu.
Square root transformed Chl-a had a positive linear relation with BA. In addition, the distribution pattern of Chl-a (an indicator of algal biomass) in Lake Taihu was similar to that of BA, especially in summer and autumn ((c)). This result indicated a strong interaction between autotrophic algae and heterotrophic bacteria. Previous researches (Sigee Citation2005; Prieto et al. Citation2016) have demonstrated that algae can release DOC to the water column during their growth period, which can be utilized by algal attached or free-living bacteria.
Normally, BA was positively related with WT and nutrient level. In the present study, however, there were no significant differences of BA among winter, spring and autumn with the mean WT of 9, 24 and 15 °C, respectively. The possible reason for such inconsistency is that the relative higher BA in winter may be caused mainly by wind-induced sediment re-suspension (i.e. high TSS, )), while the relative lower BA in spring may be related to calm weather and low algal density in typical ‘clear water’ spring period (, Wetzel Citation2001). In addition, we found no significant relationship between BA and nutrient level, which indicated that nutrient is not limited factor for BA in the eutrophic shallow Lake Taihu. It is notable that the patterns of BA in Lake Taihu were just based on samplings once a season. Considering the large heterogeneity and the effect of frequent wind in Lake Taihu, cautions should be taken when evaluating BA response to environmental variables.
Conclusions
The present study established a rapid protocol using FC to enumerate heterotrophic bacteria in large shallow eutrophic lakes (summarized in Table S1 in the supplemental materials). The protocol was verified by comparing the results with EpiM and was successfully applied to count BA in Lake Taihu. Using the optimized FC counting procedures, we observed a distinct spatio-temporal dynamics of BA in Lake Taihu. GAM revealed that TSS (an indicator of sediment re-suspension), DOC and Chl-a (related to algal biomass) and temperature were the main environmental factors, which explained 77.5% of the shift of BA. The results highlighted the potential release of sediment bacteria to the water column and the interaction between autotrophic algae and heterotrophic bacteria in large, shallow eutrophic lakes.
Supplemental_materials.docx
Download MS Word (128.8 KB)Acknowledgments
We thank Taihu Laboratory for Lake Ecosystem Research for helping with sample collection. We especially thank for Professor Steven W. Wilhelm for his useful comments and linguistic improvements. This work was supported by the National Natural Science Foundation of China (41230744 & 41471040) and Key Laboratory of Water Science and Engineering, Nanjing Hydraulic Research Institute (Yk914006).
Disclosure statement
No potential conflict of interest was reported by the authors.
Additional information
Funding
Notes on contributors
Yi Gong
Yi Gong was born in 1984. She is a PhD candidate and concerns about microbiology in freshwater.
Xiangming Tang
Xiangming Tang was born in 1976 and concerns about bacterial community from freshwater.
Keqiang Shao
Keqiang Shao was born in 1982 and concerns about sediment bacterial community in eutrophic lakes.
Yang Hu
Yang Hu was born in 1988 and concerns about environment sciences.
Guang Gao
Guang Gao was born in 1964 and is interested in the microbial ecology of lakes, phosphorus dynamics in lakes, microbial food web and lake metabolism.
References
- Amalfitano S, Fazi S. 2008. Recovery and quantification of bacterial cells associated with streambed sediments. J Microbiol Methods. 75:237–243.
- Attermeyer K, Premke K, Hornick T, Hilt S, Grossart HP. 2013. Ecosystem-level studies of terrestrial carbon reveal contrasting bacterial metabolism in different aquatic habitats. Ecology. 94:2754–2766.
- Broadaway SC, Barton SA, Pyle BH. 2003. Rapid staining and enumeration of small numbers of total bacteria in water by solid-phase laser cytometry. Appl Environ Microbiol. 69:4272–4273.
- Christaki U, Courties C, Massana R, Catala P, Lebaron P, Gasol JM, Zubkov MV. 2011. Optimized routine flow cytometric enumeration of heterotrophic flagellates using SYBR Green I. Limnol Oceanogr Methods. 9:329–339.
- Cole J, Findlay S, Pace M. 1988. Bacterial production in fresh and saltwater ecosystems: a cross-system overview. Mar Ecol Prog. 43:1–10.
- Cotner JB, Biddanda BA. 2002. Small players, large role: microbial influence on biogeochemical processes in pelagic aquatic ecosystems. Ecosystems. 5:105–121.
- Duhamel S, Jacquet S. 2006. Flow cytometric analysis of bacteria-and virus-like particles in lake sediments. J Microbiol Methods. 64:316–332.
- Foladori P, Bruni L, Tamburini S, Ziglio G. 2010. Direct quantification of bacterial biomass in influent, effluent and activated sludge of wastewater treatment plants by using flow cytometry. Water Res. 44:3807–3818.
- Foladori P, Laura B, Gianni A, Giuliano Z. 2007. Effects of sonication on bacteria viability in wastewater treatment plants evaluated by flow cytometry—fecal indicators, wastewater and activated sludge. Water Res. 41:235–243.
- Fuchs BM, Zubkov MV, Sahm K, Burkill PH, Amann R. 2000. Changes in community composition during dilution cultures of marine bacterioplankton as assessed by flow cytometric and molecular biological techniques. Environ Microbiol. 2:191–201.
- Giorgio PAD, Condon R, Bouvier T, Longnecker K, Bouvier C, Sherr E, Gasol JM. 2011. Coherent patterns in bacterial growth, growth efficiency, and leucine metabolism along a northeastern Pacific inshore-offshore transect. Limnol Oceanogr. 56:1–16.
- Hammes F, Berney M, Wang Y, Vital M, Köster O, Egli T. 2008. Flow-cytometric total bacterial cell counts as a descriptive microbiological parameter for drinking water treatment processes. Water Res. 42:269–277.
- Hyka P, Lickova S, Přibyl P, Melzoch K, Kovar K. 2013. Flow cytometry for the development of biotechnological processes with microalgae. Biotechnol Adv. 31:2–16.
- Jiao N, Yang Y, Hong N, Ma Y, Harada S, Koshikawa H, Watanabe M. 2005. Dynamics of autotrophic picoplankton and heterotrophic bacteria in the East China Sea. Cont Shelf Res. 25:1265–1279.
- Jin XC, Tu QY. 1990. The standard methods for observation and analysis of lake eutrophication. 2nd ed. Beijing: China Environmental Science Press.
- Kamiya E, Izumiyama S, Nishimura M, Mitchell JG, Kogure K. 2007. Effects of fixation and storage on flow cytometric analysis of marine bacteria. J Oceanogr. 63:101–112.
- Khan MMT, Pyle BH, Camper AK. 2010. Specific and rapid enumeration of viable but nonculturable and viable-culturable gram-negative bacteria by using flow cytometry. Appl Environ Microbiol. 76:5088–5096.
- Lebaron P, Parthuisot N, Catala P. 1998. Comparison of blue nucleic acid dyes for flow cytometric enumeration of bacteria in aquatic systems. Appl Environ Microbiol. 64:1725–1730.
- Li H, Xing P, Chen M, Bian Y, Wu Q. 2011. Short-term bacterial community composition dynamics in response to accumulation and breakdown of Microcystis blooms. Water Res. 45:1702–1710.
- Marie D, Partensky F, Jacquet S, Vaulot D. 1997. Enumeration and cell cycle analysis of natural populations of marine picoplankton by flow cytometry using the nucleic acid stain SYBR Green I. Appl Environ Microbiol. 63:186–193.
- Merwe RVD, Hammes F, Lattemann S, Amy G. 2014. Flow cytometric assessment of microbial abundance in the near-field area of seawater reverse osmosis concentrate discharge. Desalination. 343:208–216.
- Nelson CE, Alldredge AL, Mccliment EA, Amaral-Zettler LA, Carlson CA. 2011. Depleted dissolved organic carbon and distinct bacterial communities in the water column of a rapid-flushing coral reef ecosystem. ISME J. 5:1374–1387.
- Newton RJ, Jones SE, Eiler A, Mcmahon KD, Bertilsson S. 2011. A guide to the natural history of freshwater lake bacteria. Microbiol Mol Biol Rev. 75:14–49.
- Porter KG, Feig YS. 1980. The use of DAPI for identifying and counting aquatic microflora. Limnol Oceanogr. 25:943–948.
- Prieto A, Barberlluch E, Hernandezruiz M, Martinezgarcia S, Fernandez E, Teira E. 2016. Assessing the role of phytoplankton-bacterioplankton coupling in the response of microbial plankton to nutrient additions. J Plankton Res. 38:55–63.
- Qin B. 2009. Lake eutrophication: control countermeasures and recycling exploitation. Ecol Eng. 35:1569–1573.
- Qin B, Xu P, Wu Q, Luo L, Zhang Y. 2007. Environmental issues of lake Taihu, China. Hydrobiologia. 581:3–14.
- Schallenberg M, Kalff J. 1993. The ecology of sediment bacteria in lakes and comparisons with other aquatic ecosystems. Ecology. 74:919–934.
- Senjarini K, Karsten U, Schumann R. 2013. Application of fluorescence markers for the diagnosis of bacterial abundance and viability in aquatic ecosystem. J Microbiol Res. 3:143–147.
- Sigee DC. 2005. Freshwater microbiology: biodiversity and dynamic interaction of microorganisms in the aquatic environment. Chichester: John Wiley & Sons Ltd; p. 401–441.
- Sherr B, Sherr E, Giorgio PD. 2001. Enumeration of total and highly active bacteria. Methods Microbiol. 30:129–159.
- Shibata A, Goto Y, Saito H, Kikuchi T, Toda T, Taguchi S. 2006. Comparison of SYBR Green I and SYBR Gold stains for enumerating bacteria and viruses by epifluorescence microscopy. Aquat Microb Ecol. 43:223–231.
- Tang X, Gao G, Chao J, Wang X, Zhu G, Qin B. 2010. Dynamics of organic-aggregate-associated bacterial communities and related environmental factors in Lake Taihu, a large eutrophic shallow lake in China. Limnol Oceanogr. 55:469–480.
- Troussellier M, Courties C, Lebaron P, Servais P. 1999. Flow cytometric discrimination of bacterial populations in seawater based on SYTO 13 staining of nucleic acids. FEMS Microbiol Ecol. 29:319–330.
- Troussellier M, Courties C, Zettelmaier S. 1995. Flow cytometric analysis of coastal lagoon bacterioplankton and picophytoplankton: fixation and storage effects. Estuarine Coast Shelf Sci. 40:621–633.
- Tso S, Taghon G. 1997. Enumeration of protozoa and bacteria in muddy sediment. Microb Ecol. 33:144–148.
- Vives-Rego J, Lebaron P, Nebe-Von Caron G. 2000. Current and future applications of flow cytometry in aquatic microbiology. FEMS Microbiol Rev. 24:429–448.
- Wang Y, Hammes F, Boon N, Egli T. 2007. Quantification of the filterability of freshwater bacteria through 0.45, 0.22, and 0.1 microm pore size filters and shape-dependent enrichment of filterable bacterial communities. Environ Sci Technol. 41:7080–7086.
- Wang Y, Hammes F, Roy KD, Verstraete W, Boon N. 2010. Past, present and future applications of flow cytometry in aquatic microbiology. Trends Biotechnol. 28:416–424.
- Wetzel RG. 2001. Limnology: lake and river ecosystems. San Diego (CA): Academic Press.
- Wood SN. 2006. Generalized additive models: an introduction with R. Boca Raton (FL): Chapman and Hall–CRC.
- Wood SN 2016. mgcv. R Package Version 1.8-12. Available from: https://cran.r-project.org/web/packages/mgcv/
- Wu T, Qin B, Brookes JD, Shi K, Zhu G, Zhu M, Yan W, Wang Z. 2015. The influence of changes in wind patterns on the areal extension of surface cyanobacterial blooms in a large shallow lake in China. Sci Total Environ. 518–519:24–30.