
ABSTRACT
Here, we analyse the annual dynamics in the diversity and the food web structure of the macroinvertebrate community in a Mediterranean permanent stream. Then, we also tested the validity of different proposed predictive models in their ability to fit our results. We calculated the Shannon-Wiener diversity index, the evenness, several food web properties and the proportion of functional feeding groups throughout the year. Our results showed a great variability of the studied parameters with time, mainly in terms of trophic relationships among macroinvertebrates. Diversity did not fluctuate substantially, but functional feeding groups did. In the same manner, complexity of the food web also varied substantially along the year. Comparisons with the considered models showed that, overall, none of the models predicted accurately the observed values. Nevertheless, within them, at least some estimated relatively realistic values, mainly when considering data monthly. From a functional point of view, collector-gatherers were the most abundant group throughout the sampling period except in autumn, when scrapers were also proportionally important. Predators were present during the entire period but with a low abundance. Thus, this study underlines the importance of considering not only static, but also dynamic data when studying food webs.
Introduction
Natural ecosystems are highly heterogeneous in space and time (Kolasa & Rollo Citation1991; Stewart et al. Citation2000). This heterogeneity results from interaction between spatial–temporal dynamics in environmental constraints and the organisms (Milne Citation1991). Several factors are responsible to provide spatial and temporal heterogeneity in nature, among them abiotic factors and natural disturbances are considered two of the main ones. Particularly, streams and rivers are very dynamical ecosystems within freshwaters, with variable spatial and temporal conditions (Allan & Castillo Citation2007). This variability influences the biocenosis that these systems support. The extreme case would be lotic temporary waters, where abiotic factors (mainly the lack of water during a given period) condition their community of organisms and even the life histories of those that are able to inhabit and exploit such environments, especially aquatic insects (Williams Citation1996, Citation2006). These organisms modify their development in response to some environmental variables, mainly temperature and food resources (Sweeney Citation1984), using cues such as photoperiod to predict the arrival of adverse or favourable conditions.
In Mediterranean areas, the climate itself is considered a natural predictable disturbance, altering the discharge regimes along and between years (McElravy et al. Citation1989; Gasith & Resh Citation1999; Hershkovitz & Gasith Citation2012). Actually, Mediterranean climate is characterized by a great seasonality, and typically, a rainy season with high river discharge is followed by a dry period with little or no rainfall and slowly declining river flow. This seasonal reduction in flow constrains structure and biological traits on macroinvertebrate communities (Bonada et al. Citation2007), determining also their composition of functional feeding groups (FFG) and richness (Bogan & Lytle Citation2007). In fact, as the Habitat Templet Theory (Southwood Citation1977, Citation1988) underlines, there is an effect of the habitat heterogeneity on the organisms’ responses and adaptations. This approach is based on the idea that habitat is a frame where evolution occurs giving characteristic life history strategies to organisms and providing a community organization at different scales of perception (Townsend & Hildrew Citation1994). At this organization level (community), an interesting approach to study the interactions among organisms is the use of networks. Within this approach, the relations among organisms can be described as a web of nodes (elements) linked by edges (interactions) (Junker Citation2008), which provide important information on the behaviour of the whole system. Individuals interact both with the environment (abiotic factors) and other individuals (biotic factors), and this determines the characteristics of communities, ecosystems in general (Morin Citation2011) and lotic systems in particular. There are many kinds of ecological networks, of which one of the most important at the community level are food webs (Pascual & Dunne Citation2006a; Junker Citation2008).
In this sense, the analysis of food webs represents an approach to understand the functioning of ecosystems, in which trophic interactions between species are as or more important than community composition (Bascompte Citation2009) and give us information about material flow in a given ecosystem. In fact, food webs models have been proposed as a fundamental tool to describe and quantify the complexity and stability of ecosystems (e.g. May Citation1972; Pimm Citation1984; Montoya et al. Citation2006). Several regularities have been suggested in food webs of different ecosystems, such as short food-chains, variability in the level of connectivity among nodes in relation to web size, relatively constant proportions of basal, intermediate and top predator species, etc. (see Jaarsma et al. Citation1998; Pascual & Dunne Citation2006a). Nonetheless, it is not clear if they are real or an artefact of poor data (Martinez Citation1991). Even in other kinds of ecological networks, some patterns have been proposed. For instance, an increasing number of interactions per species upon increasing diversity have been pointed out in plant–pollinator interaction networks (Olesen & Jordano Citation2002).
However, not only the architecture of the network is important to determine the characteristics of the community. It is also necessary to understand the temporal dynamic of the community and the network, and how interactions between nodes (relationships between species or trophospecies) change with time due to, for instance, environmental variability or the life history of the organisms. Previous studies in Mediterranean streams have already reported how environmental stochasticity results in dramatic differences of the food web structure along the year (López-Rodríguez et al. Citation2012; Vannucchi et al. Citation2013). These studies focused in temporary streams, both intermittent and seasonal. Therefore, comparisons with permanent Mediterranean rivers would give us a whole picture of the ecological patterns that control the community structure in these ecosystems. As stated by Pascual and Dunne (Citation2006b), food web structure is clearly dynamic at many scales, changing in time and space as the result of the plasticity of ecological interactions, environmental variation and assembly. Thus, dynamics aspects of structure may also be crucial for our understanding of stability and persistence.
Several models have been used to predict the behaviour of some food web parameters and structure. One of the firsts was the random model (RM; Erdös & Rényi Citation1960) that uses a stochastic, binary link approach similar to that of random graph theory (Dunne Citation2006). Afterwards, Cohen and Newman (Citation1985) proposed the cascade model (CM; which was subsequently developed by Cohen et al. Citation1990), the first widely accepted model of food web structure (Williams & Martinez Citation2008). In this model, each species is assigned a random value from the interval [0,1], and they have a given probability to consume species with values less than their own, but never equal or higher, which creates a feeding hierarchy and disallows loops as cannibalism (Dunne Citation2006). To solve the limitations of previous models, Williams and Martinez (Citation2000) developed the niche model (NM). This model assigns a uniformly random niche value to each species along an axis. On this axis, feeding ranges of the species are represented as intervals whose midpoint is a uniformly random number less than the niche value. All species that fall in this range are eaten by the consumer species (Dunne Citation2006). A variant of this is the relaxed niche model (RNM; Williams & Martinez Citation2008), which adds a variable called contiguity (g) that controls the niche widths in relation to their maximum possible widths, ranging from 0, the maximum niche width, to 1, the narrowest niche width. Also based in the same rules of the NM, the nested hierarchy model (NHM; Cattin et al. Citation2004) tries to take into account the phylogenetic constraints when predicting the links among resources and consumers.
Besides these, several models have been proposed trying to improve accuracy and predictability over the past few years (e.g. Williams Citation2010b; Williams et al. Citation2010). Many of the previously mentioned models and some others have been compared among them and with empirical data from several different ecosystems (e.g. Stouffer et al. Citation2005; Williams & Martinez Citation2008; Dunne & Williams Citation2009), but never, to our knowledge, within an ecosystem at different times, i.e. at a temporal scale.
Thus, the aim of this work is to evaluate the importance of the temporal scale in the study of the community and the food web of a typical macroinvertebrate assemblage from a permanent Mediterranean stream, with relatively stable conditions throughout the year. To achieve this objective, we studied at monthly intervals during a whole year: (1) the diversity of the community using the Shannon-Wiener's diversity index and the evenness, (2) the trophic role of the organisms and (3) the food web of the stream. We combine in this manuscript data on diversity with those of the food web properties in order to find possible relations between them. We use this temporal-scale data to validate the applicability of the most popular food web models in Mediterranean ecosystems, as has been already done in other ecosystems (Williams & Martinez Citation2008). We also analyse the FFG composition and their role on the organic matter processing. In this manner, functioning of the benthic communities may also be inferred.
Material and methods
Study area
The study was performed in the Cacín stream, along a first-order, 100-m section on its upper reach (N 36° 56′ 33.7″ W 3° 51′ 47.8″, 842 m a.s.l., Sierra de Almijara, Granada province, Spain). This permanent stream had a total extension of 50 km length and a hydrologic cycle characterized by a maximum flow during spring and a reduction in summer, due to low rainfall and high temperatures. The streambed in the study section was composed mainly by gravels (approximately 50%), pebbles (30%) and sand (15%) and, in a lower proportion, cobbles (about 5%). The average wet width during the sampling period was 7.81 ± 0.70 m and its average depth of 0.25 ± 0.08 m. The study section was surrounded by well-developed riparian vegetation, constituted mainly by Populus alba, Salix sp., Juncaceae and Poaceae.
Sampling and gut content analyses
Macroinvertebrates were collected with a Surber sampler (0.1 m2 area and 250 μm mesh size) from 18 November 2010 to 17 October 2011, approximately every 30 days. Six Surbers were collected covering all the microhabitats (according with flow velocity and substrate granulometry), but the six samples were pooled together to have a representation of the community of the whole section. Sampling effort was standardised in all cases by placing the device on the streambed and disturbing the sediment vigorously during 2 min. Physicochemical parameters (conductivity, pH, % O2 and O2 concentration) were recorded in each sampling date. Moreover, a temperature datalogger was placed in the streambed during the whole study period, which recorded temperature hourly.
All macroinvertebrates collected were preserved in 4% formalin and taken to the laboratory, where they were washed and sieved to remove the excess of formalin and fine detritus. Afterwards, all the individuals were sorted and identified to family level (but Hirudinea) using an optical stereomicroscope.
Gut contents of individuals of all the collected taxa were studied using the transparency methodology of Bello and Cabrera (Citation1999), already used in other studies dealing with aquatic insect feeding (e.g. Fenoglio et al. Citation2009; López-Rodríguez et al. Citation2009) and in previous food web studies of the benthic fauna in Mediterranean streams (López-Rodríguez et al. Citation2012; Vannucchi et al. Citation2013). When using direct methods for quantifying gut contents, it is common that collected individuals have empty or partially full guts (Rosi-Marshall et al. Citation2016). Thus, it has been proposed to collect ideally around 15–20 individuals by group in order to reduce sampling error (Rosi-Marshall et al. Citation2016). Given this, a maximum of 30 individuals of each family were studied by sampling date, when available. Each individual was introduced in a vial with Hertwigs’ liquid and heated in an oven at 65 °C for approximately 24 h. After that, individuals were placed in a slide with a cover on and examined under the microscope where the absolute percentage of gut content (measured as percentage of occupied area) at 40x, and the relative percentage of each component present in the gut at 400x were estimated. When preys were found in the gut, they were identified to the family level, when possible.
Diversity and food web analyses
For the whole community, we calculated the Shannon-Wiener's diversity index () with the package Vegan under R (Oksanen et al. Citation2013) and the evenness (
, where S is the number of taxa). Ostracoda and Hydracarina were excluded from our study, even if present in some of our samples and gut contents sporadically. These are small meiofauna organisms (e.g. Rundle et al. Citation2002; Tachet et al. Citation2010) and they would not be properly sampled with our Surber method. With the data obtained through the study of gut contents we represented the food web of each sampling date, considering only the direct links, i.e. those clearly determined from our own data. For their representation and analysis, we used the Network3D software (Williams Citation2010a; Yoon et al. Citation2004). We computed the food web parameters summarized in (Williams & Martinez Citation2008).
Table 1. Food web parameters studied in the Cacín stream.
In some cases, we were not able to identify prey at a family level and worked with orders. In such cases, we included a new node in the food web that represented the order, so some parameters, such as connectance (C) or link density (links per node, LD), may be minimally affected.
The afore-mentioned food web parameters were calculated each month and annually (data from all months together), and were used to fit the following food web models using Network3D software (Yoon et al. Citation2004; Williams Citation2010a): RM, CM, NM, RNM (with g = 0.5 to consider that nodes have a medium niche width) and NHM. This software uses a network of the same size of the actual (observed) food web to get random food webs applying the proper algorithm of each model. We obtained the mean value of each parameter after 100 iterations and the upper and lower confidence intervals, and we compared graphically the confidence intervals for each parameter under each model with those of the observed data.
Though the taxonomic resolution at the identification stage was family (thus nodes represent families), the study of the gut contents was done at the individual level. Therefore, although nodes may be relatively underestimated compared with other studies at higher taxonomic resolution, the relationships between organisms and resources are very accurate. Nonetheless, some food web parameters (such as mean chain length or linkage complexity, equivalent to linkage density) are relatively robust to increasing aggregation and decreasing diversity (Martinez Citation1991; Thompson & Townsend Citation2000; Dunne Citation2006). On the other hand, as we are comparing food web parameters within the same stream and with the same resolution level, this would not affect our conclusions (see Thompson & Townsend Citation2000 for a discussion on this topic).
Functional feeding groups’ classification procedure
Data from the gut content analyses were subsequently used to assign each taxon to its FFG (according to Merritt & Cummins Citation1996). Organisms were classified in these FFGs according to the type and size of food they feed on and their mechanism of acquisition. Therefore, organisms within them share morphological and behavioural similarities. Density of each taxon was multiplied by their percentages of eaten resources (for instance, a taxon with 100 ind/m2 that feeds 10% on fine particulate organic matter and 90% on coarse particulate organic matter would contribute with 10 ind/m2 to the collector-gatherers FFG and with 90 ind/m2 to the shredders FFG).
Statistical analyses
Statistical analyses were performed using R (R Core Team Citation2014). A Spearman correlation test was used to assess the possible relation among the number of taxa, number of nodes (S), C and LD during the study period (as these two latter parameters usually reflect the complexity of the food web). This was performed to test if more nodes and/or taxa (i.e. web size) were related to higher complexity or not. We also analysed the possible correlation between C, LD, fraction of omnivores and fraction of cannibals with both the Shannon-Wiener diversity index and evenness. We selected these parameters to test, on the one hand, the relation between complexity (C and LD) and diversity and, on the other, the relation between two usually reported stabilizing factors (omnivory and cannibalism) with diversity.
Results
Physicochemical conditions of the stream
Physicochemical characteristics of the stream did not vary greatly throughout the year, except discharge and temperature. Temperature ranged from a minimum of 6.9 °C in December to a maximum of 18.7 °C in August (mean = 13.2 ± 3.2 °C). Discharge presented a considerable fluctuation throughout the study, with the highest values during the central period of the study, from January to July (max = 1.16 m3/s), and decreasing subsequently until a minimum of 0.34 m3/s (mean = 0.86 ± 0.31 m3/s). The values of pH (mean = 8.45 ± 0.08) and oxygen (mean = 8.77 ± 0.65 mg/l and 92.23 ± 5.56%, respectively) stayed approximately constant during the whole period, as well as conductivity that did not suffer significant peaks, remaining roughly constant (mean = 335.35 ± 32.92 μS/cm) with higher values during summer (max = 392.00 μS/cm).
Community structure, diversity and dynamics
The macroinvertebrate community in the Cacín stream included 33 families, excluding Ostracoda and Hydracarina (see Supplementary Data). The number of coexisting families during the study period ranged from a maximum of 20–23, mainly in the autumnal months (and in June), to a minimum of 13 families, in January. The most abundant family was Baetidae (with an average density of 871.94 ind/m2), followed by Chironomidae (210.56 ind/m2), while all the other families had a very low density.
In terms of diversity dynamics, the Shannon-Wiener index presented slight fluctuations (). It showed the highest values in December and February, started to decrease gradually to a minimum in June and afterwards it began to increase slowly again. The evenness showed the same trend than the Shannon-Wiener index, with a peak in February, a minimum in June and a recovery after summer.
Figure 1. Maximum Shannon-Wiener index of diversity (), actual Shannon-Wiener index (H′) and evenness (E′) of the macroinvertebrate community in the Cacín stream throughout the study period.
Functional feeding groups
Regarding the FFG composition of the community, collector-gatherers, which fed mainly on fine detritus, were the most abundant throughout the sampling period reaching their maximum densities in summer (), except in autumn, when scrapers, feeding mainly on diatoms, also made an important role in the community. Predators were present during the entire period, having, however, a rather low abundance. Shredders and filter-feeders, these latter represented only by Simuliidae, were fairly scarce during the entire study period in comparison with the other groups.
Food web structure, diversity and model comparisons
For the analysis of the trophic relationships among organisms, we analysed the gut content of 2172 individuals collected during the study period, of which 1141 had some content. This absence of gut content did not follow any seasonality. Of the latter, 184 had some animal remain in their gut. shows the mean gut content of each taxon considering all dates together, i.e. the mean of the gut content along the year of study.
Table 2. Gut contents of each taxon present in the macroinvertebrate community of the Cacín stream.
shows the topology of the macroinvertebrate food web in the Cacín stream throughout the study period. This food web was composed of an average S (±SD) of 22.83 ± 3.74, with a minimum of 16 nodes in April and a maximum of 27 in September and November (). It had a mean of 2.87 ± 0.20 LD and a mean C of 0.13 ± 0.03, which is relatively low. The mean fraction of top nodes was 0.63 ± 0.07, that of intermediate nodes was 0.05 ± 0.03 and that of basal was 0.32 ± 0.05. The fraction of herbivores was greater than the fraction of omnivores, and both were greater than the fraction of cannibals (0.55 ± 0.08, 0.16 ± 0.05 and 0.03 ± 0.03, respectively). The mean generality SD was 0.83 ± 0.07, the mean vulnerability SD was 1.68 ± 0.19 and the mean link SD was 0.65 ± 0.11. This points out that the number of consumers per taxon was greater than the number of resources per taxon. The average of the mean shortest chain length was 1.69 ± 0.05, supporting that the chains that form the web were relatively short.
Figure 2. Variation in the density of functional feeding groups throughout the study period in the Cacín stream.
Table 3. Food web parameters analysed in the Cacín stream for each sampling date.
We did not find a significant correlation between S and number of taxa with linkage density (Spearman R = 0.01 and –0.06, respectively; p > 0.05 in both cases), between fraction of omnivores and diversity (Spearman R = –0.13; p > 0.05) and neither between C and diversity (Spearman R = –0.25; p > 0.05). On the other hand, we found a strong negative correlation between C and S (Spearman R = –0.95; p < 0.05), between C and the number of taxa (Spearman R = –0.79; p < 0.05), between linkage density and diversity (Spearman R = –0.77; p < 0.05) and between the fraction of cannibals and diversity (Spearman R = –0.79; p < 0.05).
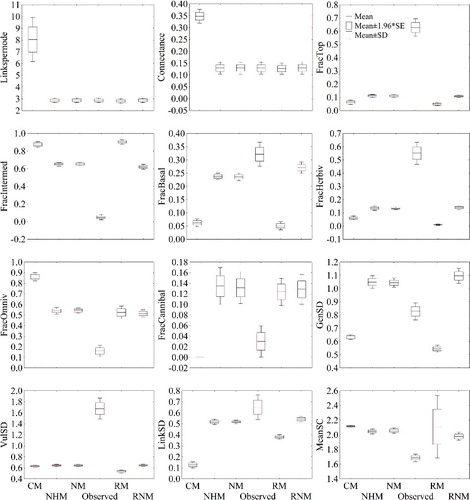
When we compared observed C and LD of each month with those predicted by the chosen models (see Material and methods section), we detected that in both cases, as expected, all models but CM included the observed values within their confidence intervals (). A similar trend was observed for mean shortest chain length, although it did not appear so clear when comparing observed values with those obtained with the CM, NHM and NM. The fraction of top nodes, the fraction of herbivorous, the vulnerability SD and the link standard deviation were underestimated by all. Contrary, the fraction of intermediate taxa and the fraction of omnivorous were overestimated. The observed values of the fraction of basal nodes seem to be different compared with those calculated by the RM and the CM. The fraction of cannibals did not show differences among observed values and model values, and the observed generality standard deviation only showed differences some months of the year, but not all, with the considered models.
Figure 3. Graphical representation of the topology of the food webs of each sampling date in the Cacín stream.
When we assembled the values of the whole year, we detected differences in C and LD between CM and the rest of models, and with the actual values. In contrast, there were no differences among the other models, and neither between the models and the observed values (). As for the monthly data, the fraction of top nodes, the fraction of herbivorous, the vulnerability SD and the link standard deviation were underestimated by all models, and the fraction of intermediate taxa and the fraction of omnivorous were overestimated. Also the fraction of cannibals was significantly higher when calculated with the considered models, as well as the fraction of basal nodes, although in this case there were no significant differences between the observed values and those of the RNM. All models overestimated the mean shortest chain length, but no significant differences were found between the observed values and the RM values. The empirical annual mean of the generality standard deviation is in the middle of the generality standard deviation obtained by the NHM, NM and RNM (which did not show significant differences) and that obtained with the CM and the RM.
Figure 4. Graph showing the observed values of the analysed parameters of the food web in the Cacín stream each month, and values in each month calculated with each model under consideration. Bars represent mean values and whiskers represent upper and lower confidence intervals.
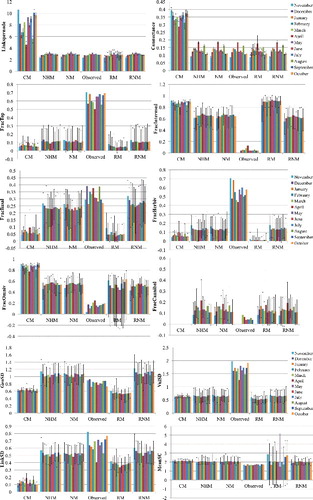
Figure 5. Empirical annual values of the analysed parameters of the food web (see Material and methods section for their explanation) in the Cacín stream and annual values calculated with the models under consideration.
Discussion
Physicochemical conditions
The abiotic conditions of the Cacín stream are quite regular during the year, albeit temperature and discharge vary greatly depending on the season. This variation is a consequence of the climate dependence of this stream, which is located in a Mediterranean climate region. Thus, the most common taxa are Baetidae, Chironomidae, Leuctridae or Hydropsychidae, most of them with wide tolerance ranges to environmental variations (Jáimez-Cuéllar et al. Citation2002).
Community structure and diversity
The community is relatively rich in the number of families. If we observe the macroinvertebrate community of other sites that also present a Mediterranean climate (thus rivers with Mediterranean regime), we realize that the number of families is comparable. For instance, Sánchez-Carmona et al. (Citation2012) studied six streams among which the one with the highest taxon richness presented 29 taxa. These authors identified macroinvertebrates at the family, genus and species level. However, the number of families would be slightly lower than in the Cacín stream. Muñoz (Citation2003) recorded 45 and 38 taxa in the streams she studied, but many of them were identified to the genus or species level, so again the number of families would be comparable. Nevertheless, in our study not all the taxa were present every month. Only Baetidae, Leuctridae, Hydropsychidae, Chironomidae and Elmidae were present all year round, probably due to the presence of several species within each family and to their particular life cycles, many of which are multivoltine (Tachet et al. Citation2010). The great oscillation in the number of coexisting families reflects the great fluctuations that take place in the community composition and structure, and in the trophic interactions among taxa.
The dominance of Baetidae and Chironomidae has been previously reported in other streams of the Iberian Peninsula (e.g. López-Rodríguez et al. Citation2012; Sánchez-Carmona et al. Citation2012) as well as in most worldwide running water habitats (Brittain Citation1982; Ferrington Citation2008). Oscoz et al. (Citation2011) recognize that Chironomidae is the most important and diverse family in the aquatic environment, and that they often dominate the invertebrate fauna in terms of absolute numbers and sometimes even in biomass. As well for Baetidae, Oscoz et al. (Citation2011) reported that this is generally the most common mayfly family in Spanish waters. Moreover, both families, Chironomidae and Baetidae, are often the most common prey of macroinvertebrate predators in Holarctic rivers (e.g. Allan Citation1982) and particularly in Mediterranean rivers (e.g. Bo et al. Citation2008; Fenoglio et al. Citation2010).
Differences in both composition and abundance are also reflected in the diversity of the community. This fluctuates throughout the year, but is higher in winter and lower in summer. The evenness also shows the same pattern. This is probably a consequence of the phenology of the taxa present in the stream: many of them are univoltine taxa with a spring flight period, thus they disappear from the stream (as nymphs or larvae) during the summer. Although the number of taxa in June (when the minimum of diversity and evenness is recorded) is high, just a few families dominate the community. Some of these families are composed of eurythermal species, and some are also multivoltine (for instance, Baetidae), so their population size in summer use to be very high (e.g. Kukula Citation1997; Muñoz Citation2003; Bottová & Derka Citation2013).
Functional feeding groups
In this study, we recorded that functional feeding group abundances differed among months. Predators, collector-filterers and shredders had a constant trend during the whole period, with a maximum peak of shredders in December, probably due to the high input of coarse particulate organic matter in the form of terrestrial leaves occurring in autumn. Nonetheless, the riparian vegetation is relatively scarce in the study area and modified by human, so this may be the reason why this group is so scarce in comparison with the others. Collector-filterers are represented by a single family, Simuliidae, and for this reason are scarce at any time too. Blackflies, typically filter-feeders, had prey in their gut. This can be explained by the fact that they can feed both filtering particles in suspension (and some of this particles may be small organisms drifting in the water column) and scraping the substrate (Allan & Castillo Citation2007; Vannucchi et al. Citation2013). Collector-gatherers have been the most abundant group, covering the main trophic role during the summer months, probably due to the abundant quantities of fine detritus in the stream derived from the breakdown of leaf litter accumulated during the previous months. During the autumn, scrapers represented the dominant group. It is worthy to underline that the peak of scrapers in this period is expected because much of them are Baetidae, which also have a density peak in that period.
The food web of the Cacín stream
Regarding the food web, and considering the S and the LD, we observe that this last variable has a maximum in May, when also a high S is recorded. In other months (particularly in November), this variable has lower values, but S does not differ greatly (26 in May vs. 27 in November). In fact, as shown in results, there is no correlation between S and the number of taxa with linkage density. Other authors (Sánchez-Carmona et al. Citation2012) pointed out a clear increase in linkage density with taxa richness in different Mediterranean streams. Nevertheless, our results also indicate temporal differences in link pattern within the same stream. Taxa in May are probably more interrelated, at least from a trophic point of view, in November. This means that the number of links between nodes is higher during May than in November, promoting also an increase of the complexity. This is particularly relevant because how complexity is related with stability is actually a key topic in ecology [see May (Citation1972) and Pimm (Citation1984), on the one hand, and Neutel et al. (Citation2007) on the other, for different perspectives on this topic]. This is also clearly shown in the C values of these months. We found a negative correlation between C and S, and so between C and the number of taxa due to the high autocorrelation between S and the number of taxa. This occurs as well when we correlate linkage density with diversity. This could suggest a certain generalist behaviour of the organisms in this community, as when there are less taxa and/or they are unequally abundant (i.e. there is lower diversity) they establish, in average, more trophic relations than when more trophic resources are available. This result also underlines the inverse relation that exists in this community between complexity and web size.
November is also the only month in which there are no intermediate nodes, but this is because predators had no recognizable prey in their gut contents. Therefore, these preys are considered primary resources, as no information about their feeding could be used in the building of the food web. For instance, some macroinvertebrates in November have unidentifiable Plecoptera in their guts, and as they cannot be assigned to some particular family, they virtually do not feed upon any resource, so, for example, they are at the same trophic level of fine particulate organic matter. All the other months present both intermediate and top nodes. The high mean fraction of top nodes indicates that this community has a great proportion of organisms that were not fed upon any other macroinvertebrate, but this does not mean that all of them act as top predators, as some of these top nodes may be herbivores without macroinvertebrate predators. Cannibalistic relations appear from March to September. Nonetheless, this cannibalism must be understood in a wide sense, considering that we are working with nodes that are mainly equivalent to families, so a species that feed on other species of the same family (node) would be a cannibal under this model. The negative correlation found between the fraction of cannibals and diversity points out that, when diversity is reduced, the proportion of cannibals seems to increase. This may be related to the lower abundance of prey of which to feed on. The fraction of omnivores is very low, but it exists, with the highest values recorded in March and April. The presence of organisms feeding on different trophic levels could provide the community and the food web with an extra stabilization factor, though some authors suggest that it would have the opposite result, decreasing the stability of such food webs (see, for instance, the review by Kratina et al. Citation2012). In this sense, we did not found a significant correlation between the fraction of omnivores and the diversity of each month. Though there is a certain degree of omnivory in several months in the Cacín stream, the mean shortest chain length values indicate that this food web is relatively short compared to those of other systems (see Williams & Martinez Citation2004), and analogous to those of some lentic environments. The length of the chains forming a food web has been related with the primary production of the ecosystems, the assimilation efficiency of the organisms in the community, and with the perturbations they suffer in their environment (e.g. Lindeman Citation1942; Pimm & Lawton Citation1977). In our community, as there are no great perturbations (compared with more unpredictable streams, as those intermittent or seasonal), these low values of chain length could be due to many of the intermediate consumers feeding on nutrient-poor resources (or at least difficult to assimilate), such as fine detritus or leaves, and affecting, therefore, the growth of these populations and of those predators.
On the other hand, and in contrast with the results of Sánchez-Carmona et al. (Citation2012), who recorded a mean value of vulnerability SD of 0.58 and a mean value of 1.77 of generality SD for several Mediterranean streams, we found higher values of vulnerability SD than of generality SD. This indicates that each of our nodes has several taxa feeding on them and they feed upon relatively few resources, and so that the number of consumers per taxon was greater than the number of resources per taxon.
Food web model analyses
From the results of the model analyses, we can observe that the CM (and sometimes together with the RM) behaves different to the other models considered in this work for almost every studied parameter and does not give a value of the parameter comparable to the empirical one. This may be due to the fact that the CM does not consider loops, and there is a certain fraction of cannibals in the community of the Cacín stream, and, finally, because it has been proved that the CM is more sensitive to loss of species, mainly the most connected species (Dunne & Williams Citation2009), which can occur during the modelling process. This would explain the significant differences found with almost every other model in nearly every studied parameter (with the only exception of vulnerability standard deviation and mean shortest chain length, in the latter due to the great variability of the values obtained with the RM). Curiously, even the RM, which would be expected to fit less properly to data, approximates more to the observed values of some parameters than the CM. In this sense, Dunne and Williams (Citation2009) found that, for several food web parameters, the CM fitted better to data than an RM, but that the CM fitted data much worse than the NM. Williams and Martinez (Citation2008) also proved the fitting of several models with empirical data and found that, for several parameters, they performed similarly, but for some others there were significant differences.
Overall, none of the models used in this analysis predicted accurately the observed values for every food web parameter considered by us, but the NM, the NHM and the RNM provided more realistic values, mainly when considering values monthly.
Conclusion
Our results show a considerably variability both in diversity, trophic roles and food web structure with time in this Mediterranean stream community. This reveals the importance of analyzing the dynamics of the communities in this kind of studies to properly understand the ecosystem functioning. This could be the reason why none of the models used in this study fitted properly the observed values for every food web parameter considered here. Nevertheless, some of them, as the NM, the NHM and the RNM provided more realistic results with temporal data. It is difficult to find a lotic system in which the community is relatively stable (even in permanent habitats, as the one studied here, which is supposed to have relatively stable conditions). Nevertheless, it is essential to focus community level studies and food web approaches from a temporal, dynamic, point of view. This will provide us with more precise information about which organisms are implicated in the processing of organic matter, and so the flow of energy in streams.
Disclosure statement
No potential conflict of interest was reported by the authors.
Additional information
Notes on contributors

Patrizia E. Vannucchi
Patrizia E. Vannucchi is a PhD student of the Department of Ecological Science at the James Hutton Institute (Aberdeen, Scotland). After studying the ecology of aquatic communities of stream and rivers, her study now focuses on soil molecular ecology, more specifically on the identification through DNA barcoding of oribatid mites communities.

Ignacio Peralta-Maraver
Ignacio Peralta-Maraver is a PhD student of the Department of Life Sciences at the Roehampton University (London). His research focuses on the biology and ecology of aquatic communities of stream and rivers. Currently, he is studying the link between species richness, abundance, trophic relationships, metabolic activity and secondary production of the protozoan and invertebrate communities, and their relationship with the biogeochemical conditions, flow-paths and pollutants in the hyporheic zone of lotic ecosystems.
J. Manuel Tierno de Figueroa
Dr. J. Manuel Tierno de Figueroa is associate professor at the University of Granada (Spain). He is author of more than 270 scientific publications dealing on biology and ecology of aquatic ecosystems, mainly lotic systems, and especially on aquatic insects and other animals.

Manuel J. López-Rodríguez
Dr. Manuel J. López-Rodríguez is assistant professor at the University of Granada (Spain). In his principal research line, he deals with the biology of stream macroinvertebrates, mainly aquatic insects, studying their life cycle, trophic ecology and secondary production. He also has made some contributions on other ecological aspects of lotic ecosystems.
References
- Allan JD. 1982. Feeding habits and prey consumption of three setipalpian stoneflies (Plecoptera) in a mountain stream. Ecology. 63:26–34.
- Allan JD, Castillo MM. 2007. Stream ecology. Structure and function of running waters. 2nd ed. Dordrecht: Springer.
- Bascompte J. 2009. Disentangling the web of life. Science. 325:416–419.
- Bello CL, Cabrera MI. 1999. Uso de la técnica microhistológica de Cavender y Hansen en la identificación de insectos acuáticos. [Use of the microhistological technique of Cavender and Hansen in the identification of aquatic insects] Bol Ent ven. 14:77–79.
- Bo T, Fenoglio S, López-Rodríguez MJ, Tierno de Figueroa JM. 2008. Trophic behaviour of two Perlidae species (Insecta, Plecoptera) in a Southern Spain river. Int Rev Hydrobiol. 93:167–174.
- Bogan MT, Lytle DA. 2007. Seasonal flow variation allows ‘time‐sharing’ by disparate aquatic insect communities in montane desert streams. Freshwater Biol. 52:290–304.
- Bonada N, Dolédec S, Statzner B. 2007. Taxonomic and biological trait differences of stream macroinvertebrate communities between Mediterranean and temperate regions: implications for future climatic scenarios. Global Change Biol. 13:1658–1671.
- Bottová K, Derka T. 2013. Life cycle and secondary production of mayflies and stoneflies in karstic stream in the west Carpathians. Ann Zool Fenn. 50:176–188.
- Brittain JE. 1982. Biology of mayflies. Ann Rev Entomol. 27:119–147.
- Cattin MF, Bersier LF, Banašek-Richter C, Baltensperger R, Gabriel JP. 2004. Phylogenetic constraints and adaptation explain food-web structure. Nature 427:835–839.
- Cohen JE, Briand F, Newman CM. 1990. Community food webs: data and theory. Berlin: Springer.
- Cohen JE, Newman CM. 1985. A stochastic theory of community food webs. I. Models and aggregated data. P Roy Soc Lond B Bio. 224:421–448.
- Dunne JA. 2006. The network structure of food webs. In: Pascual M, Dunne JA, editors. Ecological networks: linking structure to dynamics in food webs. Oxford: Oxford University Press; p. 27–86.
- Dunne JA, Williams RJ. 2009. Cascading extinctions and community collapse in model food webs. Philos T Roy Soc Lon B 364:1711–1723.
- Erdös P, Rényi A. 1960. On the evolution of random graphs. Pub Math Inst Hung Aca Sci. 5:17–61.
- Fenoglio S, Bo T, López-Rodríguez MJ, Tierno de Figueroa JM. 2009. Nymphal biology of Brachyptera risi (Morton, 1896) (Plecoptera, Taeniopterygidae) in a North Apennine stream (Italy). Entomol Fennica. 19:228–231.
- Fenoglio S, Bo T, López-Rodríguez MJ, Tierno de Figueroa JM. 2010. Life cycle and nymphal feeding of Besdolus ravizzarum Zwick and Weinzierl, 1995 (Plecoptera: Perlodidae), a threatened stonefly. Insect Sci. 17:149–153.
- Ferrington LC Jr. 2008. Global diversity of non-biting midges (Chironomidae; Insecta-Diptera) in freshwater. Hydrobiologia. 595:447–445.
- Gasith A, Resh VH. 1999. Streams in Mediterranean climate regions: abiotic influences and biotic responses to predictable seasonal events. Annu Rev Ecol Syst. 30:51–81.
- Hershkovitz Y, Gasith A. 2012. Resistance, resilience, and community dynamics in Mediterranean-climate streams. Hydrobiologia. 719:59–75.
- Jaarsma NG, de Boer SM, Townsend CR, Thompson RM, Edwards ED. 1998. Characterising food webs in two New Zealand streams. New Zeal J Mar Fresh. 32:271–286.
- Jáimez-Cuéllar P, Vivas S, Bonada N, Robles S, Mellado A, Álvarez M, Avilés J, Casas J, Ortega M, Pardo I, et al. 2002. Protocolo GUADALMED (PRECE). Limnetica. 21:187–204.
- Junker BH. 2008. Networks in biology. In: Junker BH, Schreiber F, editors. Analysis of biological networks. Hoboken (NJ): Wiley; p. 3–14.
- Kolasa J, Rollo CD. 1991. Introduction: the heterogeneity of heterogeneity: a glossary. In Kolasa J, Pickett STA, editors. Ecological heterogeneity. New York: Springer-Verlag; p. 1–23.
- Kratina P, LeCraw RM, Ingram T, Anholt BR. 2012. Stability and persistence of food webs with omnivory: is there a general pattern? Ecosphere. 3:1–18, art.50.
- Kukula K. 1997. The life cycles of three species of Ephemeroptera in two streams in Poland. Hydrobiologia. 353:193–198.
- Lindeman R. 1942. The trophic-dynamic aspect of ecology. Ecology. 23:399–418.
- López-Rodríguez MJ, Peralta-Maraver I, Gaetani B, Sainz-Cantero CE, Fochetti R, Tierno de Figueroa JM. 2012. Diversity patterns and food web structure in a Mediterranean intermittent stream. Int Rev Hydrobiol. 97:485–496.
- López-Rodríguez MJ, Tierno de Figueroa JM, Fenoglio S, Bo T, Alba-Tercedor J. 2009. Life strategies of 3 Perlodidae species (Plecoptera) in a Mediterranean seasonal stream in southern Europe. J N Am Benthol Soc. 28:611–625.
- Martinez ND. 1991. Artifacts or attributes? Effects of resolution on the Little Rock Lake food web. Ecol Monogr. 61:367–392.
- May RM. 1972. Will a large complex system be stable? Nature. 238:413–414.
- McElravy EP, Lamberti GA, Resh VH. 1989. Year-to-year variation in the aquatic macroinvertebrate fauna of a northern California stream. J N Am Benthol Soc. 8:51–63.
- Merritt RW, Cummins KW. 1996. An introduction to the aquatic insects of North America. Dubuque: Kendall/Hunt.
- Milne BT. 1991. Heterogeneity as a multiscale characteristics of landscapes. In: Kolasa J, Pickett STA, editors. Ecological heterogeneity. New York: Springer-Verlag; p. 69–84.
- Montoya JM, Pimm SL, Solé RV. 2006. Ecological networks and their fragility. Nature. 442:259–264.
- Morin PJ. 2011. Community ecology. 2nd ed. West Sussex: Wiley-Blackwell.
- Muñoz I. 2003. Macroinvertebrate community structure in an intermittent and a permanent Mediterranean streams (NE Spain). Limnetica. 22:107–116.
- Neutel AM, Heesterbeek JAP, Van de Kuppel J, Hoenderboom G, Vos A, Kaldeway C, Berendse F, de Routier PC. 2007. Reconciling complexity with stability in naturally assembling food webs. Nature. 449:599–602.
- Olesen JM, Jordano P. 2002. Geographic patterns in plant-pollinator mutualistic networks. Ecology. 83:2416–2424.
- Oksanen J, Guillaume Blanchet F, Kindt R, Legendre P, Minchin PR, O'Hara RB, Simpson GL, Solymos P, Stevens MHH, Wagner H. 2013. Vegan: community ecology package. R package Version. 2.0-10. Available from: http://CRAN.R-project.org/package=vegan.
- Oscoz J, Galicia D, Miranda R. 2011. Identification guide of freshwater macroinvertebrates of Spain. Dordrecht: Springer.
- Pascual M, Dunne JA. 2006a. Ecological networks: linking structure to dynamics in food webs. Oxford: Oxford University Press.
- Pascual M, Dunne JA. 2006b. From small to large ecological networks in a dynamic world. In: Pascual M, Dunne JA, editors. Ecological networks: linking structure to dynamics in food webs. Oxford: Oxford University Press; p. 3–24.
- Pimm SL. 1984. The complexity and stability of ecosystems. Nature. 307:321–326.
- Pimm SL, Lawton JH. 1977. Number of trophic levels in ecological communities. Nature. 268:329–331.
- R Core Team [Internet]. 2014. R: a language and environment for statistical computing. Vienna (Austria): R Foundation for Statistical Computing. Available from: http://www.R-project.org/.
- Rosi-Marshall EJ, Wellard Kelly HA, Hall Jr RO, Vallis KA. 2016. Methods for quantifying aquatic macroinvertebrate diets. Freshwater Sci. 35:229–236.
- Rundle SD, Robertson AL, Schmid-Araya JM. 2002. Freshwater meiofauna. Biology and ecology. Leiden: Backhuys Publishers.
- Sánchez-Carmona R, Encina L, Rodríguez-Ruiz A, Rodríguez-Sánchez MV, Granado-Lorencio C. 2012. Food web structure in Mediterranean streams: exploring stabilizing forces in these ecosystems. Aquat Ecol. 46:311–324.
- Southwood TRE. 1977. Habitat, the templet for ecological strategies? J Anim Ecol. 46:337–365.
- Southwood TRE. 1988. Tactics, strategies and templets. Oikos. 52:3–18.
- Stewart AJA, John EA, Hutchings MJ. 2000. The world is heterogeneous: ecological consequences of living in a patchy environment. In: Hutchings MJ, John EA, Stewart AJA, editors. The ecological consequences of environmental heterogeneity. London: British Ecological Society; p. 1–8.
- Stouffer DB, Camacho J, Guimerà R, Ng CA, Nunes Amaral LA. 2005. Quantitative patterns in the structure of model and empirical food webs. Ecology. 86:1301–1311.
- Sweeney BW. 1984. Factors influencing life-history patterns of aquatic insects. In: Resh VH, Rosemberg DM, editors. The ecology of aquatic insects. New York: Praeger. p. 56–100.
- Tachet H, Richoux P, Bournaud M, Usseglio-Polatera P. 2010. Invertébrés d'eau douce. Systématique, biologie, écologie [Freshwater invertebrates. Systematic, biology and ecology]. Paris: CNRS Editions.
- Thompson RM, Townsend CR. 2000. Is resolution the solution?: the effect of taxonomic resolution on the calculated properties of three stream food webs. Freshwater Biol. 44:413–422.
- Townsend CR, Hildrew AG. 1994. Species traits in relation to a habitat templet for river systems. Freshwater Biol. 31:265–275.
- Vannucchi PE, López-Rodríguez MJ, Tierno de Figueroa JM, Gaino E. 2013. Structure and dynamics of a trophic web in a Mediterranean seasonal stream. J Limnol. 72:606–615.
- Williams DD. 1996. Environmental constrains in temporary fresh waters and their consequences for the insect fauna. J N Am Benthol Soc. 15:634–650.
- Williams DD. 2006. The biology of temporary waters. Oxford: Oxford University Press.
- Williams RJ. 2010a. Network3D Software. Cambridge: Microsoft Research.
- Williams RJ. 2010b. Simple MaxEnt models explain food web degree distributions. Theor Ecol. 3:45–52.
- Williams RJ, Anandanadesan A, Purves D. 2010. The probabilistic niche model reveals the niche structure and role of body size in a complex food web. PLoS ONE. 5:e12092.
- Williams RJ, Martinez ND. 2000. Simple rules yield complex food webs. Nature. 404:180–183.
- Williams RJ, Martinez ND. 2004. Limits to trophic levels and omnivory in complex food webs: theory and data. Am Nat. 163:458–468.
- Williams RJ, Martinez ND. 2008. Success and its limits among structural models of complex food webs. J Anim Ecol. 77:512–519.
- Yoon I, Williams RJ, Levine E, Yoon S, Dunne JA, Martinez ND. 2004. Webs on the Web (WoW): 3D visualization of ecological networks on the WWW for collaborative research and education. Proc. SPIE. 5295:124–132.